Comparative analysis of Polyphenol Oxidase
Statistical Analysis
more stable between the range of pH 8 to pH
Linear Regression analysis was performed to determine
10 in 0.1 M sodium phosphate buffer after
the relation between Lycopene and PPO and Lycopene
incubation of 8 days (Figure 4a and 4b, Table 2).
and CAT produced at three different generative stages.
PPO activity reduced to zero at pH 1, 2 and 3 on
All the experiments were performed in triplicates and
6 th , 7 th and 8 th day respectively; which indicates
standard error bars are mentioned in the graphs.
that PPO was more stable at alkaline pH.
(ii)
Temperature:
The
optimum
temperature
Results
measured by assaying enzyme activity at various
temperatures was 40 o C (Figure 2, Table 2). The
Ammonium sulphate fractionation and dialysis
activity obtained was 43.32 µmoles/min/ml.
The fraction containing 50% ammonium sulphate
PPO activity reduced to zero at 70 o C and 80 o C
concentration showed maximum specific activity
after 50 min of incubation; which shows that it
(511.8µmoles/ml/min) for PPO and for CAT 60%
cannot tolerate temperature above 60 o C. The
ammonium sulphate concentration showed maximum
PPO enzyme was more stable between the range
specific activity (800.71µmoles/ml/min). This primary
of 10 o C to 30 o C (Figure 5a, 5b, 5c and Table 2).
purification step resulted in 2.61 fold purification of PPO
(iii)
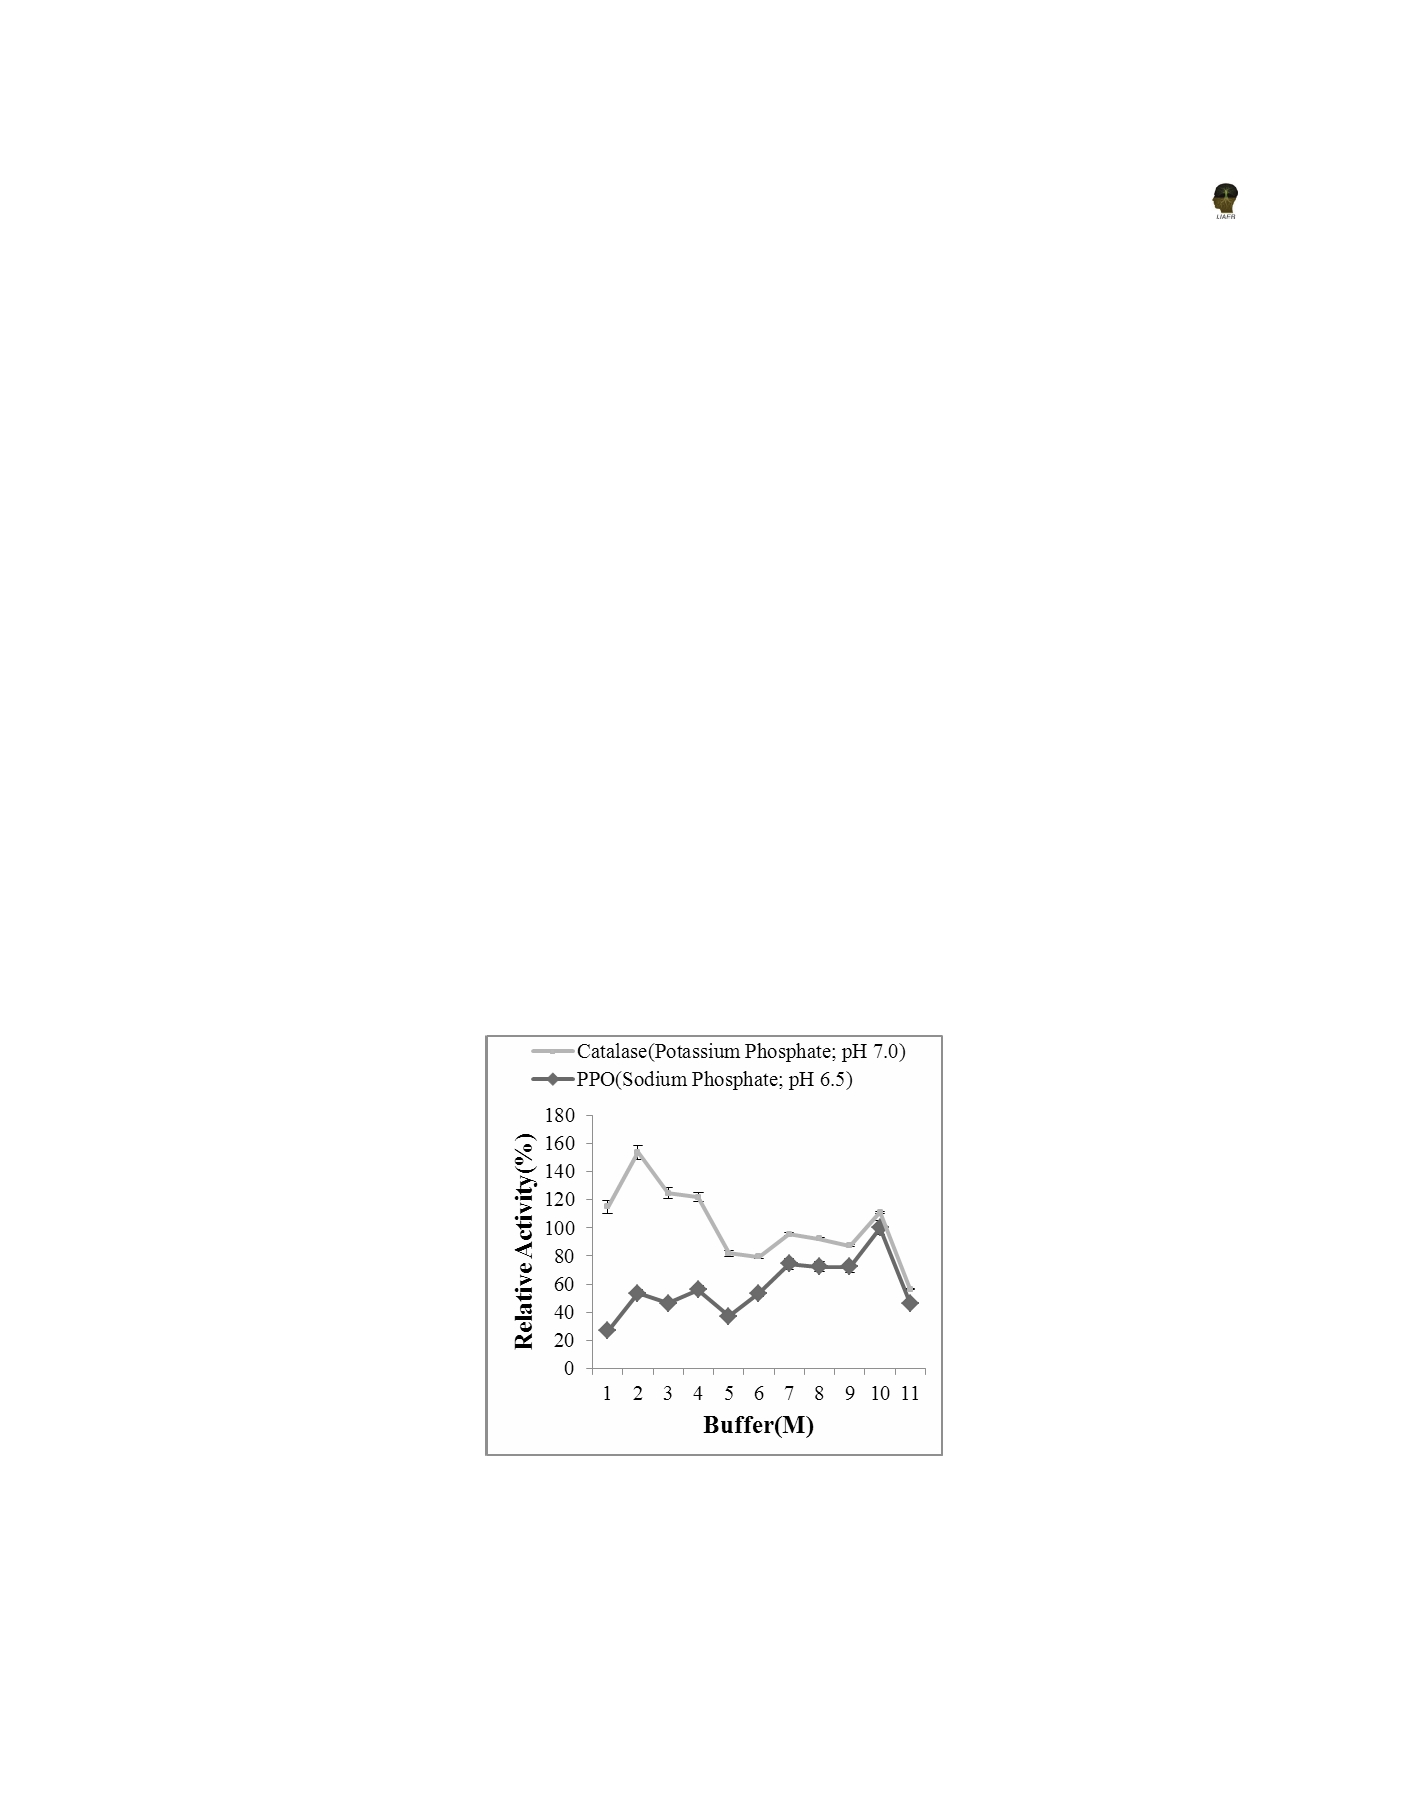
Ionic strength: The optimum molarity for PPO
and 2.11 fold purification of CAT with 22.55% and 62.3%
assayed was in 0.9M Sodium Phosphate buffer
yield respectively (Table 1)
(pH 6.5), (Figure 3, Table 2).The activity
measured was 35.53µmoles/min/ml.
Kinetic studies for PPO
(i)
pH: The optimum pH found by assaying enzyme
activity at different pH levels was 7.0 (Figure
1, Table 2) in 0.1M Sodium Phosphate buffer.
The enzyme activity measured at pH 7.0 was
53.54µmoles/ml/min. However, PPO was found
Figure 3. Optimum molarity profile for PPO and CAT
413