Lokhandwala and Bora
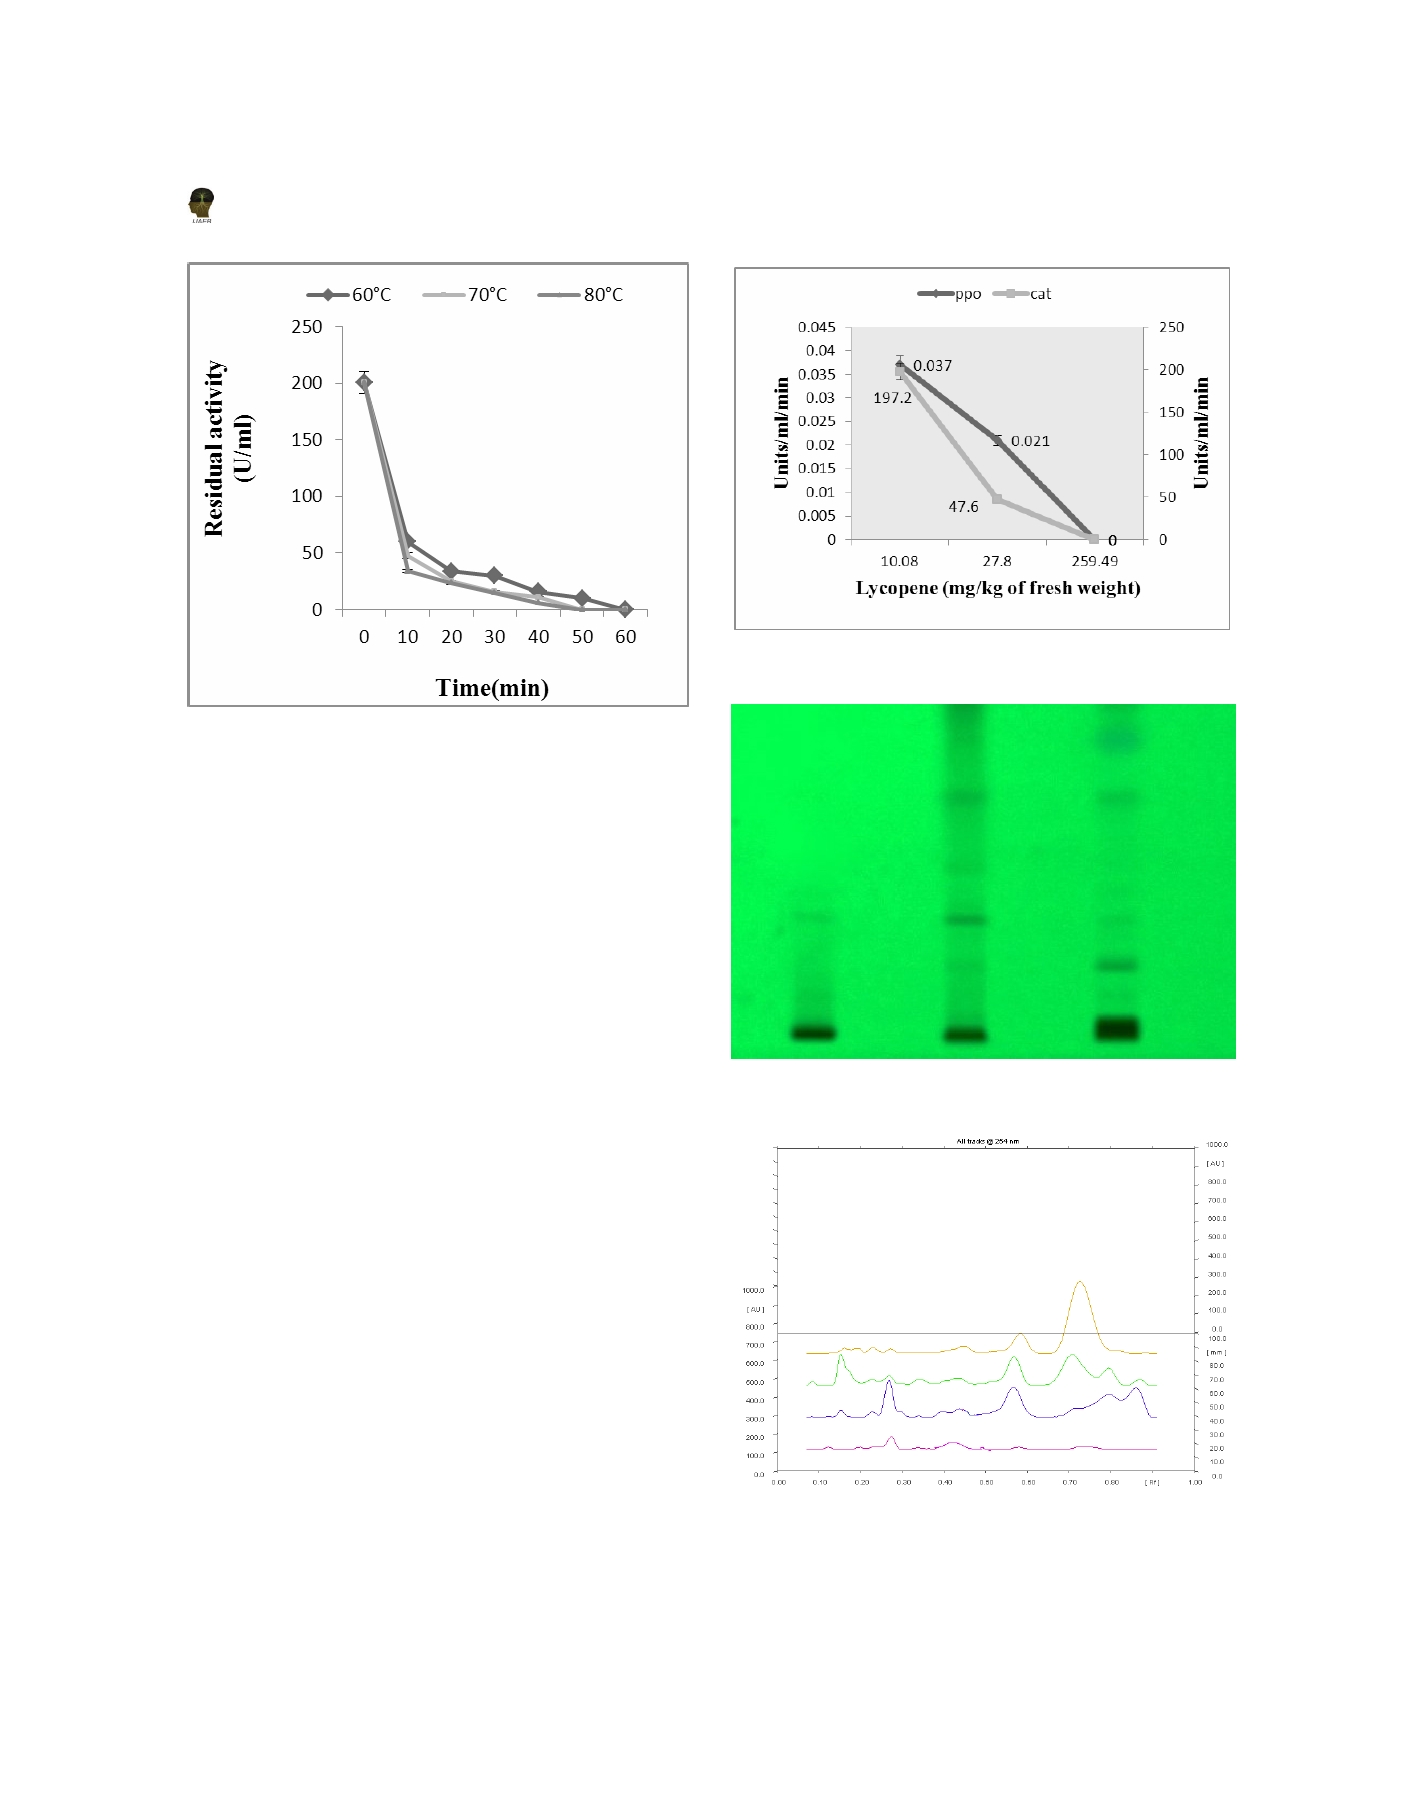
Figure 8. Lycopene, PPO and CAT production at different
ontogenic stages in tomato plant.
Figure 7c. Temperature stability profile for CAT
(60°C, 70°C and 80°C)
(iii)
Ionic Strength: The optimum molarity for CAT
assayed was 0.1 M Potassium phosphate buffer
(pH7.0).Theactivityobtainedwas98.72µmoles/
min/ml (Figure 3, Table 2). CAT activity is
higher than PPO under their respective optimum
parameters though CAT is more unstable enzyme
than PPO at a particular parameter.
Lycopene, CAT and PPO at three ontogenic stages
Lycopene production was highest at fruit stage (259.49mg/
kg of fresh weight), while CAT and PPO activity was
Figure 9. HPTLC plate for Lycopene at different stages
under 285nm
highest at seedling stage (197.12U/ml and 0.037U/ml).
CAT and PPO activity was negligible at fruit stage, but
Lycopene production was observed at both seedling and
flowering stage; however, it was significantly less than
that produced at fruit stage which was confirmed by
HPTLC analysis also where Lycopene peak was highest
at fruit stage. Analysis also showed that PPO production
was extremely less as compared to CAT production at
both seedling and flowering stage (Figure 8, 9, 10 and
Table 3).
Statistical analysis
Correlation coefficient (r) obtained from Linear
Regression analysis between Lycopene, PPO and
CAT was -0.9279108012 for Lycopene and PPO while
Figure 10. Peaks obtained from HPTLC plate
(CAT software)
416