Prajapati et al.
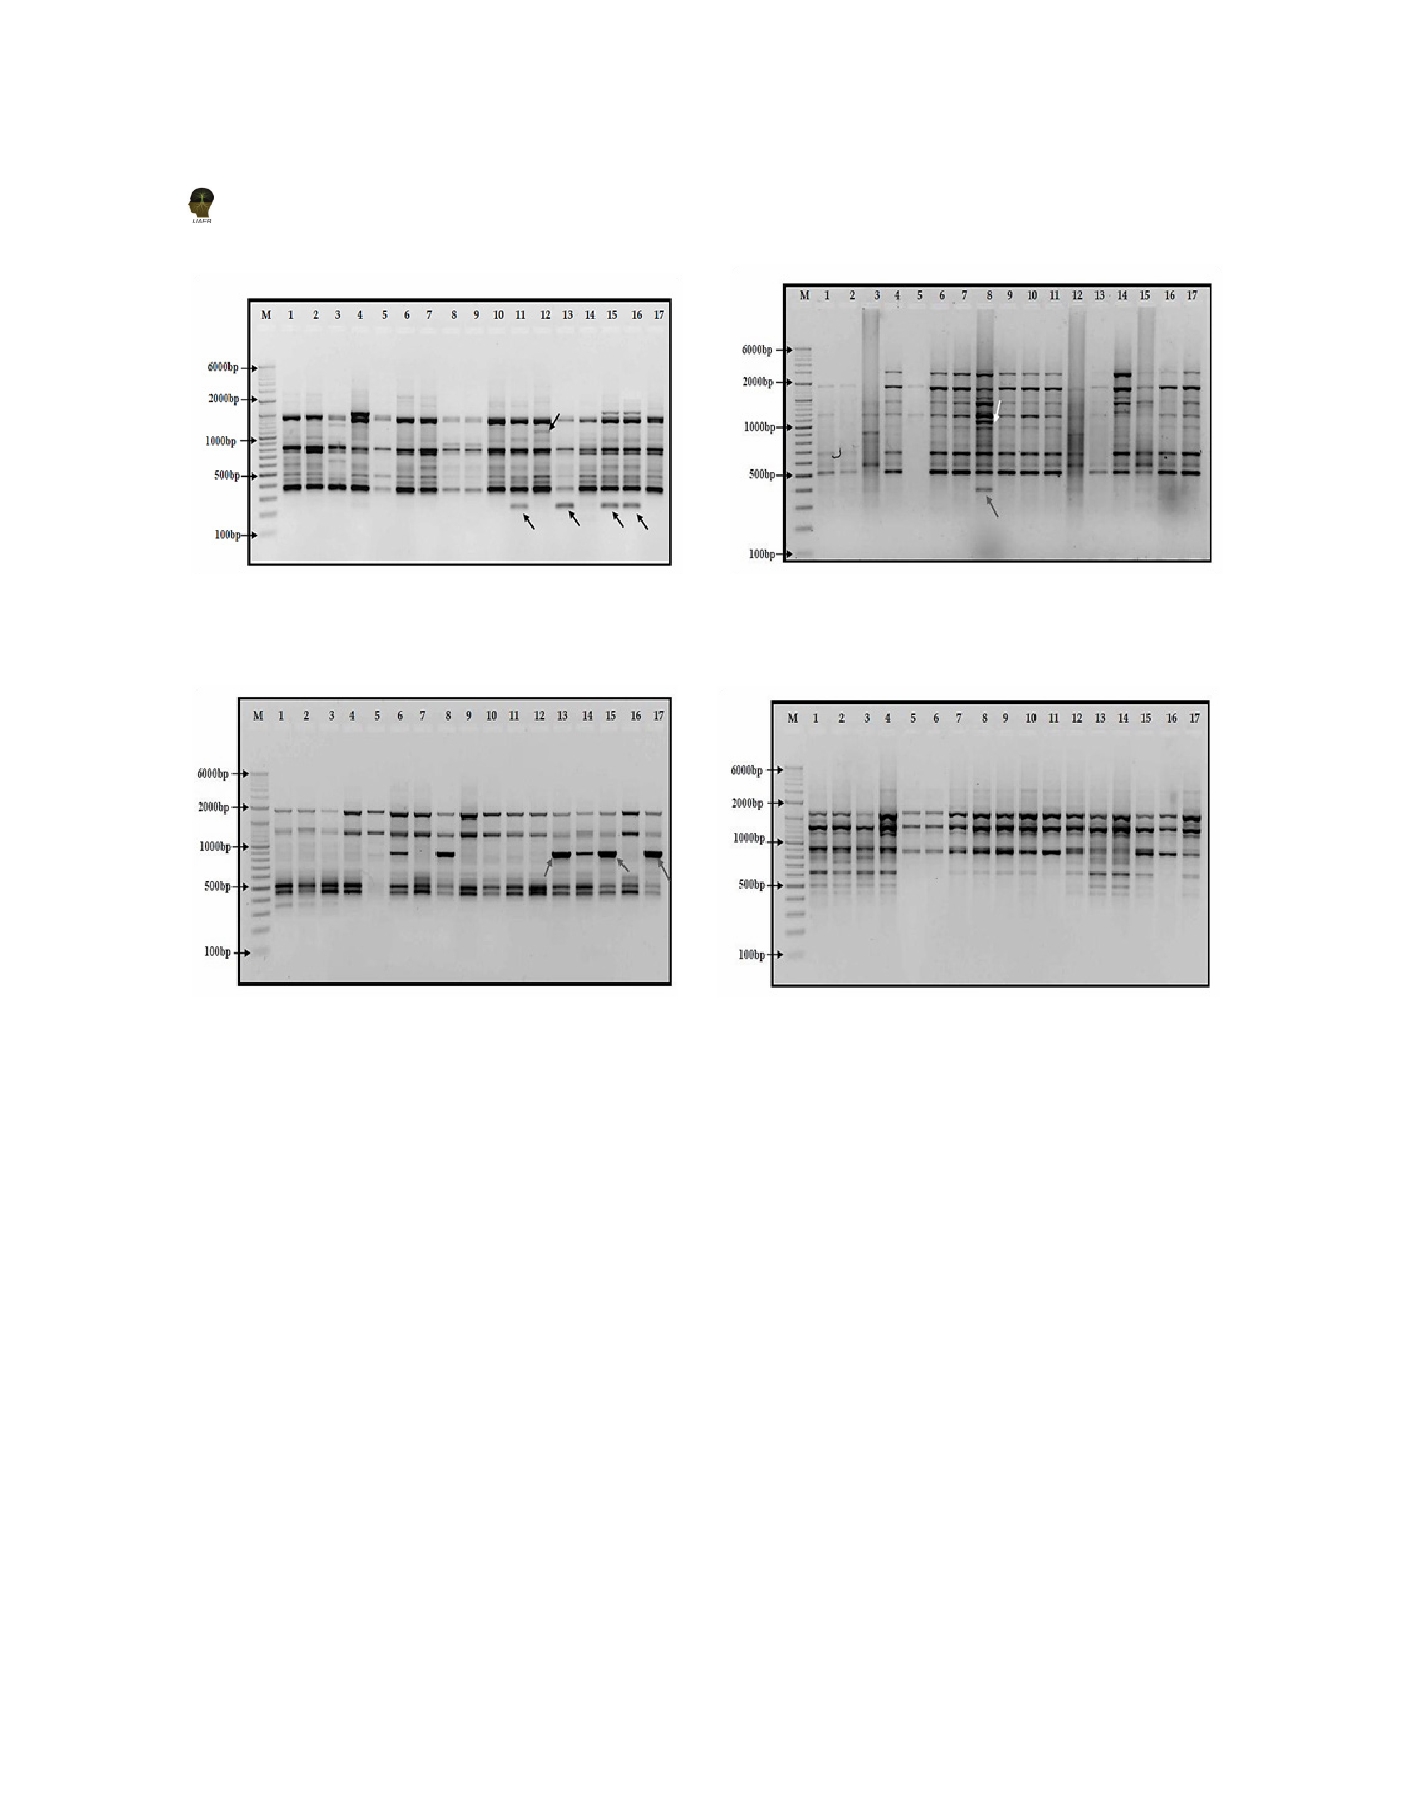
Figure 2: RAPD profile of primer 13ES10C24
Figure 3: RAPD profile of primer OPAC-11
Figure 4: RAPD profile of primer OPG-08
Figure 5: RAPD profile of primer OPP-06
(OPN-12) to 3428 bp (OPA-09) (Table 2). The highest
The RAPD cluster pattern is presented Figure 1. It
similarity index value of 0.90 was found between GT-1
showed two major clusters namely A and B formed at
and GT–100, while the least similarity index value of 0.52
a similarity coefficient of 0.63 (Fig. 1). Cluster A was
was found between GT-101 and ICP-8863. The average
divided into two sub-clusters A1 and A2. Grouping of
similarity coefficient among genotypes was 0.77. The
four genotypes that are susceptible to fusarium wilt were
RAPD marker 16ES10C27 produced maximum number
in one majorcluster ‘A1’. Sub-cluster A1 included two
of 150 bands, while OPAZ-18 produced the minimum
minor clusters in which one consisted GT-101 alone and
number of 60 bands. OPAC-11, 22ES10G33 and OPAZ-
another minor cluster included genotypes viz ., GT-1, GT-
18 produced highest polymorphism of 90, 90 and 88.8 %
100 and GT-102. Sub-cluster A2 consisted of BANAS
respectively. The RAPD marker OPN-09 gave the lowest
genotype alone which is susceptible to fusarium wilt.
polymorphism i.e. 25%. The highest PIC value obtained
Cluster B was divided into two sub-clusters B1 and B2.
was 0.91 for 13ES10C24 marker and lowest PIC value was
Sub-cluster B1 included two genotypes, AVPP-1 and
0.77 for OPA-18. Marker index value for pooled RAPD
AGT-2. Sub-cluster B2 included three minor clusters
data was found to be 11.65. A dendrogram was generated
in which one consisted of viz., T-15-15, LRG-41, C-11,
showing the grouping of genotypes according to their
BDN-2 and ICPL-87. It contained both resistant and
resistance and susceptibility reaction to fusarium wilt.
susceptible genotypes. Since resistance and susceptibility
464