Production of Exopolysaccharide
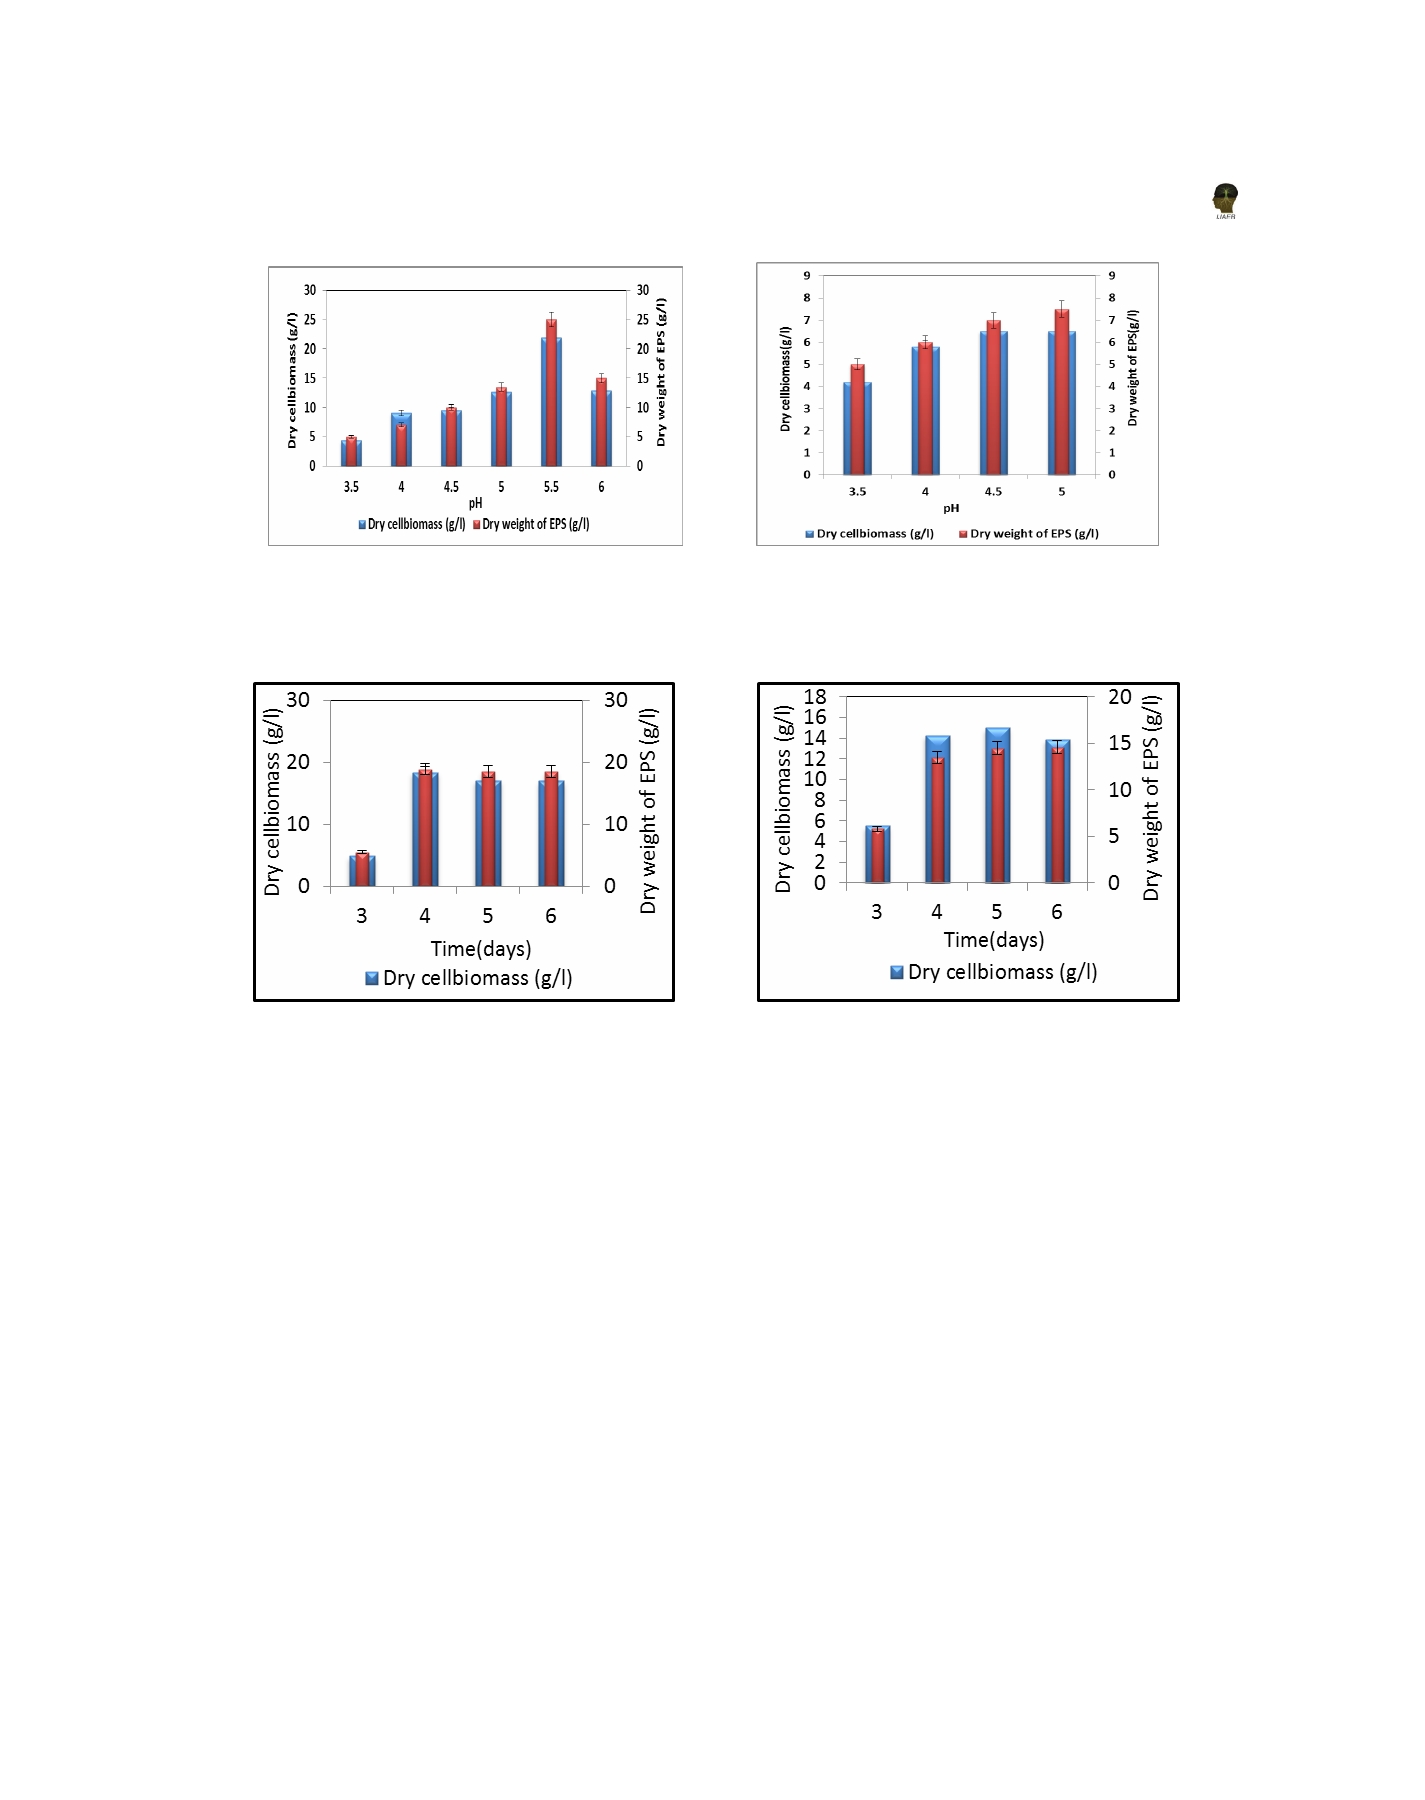
Fig 5 (a): Effect of pH on EPS production by
Fig 5 (b): Effect of pH on EPS production
SGMP1 fungal isolate
by SGMP2 fungal isolate
Fig 6 (a): Effect of incubation period on
Fig 6 (b): Effect of incubation period
EPS production by SGMP1 fungal isolate
on EPS production by SGMP2 fungal isolate
Fourier
Transform
Infrared
Spectrophotometer
Antimicrobial activity of EPS
(FTIR)
EPS samples of both the fungal isolates were investigated
IR spectrum of crude EPS obtained from SGMP1 and
for antimicrobial activity against different pathogenic
SGMP2 revealed the characteristic functional groups of
gram positive and gram negative bacterial strains. As
EPS (Fig. 7(a) and 7(b)). The sharp peak in the range of
shown in Fig. 8, the zone of inhibition against gram-
1400-1500 cm -1 indicates the presence of polysaccharide,
positive Staphylococcus aureus and gram-negative
carboxylic acids and lactones which suffices the nature
Salmonella typhi, Pseudomonas aeruginosa , Escherichia
of polysaccharide. In the spectra of SGMP1 EPS, the
coli were observed. Saskiawan (2009) also reported the
sharp peak at 1200-1000 cm -1 also strongly suggests the
antimicrobial activity of EPS produced by P. ostreatus
presence of phosphorus compounds. In the spectra of
against E.coli, B. subtilis and S. cerevisiae .
SGMP2 EPS, the sharp peak at 1631.45 cm -1 strongly
suggest presence of vinyl alkenes with C=O stretching.
517