Prajapati et al.
of various organic nitrogen sources (Saratale et al . 2009;
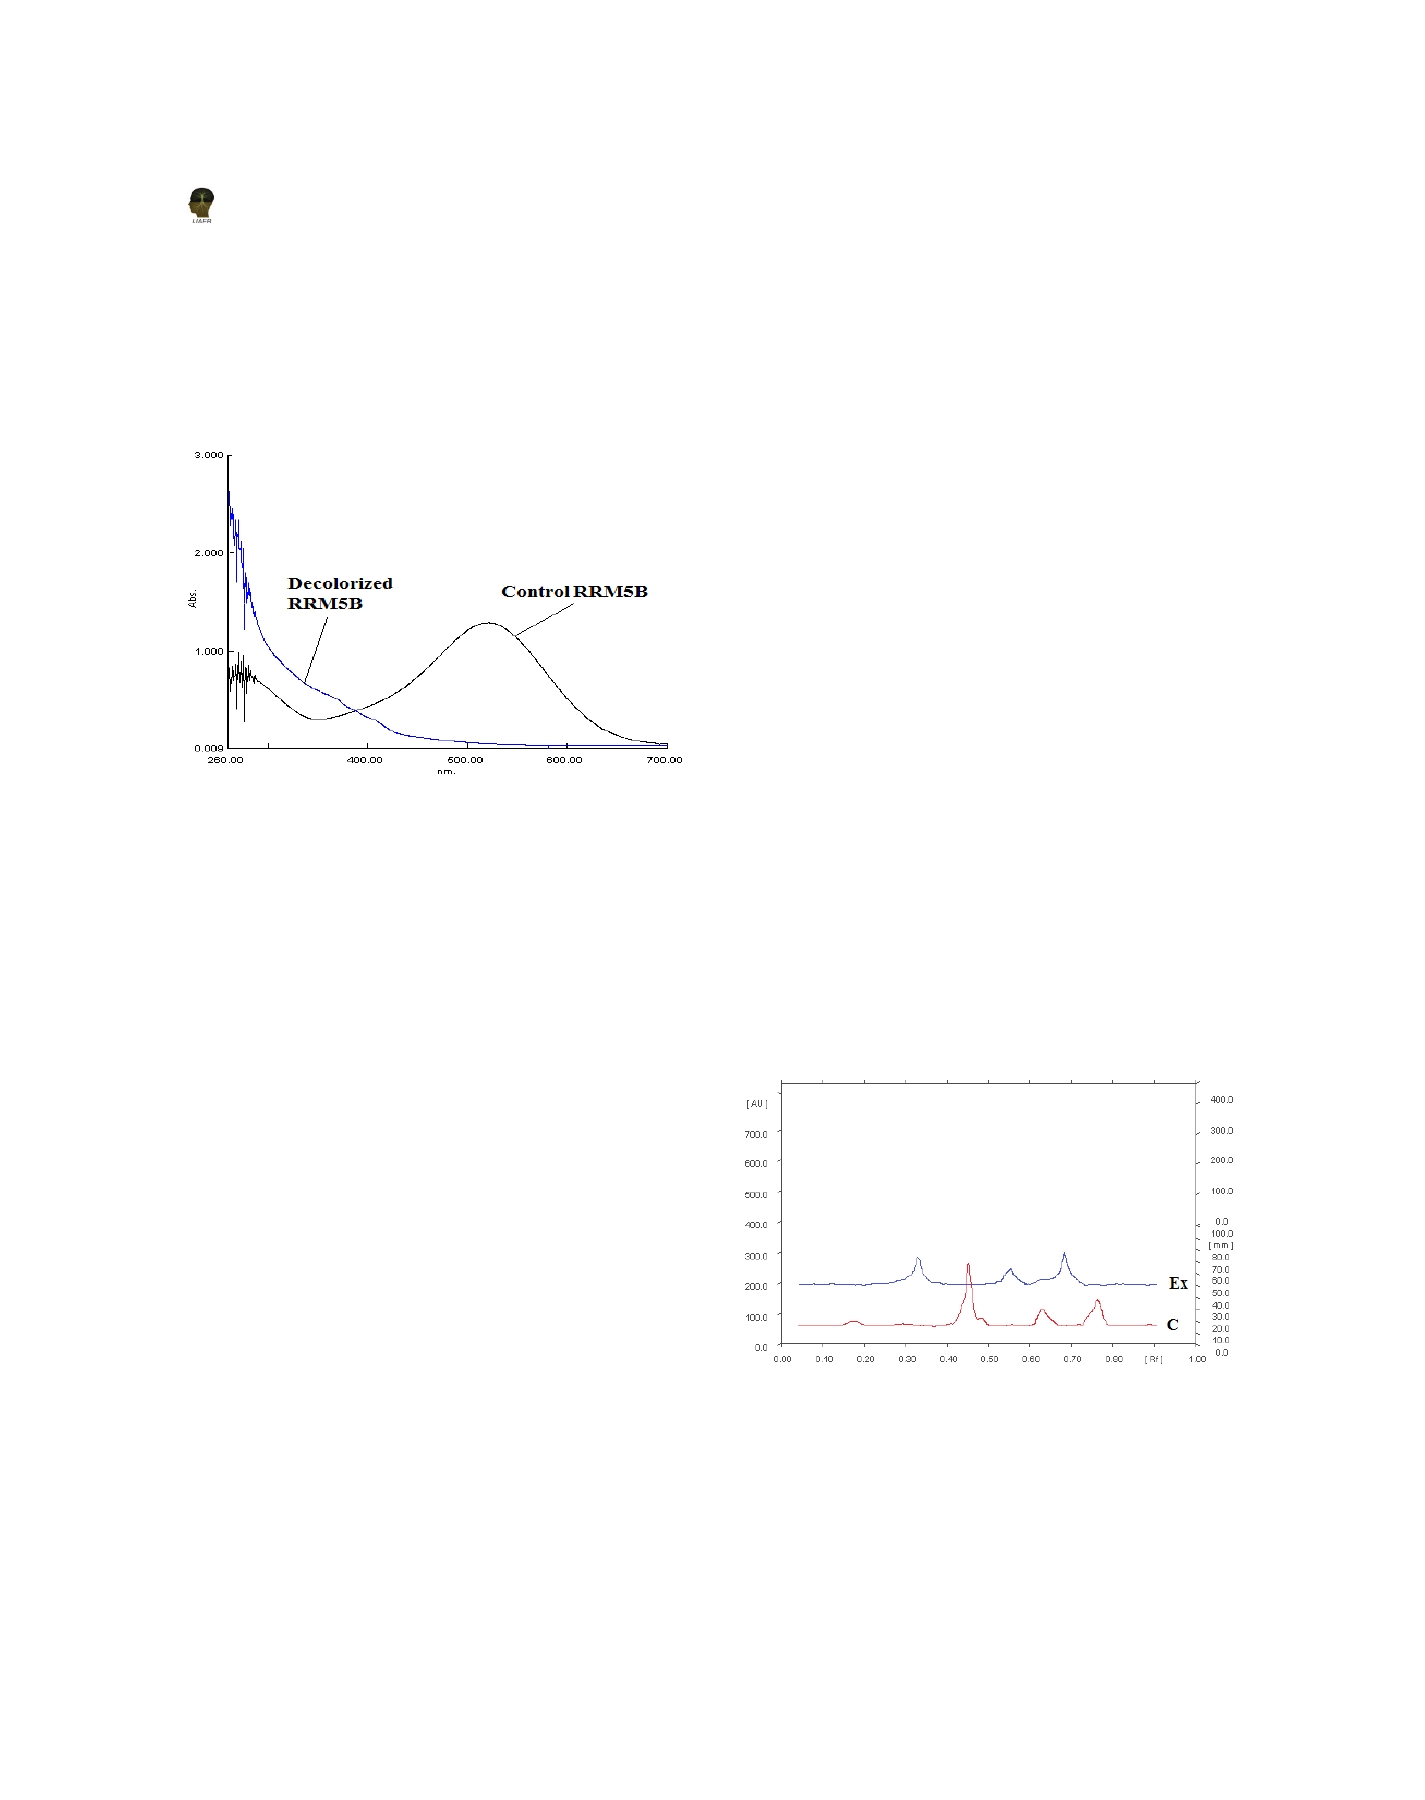
control and decolorized samples of Reactive Red M5B
Ponraj et al . 2011). In contrast to this, various inorganic
were analysed at 538 nm for assessment of biodegradation.
nitrogen sources like ammonium nitrate and ammonium
The absorption peak for treated dye samples gradually
sulfate have been reported to enhance decolorization of
decreased with the time and disappeared completely,
different dyes by white rot fungi (Asgher et al ., 2009;
which correlate with an apparent decolorization of the
and Singh et al . 2012).
dye. In addition, extra peaks appeared in Uv region may
be due to biotransformation or degradation of the dye and
generation of different metabolites (Fig. 9). Moreover, the
pH of the decolorized medium was around 5.5, indicating
that the color removal was due to biological activity of
the isolate AGYP-1, not because of the change in pH. The
observed results suggested the biodegradation capacity of
the isolate AGYP-1.
3.5.2 HPTLC analysis
The assessment of degraded metabolites was further
performed by HPTLC. Figure 10 demonstrates the
HPTLC analysis of parent dye Reactive Red M5B and
metabolites formed after degradation. The chromatogram
Figure 9: UV-Visible spectral analysis of Reactive Red M5B
when observed under UV light (254 nm), the control
during decolorization by fungal isolate AGYP-1
sample showed presence of 3 bands with R values of 0.45,
f
The decolorization of Reactive Red M5B by isolate
0.62 and 0.76. After decolorization, the control bands
AGYP-1 was monitored in the presence of gelatine
disappeared and new bands with R f values of 0.31, 0.55
in the range of 0.25 to 10.0 g l -1 (Fig. 8). At 2.5 g l -1
and 0.71 appeared. The results obtained in decolorized
concentration of gelatine, the isolate exhibited maximum
dye sample indicated the formation of new metabolites
decolorization of the dye (98.78±2.5%) within 8 days of
or metabolic intermediates that are different from the
incubation. No significant decolorization of the dye was
parent dye. This signifies the effectiveness of the isolate
obtained with an increase in concentration of gelatine.
AGYP-1 for the degradation of Reactive Red M5B.
The isolate AGYP-1 could grow best (0.308±0.04 g) and
produced high amount of ligninolytic enzymes at 2.5 g
l -1 concentration of gelatine. Under optimized culture
condition, the laccase and MnP activities were 10.28 and
18.66 times higher, which resulted into 1.6 times faster
decolorization of reactive Red M5B by isolate AGYP-1.
The improvement in the production of ligninolytic
enzymes as well as dye removal by different fungal
strains has also been previously reported with optimum
carbon and nitrogen sources (Asgher et al ., 2012).
3.5 Decolorization and degradation analysis of Reactive
Red M5B
Figure 10: Densitometric scan of HPTLC chromatogram of
control Reactive Red M5B (C) and its decolorized samples
3.5.1 UV-visible spectrophotometric analysis
(Ex)
Degradation of dyes can be revealed by examination
of light absorbance spectra during decolorization. The
508