Reza et al.
describe variograms (Webster and Oliver, 2001).
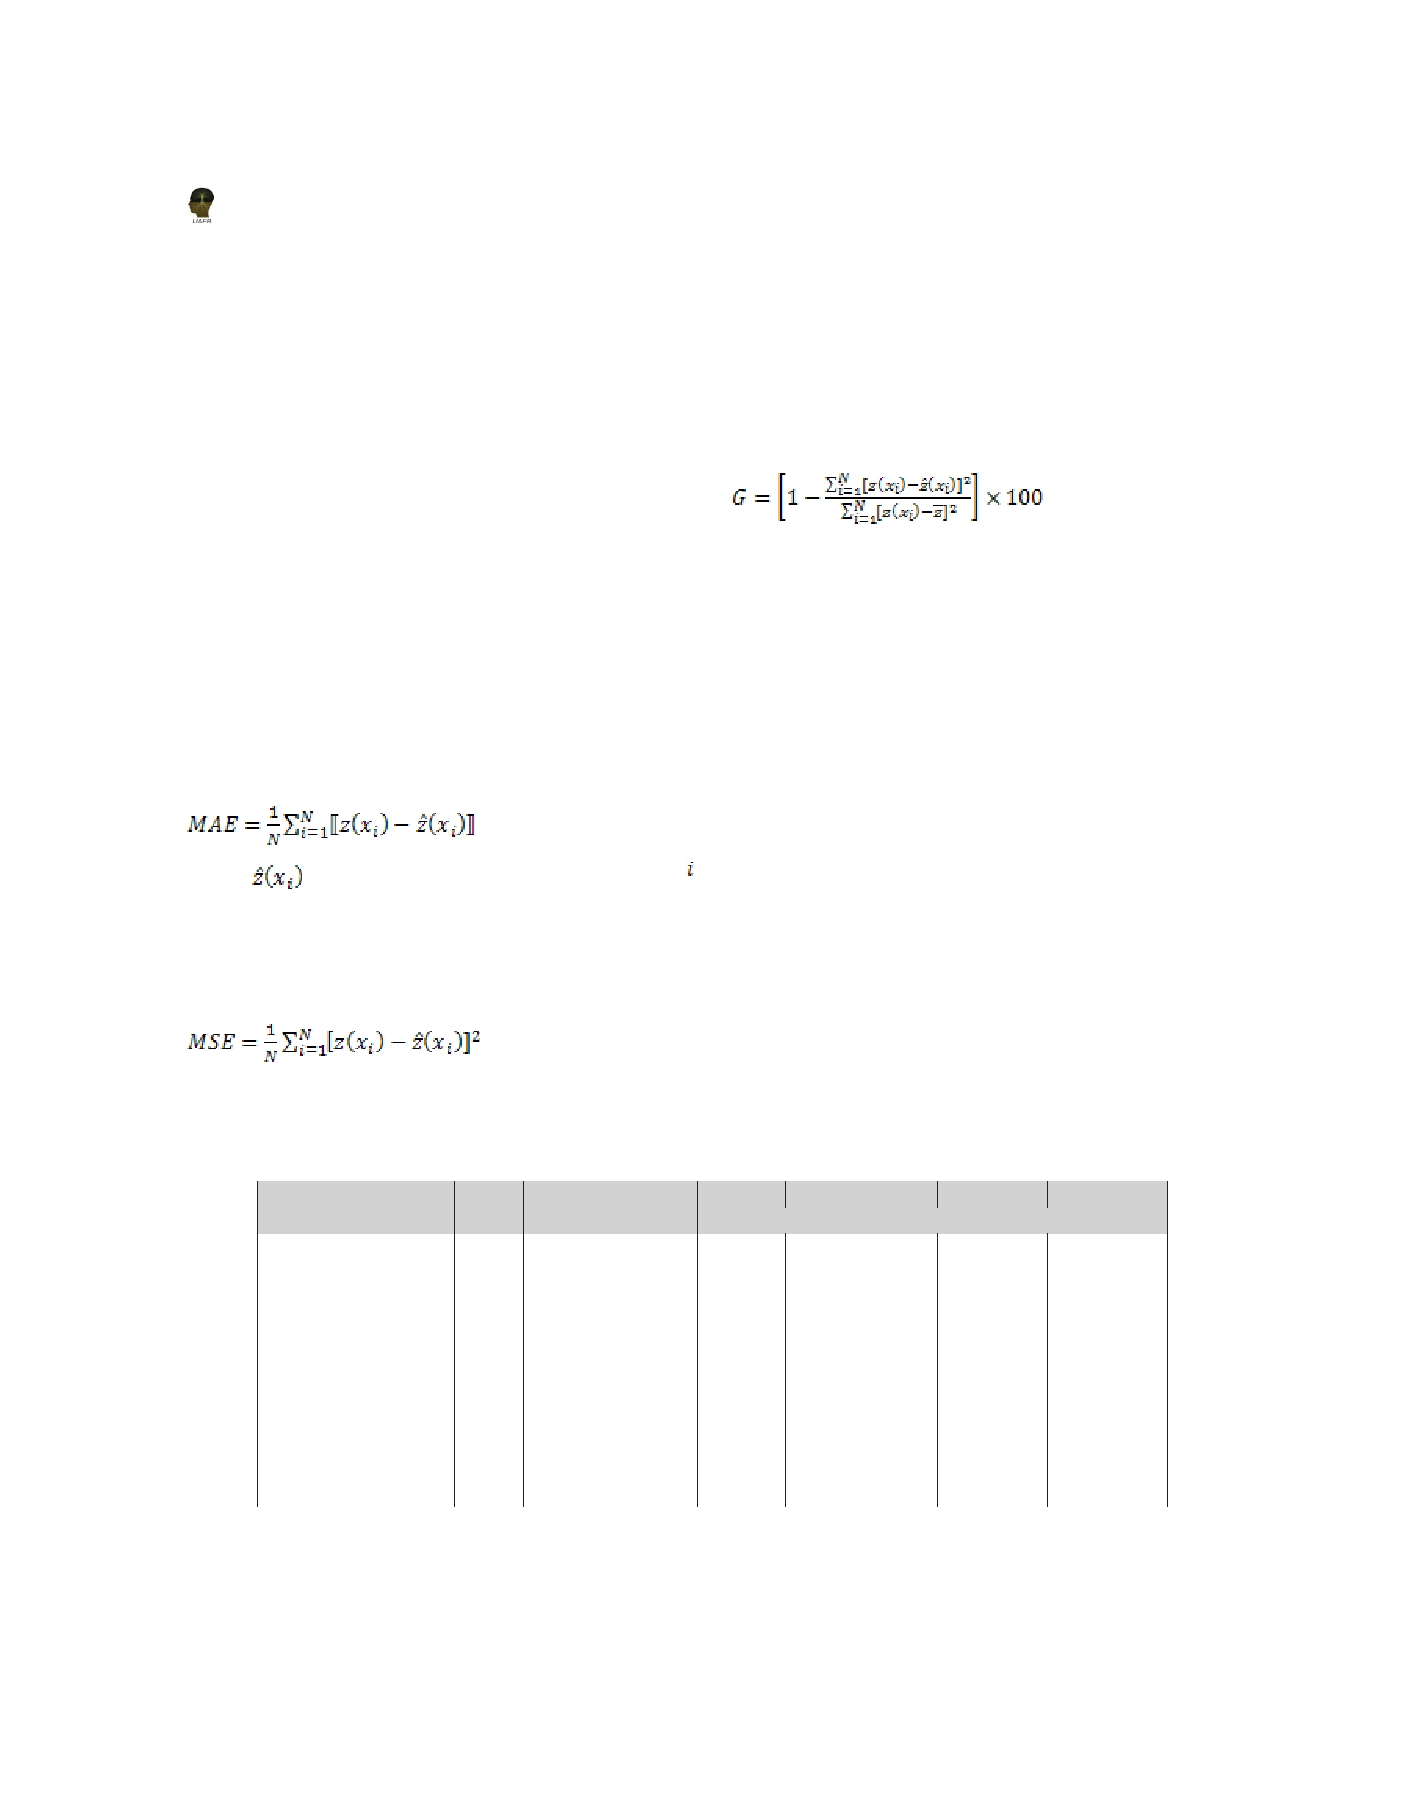
Squaring the difference at any point gives an
An estimate of the indicator random function may
indication of the magnitude, e.g. small MSE values
then be obtained for a location x by kriging from
indicate more accurate estimation, point-by-point.
the neighbouring indicator-transformed data. IK
The G measure gives an indication of how effective a
is equivalent to simple kriging of the indicator
prediction might be relative to that which could have
been derived from using the sample mean alone
variables ω c ( x ) using the mean within the kriging
neighbourhood as the expectation.
(Schloeder et al., 2001).
Accuracy assessment
Accuracy of the soil maps was evaluated through
Where z is the sample mean. If G = 100, it indicates
cross-validation approach (Davis, 1987; Reza et al.,
perfect prediction, while negative values indicate
2010). Among three evaluation indices used in this
that the predictions are less reliable than using
study,meanabsoluteerror(MAE),andmeansquared
sample mean as the predictors. The comparison of
error (MSE) measure the accuracy of prediction,
performance between interpolations was achieved
whereas goodness of prediction ( G ) measures the
by using mean absolute error (MAE).
effectiveness of prediction (Reza et al., 2010). MAE is
a measure of the sum of the residuals ( e.g. predicted
Results and Discussion
minus observed) (Voltz and Webster, 1990).
Descriptive statistics of heavy metals and other soil
properties
The statistical characteristics of soil Cr, Cd, Ni and
Where
is the predicted value at location
Pb are listed in Table 1. The median of each heavy
. Small MAE values indicate less error. The
metal was lower than the mean, which indicates that
MAE measure, however, does not reveal
the effects of abnormal data on sampling value were
the magnitude of errorthat might occur at
not great. In the present investigation, among the
any point and hence MSE will be calculated,
heavy metals studied (Cr, Cd, Ni and Pb), the mean
Table 1. Summary statistics of heavy metal concentrations and selected soil properties
Organic carbon
Cr
Cd
Pb
Ni
pH
(%)
mg kg − 1
Mean
4.7
3.44
74.10
1.68
87.84
45.20
Median
4.5
2.67
63.21
1.52
81.56
32.78
SD
0.47
1.82
13.88
2.00
22.96
44.10
CV (%)
10.0
52.9
18.7
119.0
26.1
97.6
Minimum
3.7
0.54
47.28
0.08
22.24
0.08
Maximum
5.9
7.01
106.48
8.12
127.44
293.92
Skewness
− 0.02
0.14
0.11
2.12
− 0.63
2.94
Kurtosis
− 0.54
− 1.35
− 0.38
3.44
− 0.11
13.53
Distribution pattern
Normal
Lognormal
Normal
Lognormal
SD, Standard deviation; CV, Co-efficient of variation
790