Soil risk assessment of heavy metal
Table 2. Semivariogram model and parameters of heavy metals
Heavy metals
Fitted model
Nugget (C 0 )
Sill (C + C 0 )
Range (A) (m)
Nugget/Sill
Cr
Circular
0.411
1.981
1240
0.207
Cd
Circular
0.950
1.156
1022
0.821
Pb
Gaussian
0.175
0.737
1930
0.237
Ni
Gaussian
0.276
0.597
2321
0.462
concentration of Pb was high. A higher concentration
transformation was performed for Cd and Ni because
of lead has also been found in soil impacted with
their skewness was greater than one.
petroleum exploration and production activities
(Asia et al., 2007; Owamah, 2013). The greatest and
Semivariogram analysis of heavy metals
the smallest standard deviation were observed in the
Semivariogram analysis was used to characterize
Ni (44.1) and pH (0.47), respectively. Organic carbon,
and quantify spatial variability and RMSE was used
Cd and Ni exhibit a high variation (>50%) according
for different theoretical semivariogram models to
toguidelinesprovidedbyWarrick(1998).Skewnessis
fit the experimental semivariogram values for each
the most common form of departure from normality.
micronutrient. Analysis of the isotropic variogram
If a variable has positive skewness, the confidence
indicated that the Cr and Cd semivariograms were
limits on the variogram are wider than they would
well described with the circular model, with the
otherwise be and consequently, the variances are less
distance of spatial dependence being 1240 and 1022
reliable. A logarithmic transformation is considered
m, respectively, while the Pb and Ni semivariogram
where the coefficient of skewness is greater than one
was well described with the Gaussain model, with
(Webster and Oliver, 2001). Therefore, a logarithmic
the distance of spatial dependence being 1930 and
2321 m, respectively (Table 2).
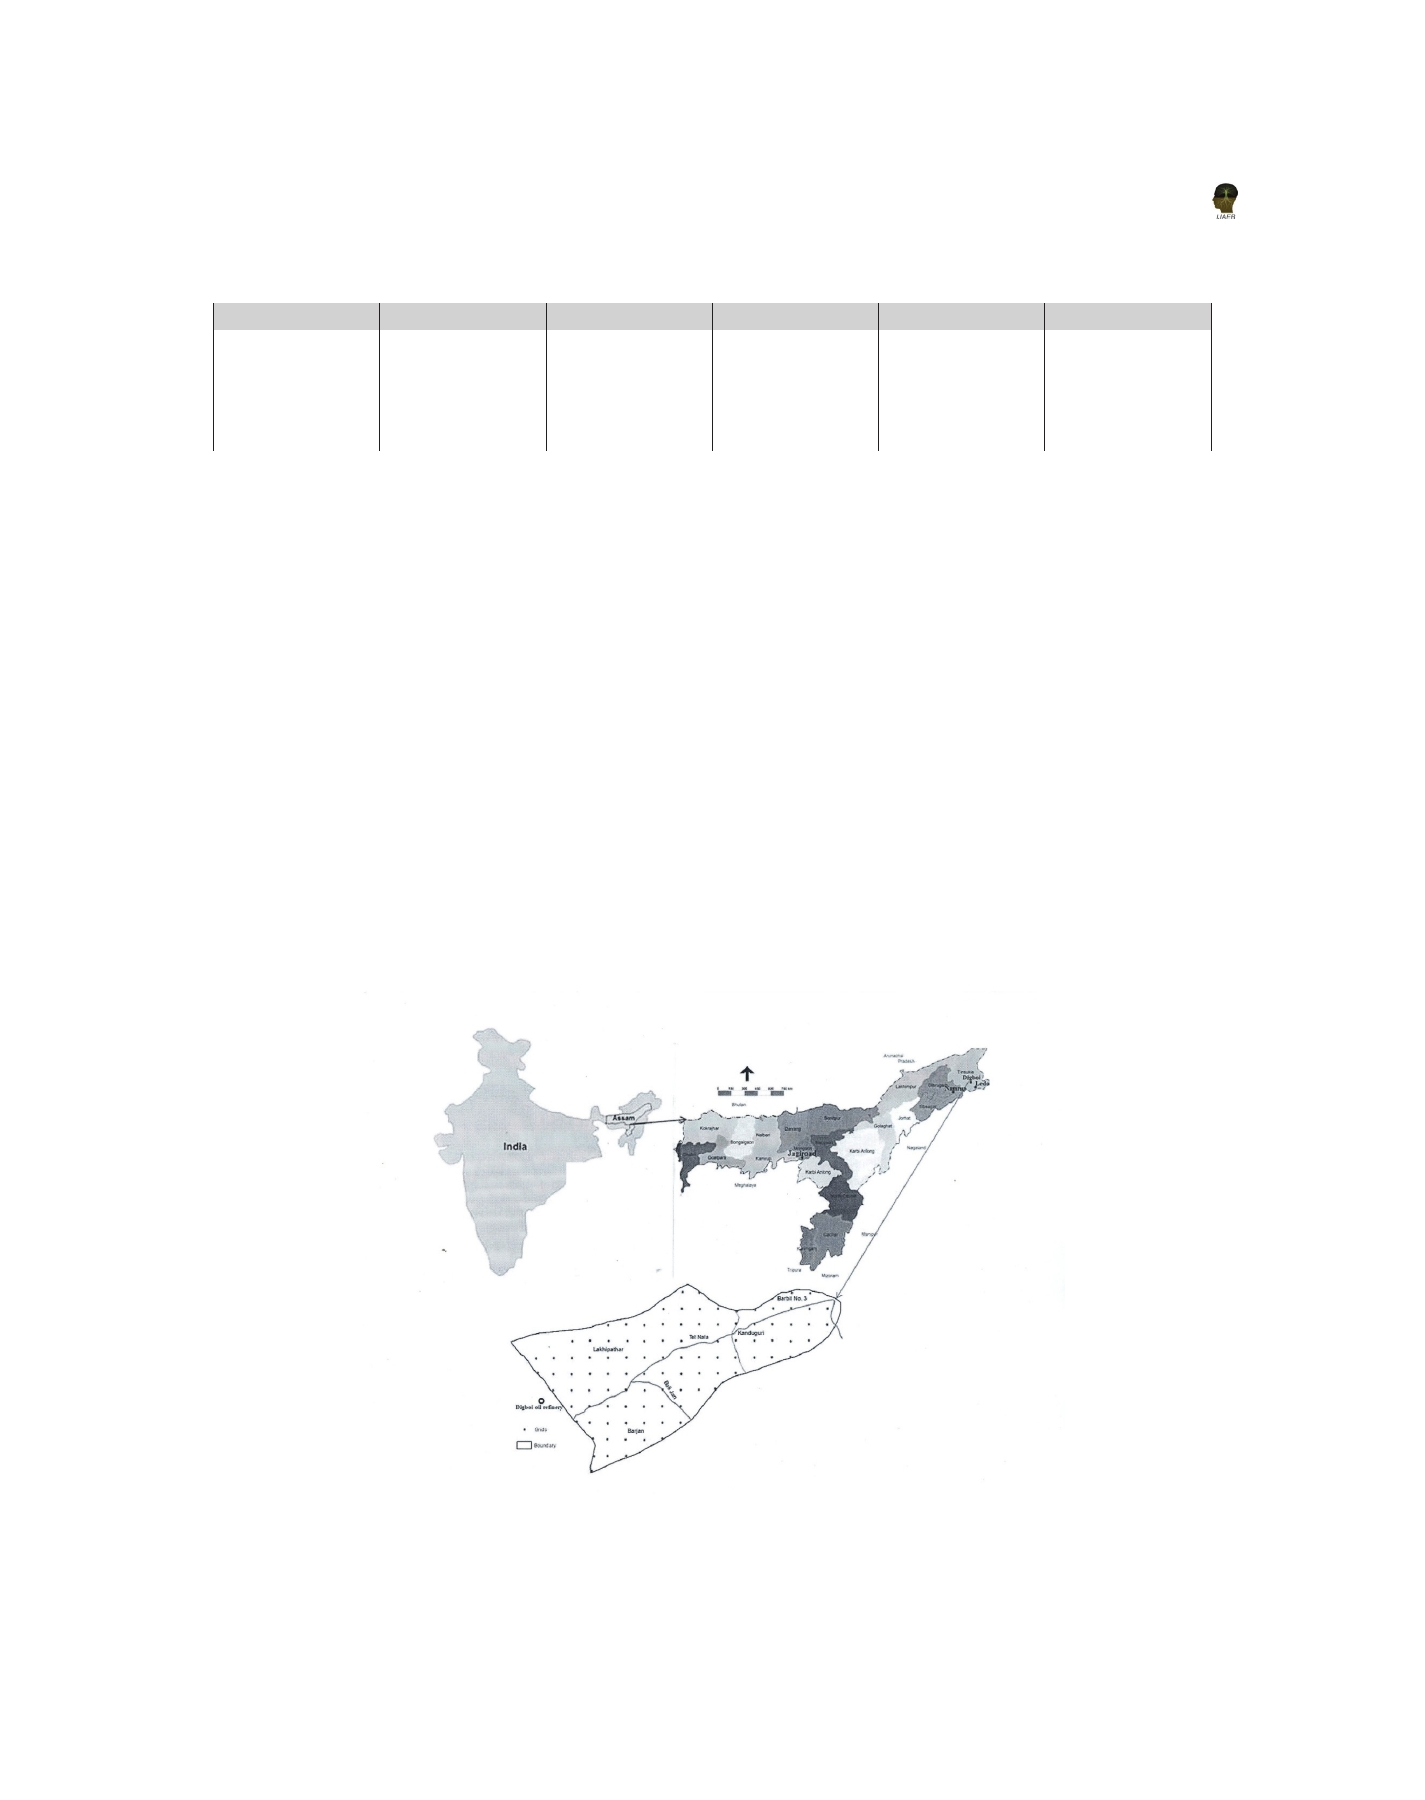
Figure 1. Location and grid map of the study area
791