Reza et al.
In the semivariogarm analysis, the nugget values
represent the variability of measured heavy metals
level at zero distance, which are positive in this
study for all the heavy metals. This spatial random
variance is caused by the artificial nature of heavy
metal pollution in soil; meaning that anthropogenic
inputs are a significant source of heavy metals in the
study area. The sill, sum of partial sill and nugget,
is the maximum variance between data pairs and
reflects the variations of regionalized variables in the
study area. The ratio of nugget and sill is commonly
used to express the spatial autocorrelation of regional
variables, which also indicates the predominant
factors among all natural and anthropogenic factors
(Robertson et al., 1997). The ratios of nugget and sill
between 0.25 and 0.75 represented moderate spatial
dependence; those below 0.25 represented strong
spatial dependence; and all others represented weak
dependence. Cr and Pb were strongly spatially
dependent suggesting that they are affected by
anthropogenic factors only while Ni was moderately
spatially dependent suggesting that they are affected
by either anthropogenic or natural factors or both.
Table 3. Evaluation performance of ordinary kriged map of
heavy metals through cross-validation
Mean
Heavy
Mean square
Goodness of
absolute error
metals
error (MSE)
prediction (G)
(MAE)
Cr
0.004
160.7
15.7
Cd
0.048
3.8
28.0
Pb
0.107
333.2
36.1
Ni
9.33
661.7
2.3
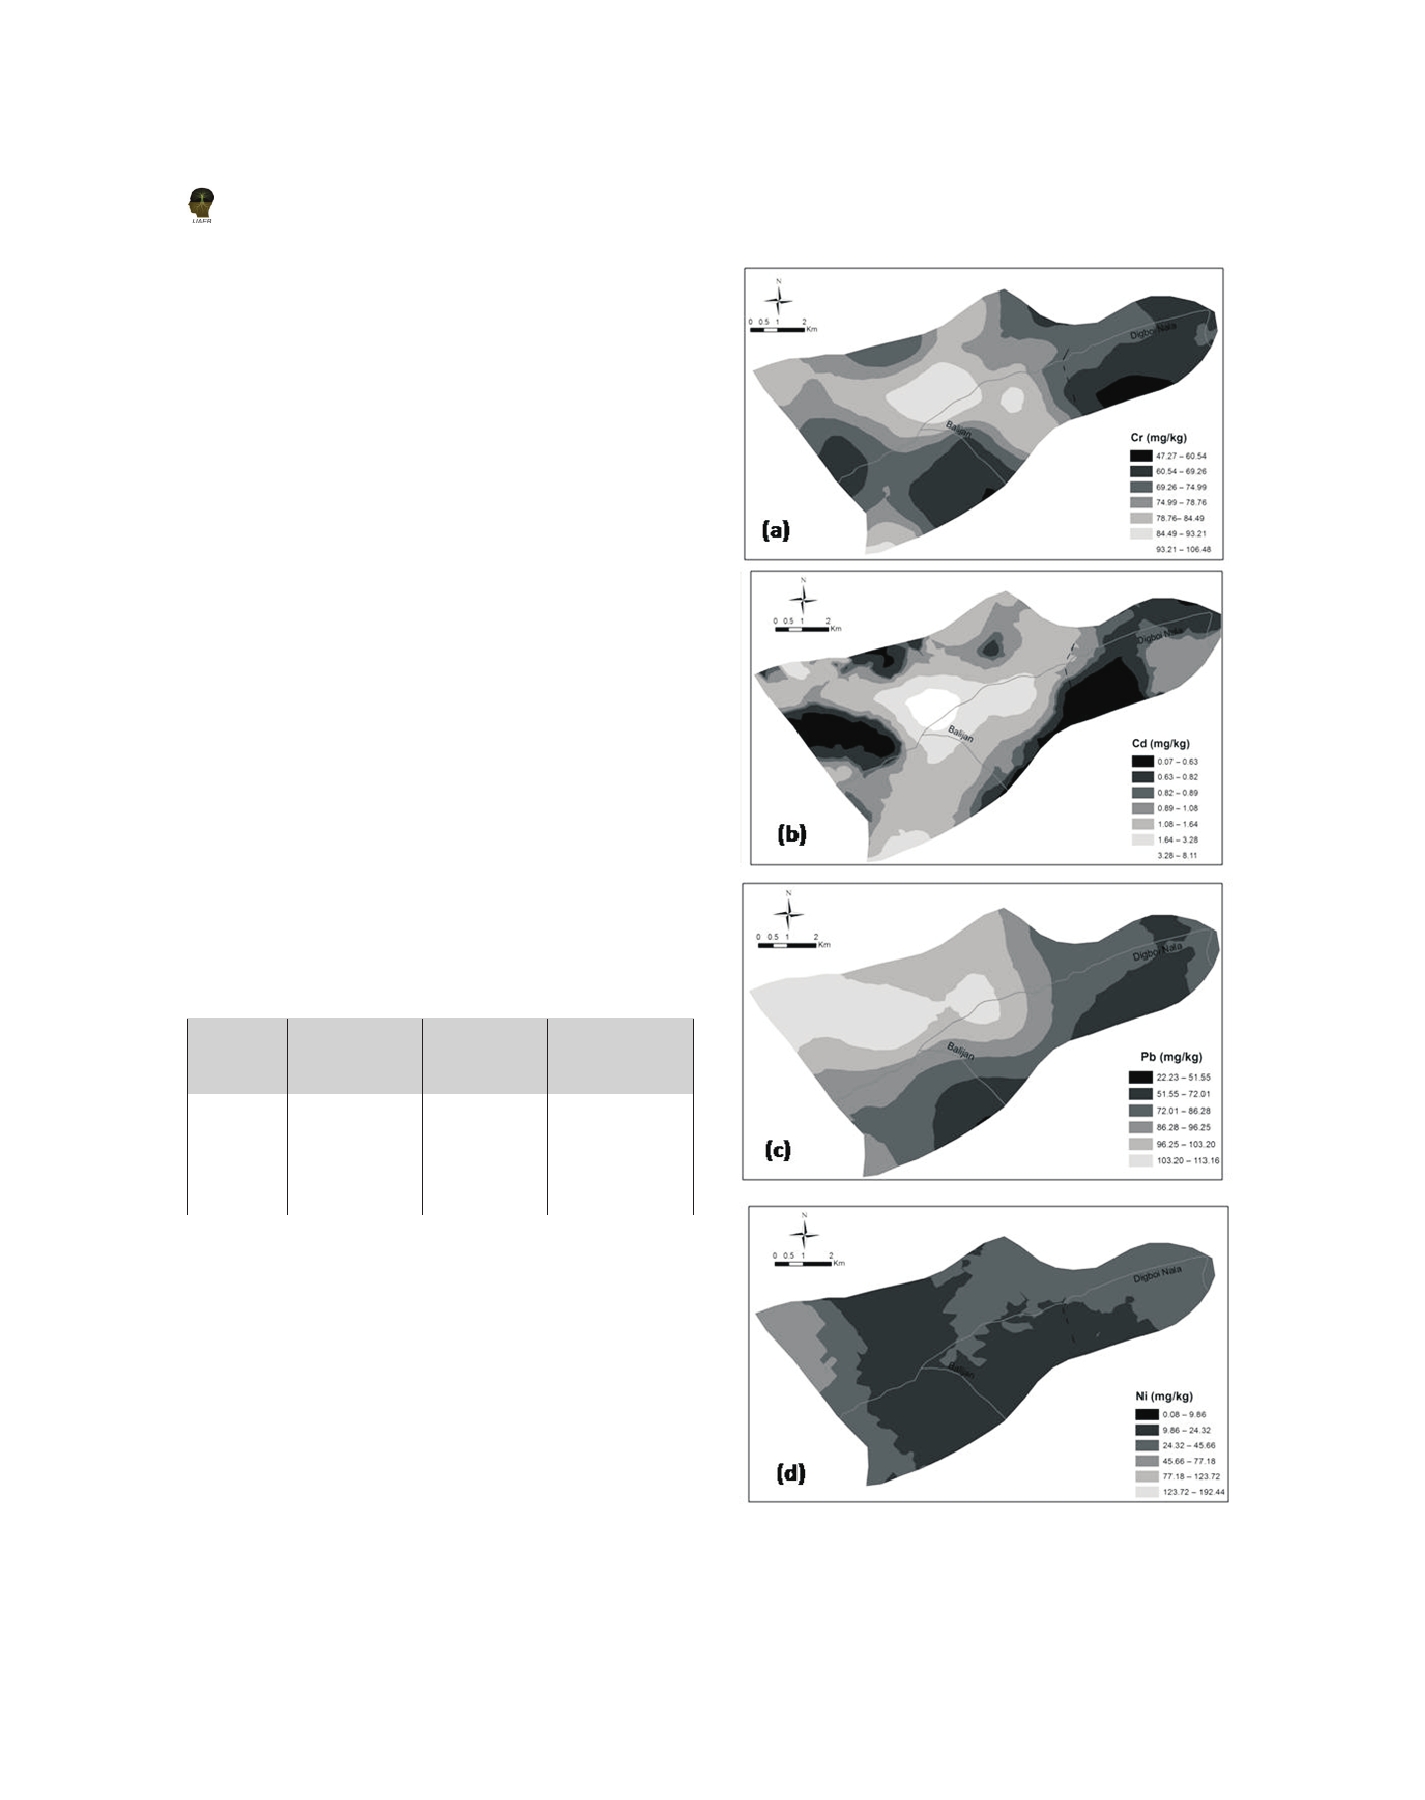
Spatial distribution and risk assessment of heavy
metals pollution
Using the available measurements for Cr, Cd, Pb
and Ni concentration as well as the aforementioned
structural models, spatial maps of these pollutants
were produced using the ordinary kriging
procedure (Journel and Huijbregts, 1978). The spatial
distribution maps of Cr, Cd, Pb and Ni (Figure 2a−d,
respectively) showed that high concentration of
heavy metals was located in the low lying paddy
Figure 2 Spatial distribution maps of (a) Chromium; (b)
792