Optimal design of flow rate in drip irrigation system to enhance the tomato cultivation
Table 1 Height of fertigated tomato plants at different flow rates
Flow
Time (Week)
rate (L/
hr)
1
2
3
4
5
6
7
8
9
10
11
12
13
Average height of Fertigated tomato plant (cm)
2
15.3
16.9
17.2
17.4
17.6
17.9
18.1
18.8
21.7
25.3
28.6
33.1
36.3
4
14.2
14.5
14.7
14.9
15.1
15.3
15.5
16.0
18.0
21.6
23.8
27.1
29.2
8
14.6
15.0
15.3
15.5
15.7
15.8
16.0
16.6
18.3
20.4
22.0
24.3
26.6
Table 2 Fertigated crown spread of tomato plant at different flow rate
Flow rate
Time (Week)
(L/hr)
1
2
3
4
5
6
7
8
9
10
11
12
13
Average Crown/Canopy Spread of fertigated plants of tomato (cm)
2
8.3
8.5
8.6
8.6
8.8
9
9.2
9.4
11.9
14.5
17
21
22.4
4
7.7
7.8
8.0
8.2
8.3
8.5
8.6
8.9
11.4
13.9
17.1
18.9
20.1
8
7.9
8.1
8.2
8.4
8.5
8.7
8.8
9.0
11.1
13.3
15.8
17.5
18.5
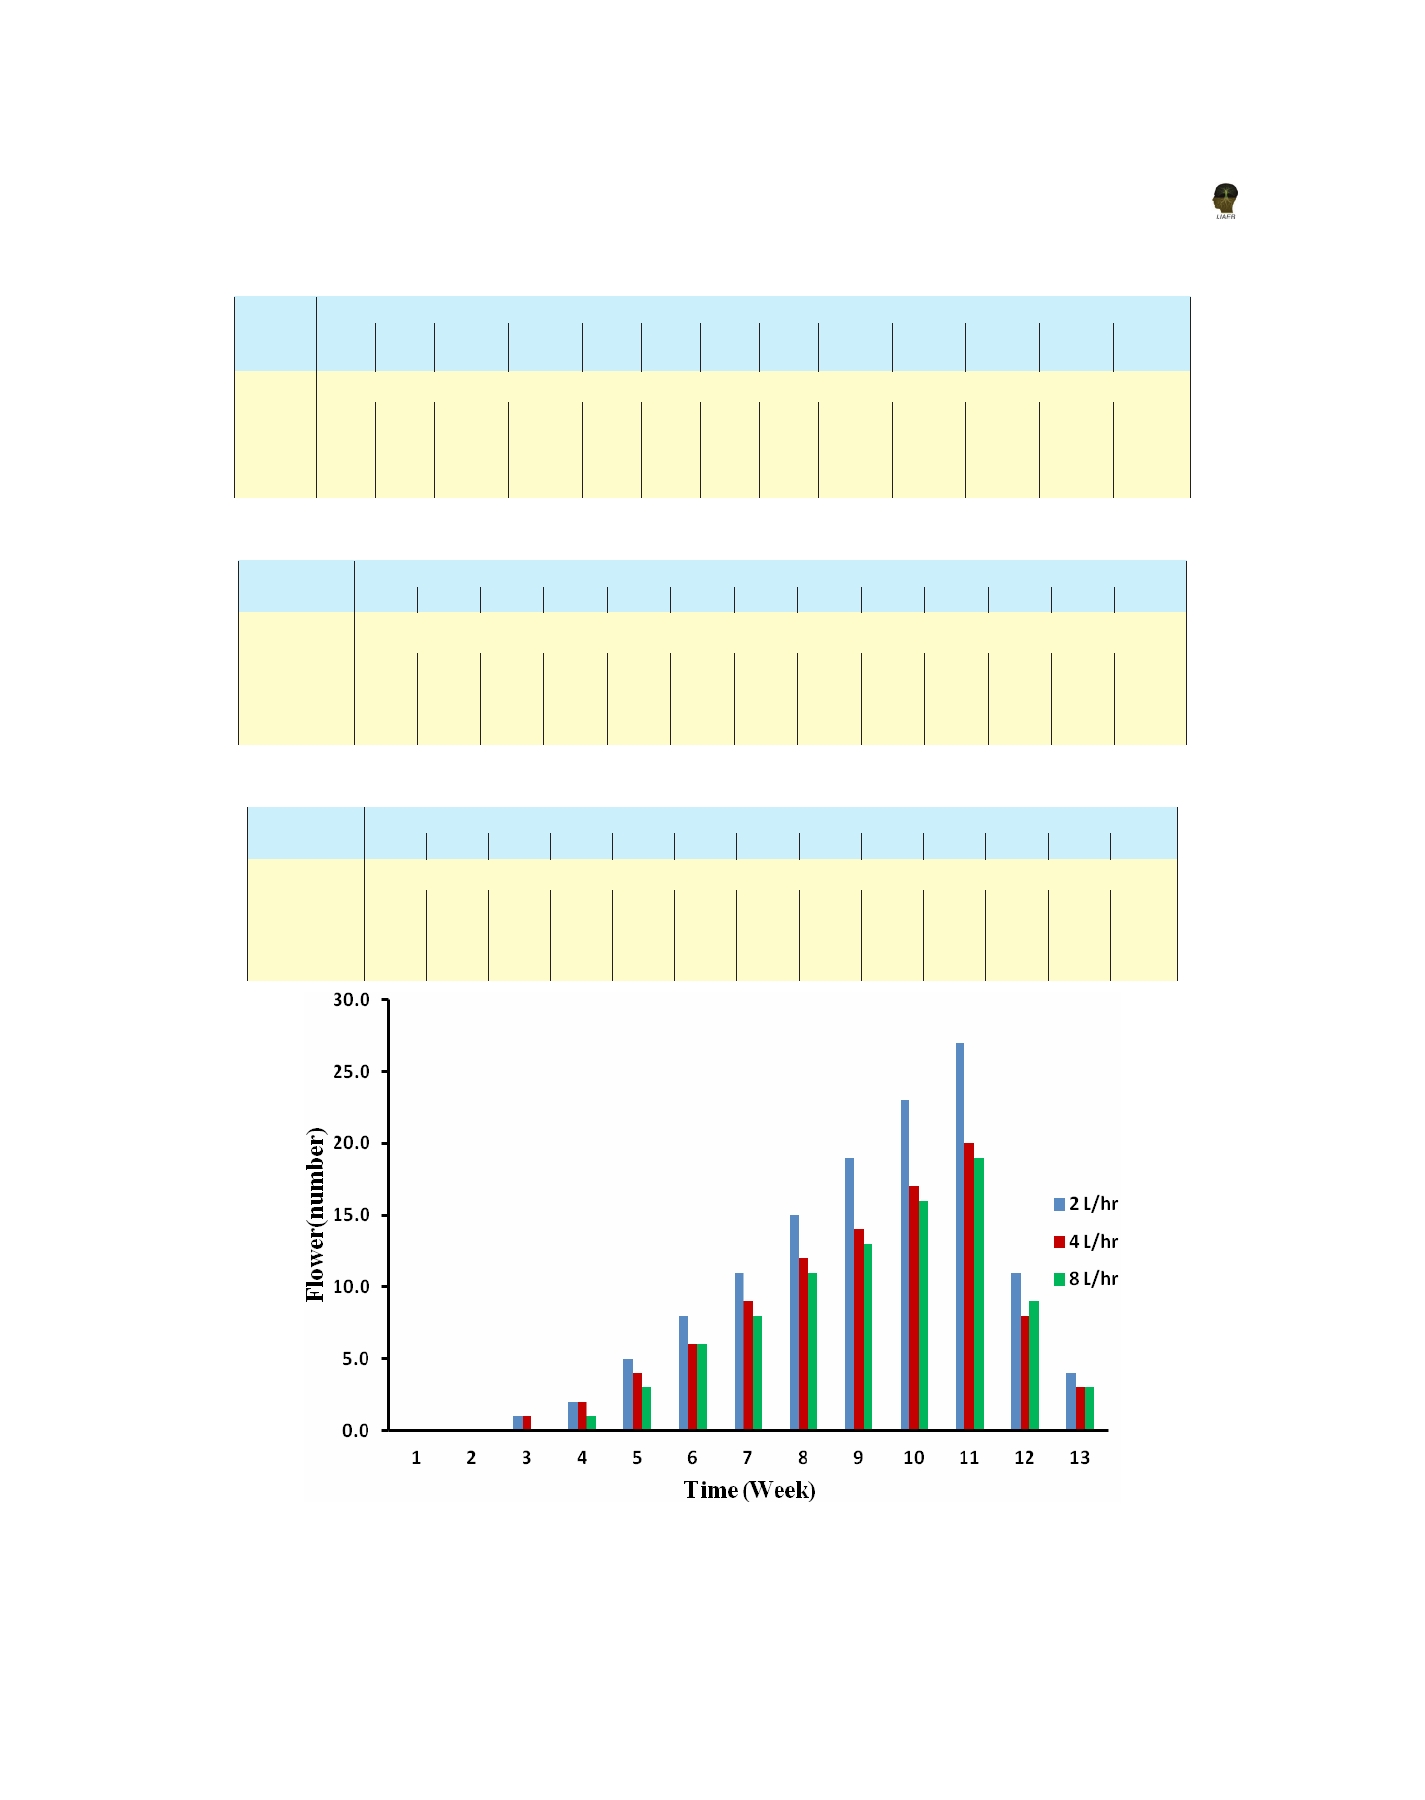
Table 3. Fruiting of fertigated tomato plants at different flow rates
Flow rate
Time (Week)
(L/hr)
1
2
3
4
5
6
7
8
9
10
11
12
13
Flowering of Fertigated tomato plant in Number
2
0.0
0.0
1.0
2.0
5.0
8.0
11.0
15.0
19.0
25.0
29.0
11.0
4.0
4
0.0
0.0
1.0
2.0
4.0
6.0
9.0
12.0
14.0
17.0
20.0
8.0
3.0
8
0.0
0.0
0.0
1.0
3.0
6.0
8.0
11.0
13.0
16.0
19.0
9.0
3.0
Figure 5. Variation of number of fruits of fertigated tomato plants at varying flow rate
17