Kautkar et al.
dependence of bulk electrical conductivity indicates
and temperature (Moraveji, Ghaderi and Davarnejad,
that temperature and interaction of temperature
2011). Values of point electrical conductivity is more
and time had significant effect on bulk electrical
than bulk electrical conductivity indicating that bulk
conductivity at 1% level of significance.
electrical conductivity is more preciously measured
than point electrical conductivity of ginger paste and
Table 1: ANOVA for time dependence of point electrical
interference of temperature gradient was eliminated
conductivity
by taking conductivity of whole mass. The relation
of point and bulk electrical conductivities with
Source
df
ss
ms
Fc
Ft
temperature (T) can be represented by equations
given in Table 3 with their R 2 values.
Time (A)
2
0.12736
0.063680 0.72
2.53
Temperature
3
23.00315 7.667716 85.88*** 4.71***
Table 3. Relation of point and bulk electrical conductivities
(B)
with temperature
A×B
6
0.20730
0.034550 0.39
2.03
Error
24
2.14290
0.089287
Salt
Electrical conductivity
Level
Total
35
25.48071
σb
R 2
σb
R 2
* = P<0.05, ** = P<0.01, *** = P<0.001
0
0.058T + 3.69
0.996
0.041T + 3.744
0.995
1
0.058T + 4.108 0.997
0.058T + 3.563
0.995
Table 2: ANOVA for time dependence of bulk electrical
2
0.057T + 4.752 0.998
0.063T + 3.842
0.997
conductivity
Source
df
ss
ms
Fc
Ft
Time (A)
2
0.0048
0.0024 0.57
2.53
Temperature
3
18.5951 6.1983 1432*** 4.71***
(B)
A×B
6
0.1964
0.0327 7.57*** 3.66***
Error
24
0.1038
0.0043
Total
35
18.9003
* = P<0.05, ** = P<0.01, *** = P<0.001
It can be observed from table 1 and 2 that time had
non-significant effect on point and bulk electrical
conductivity of ginger paste which indicates that,
either ginger paste did not undergo any biochemical
changes during the treatment or biochemical changes
in ginger paste were so negligible that it did not affect
electrical conductivity of paste.
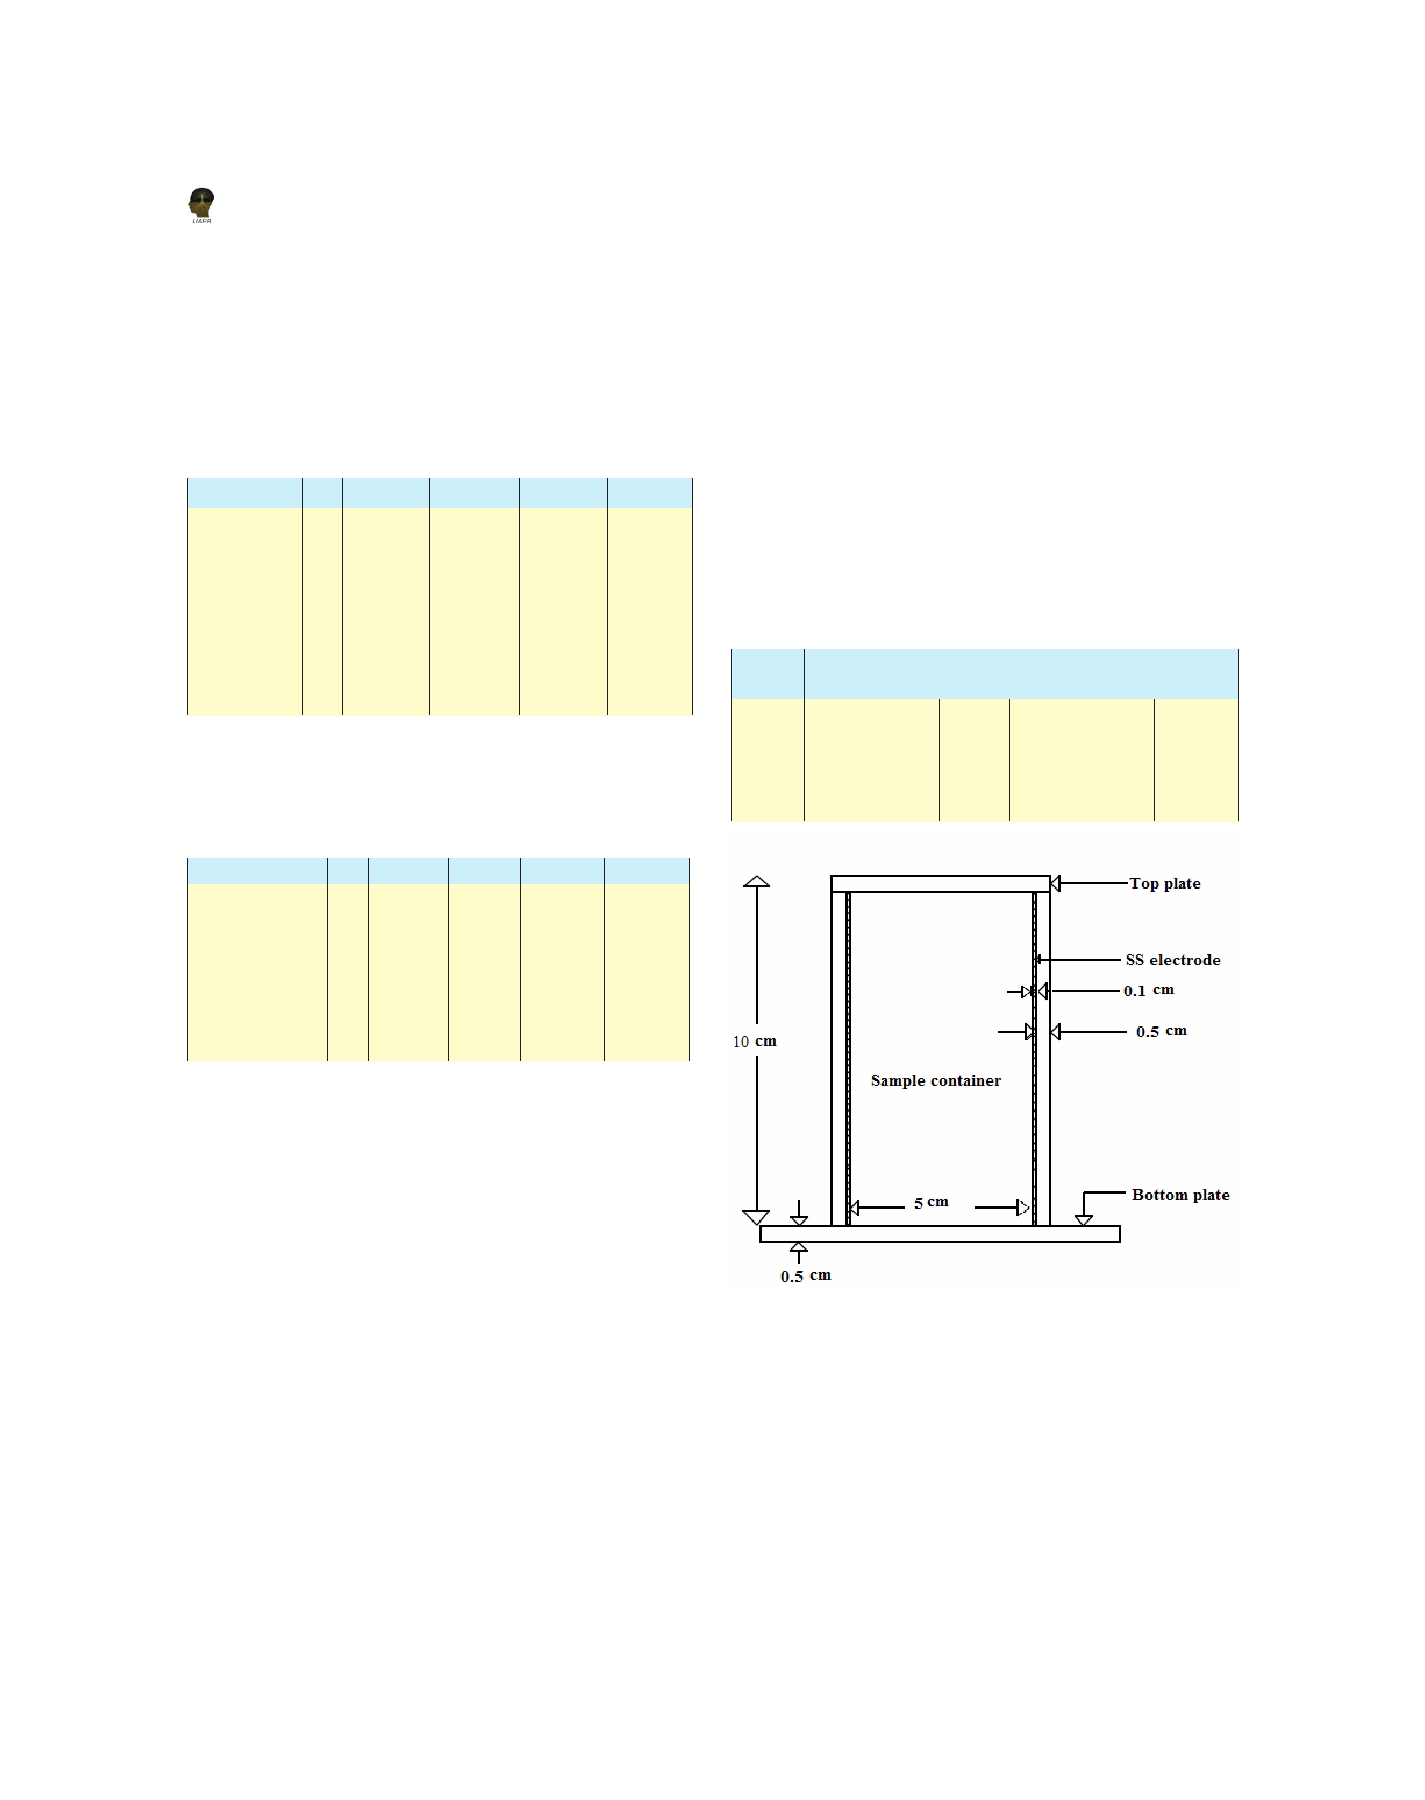
Figure 1. Schematic diagram of ohmic heating device
Figure 2 and Figure 3 shows the behavior of point
and bulk electrical conductivity with temperature
Heating behavior during ohmic heating
at different salt level. It can be seen from Fig that
increasesinpointandbulkelectricalconductivitywith
Typical heating behavior of ginger paste during
temperature followed a linear trend. Also at different
ohmic heating was examined in terms of variation of
salt level, variation in point electrical conductivity
temperature with time. Heating rate of the process
trend also different because salt addition to the
is given by the total time required for the product
system had a major effect on electrical conductivity
to heat up to the certain temperature. Higher
24