Physical and biochemical changes in guava ( Psidium Guajava L. ) during various stages of fruit growth and development
(Figure 2). The major increase in fruit growth could
3). Increase in TSS during ripening might be due to
be attributed to the increase in cell size whereas; slow
depolymerisation of polysaccharides and conversion
growth in between 60 to 90 days after fruit set was
of fruit starch to sugars. Data showed the significant
perhaps due to faster development of seed during
variation among genotypes for total soluble solids
this period that attributed to slow growth of the
(TSS) content. The results at 105 days of fruit set
pulp. Results of the present investigations are in close
revealed that the highest TSS content was present in
conformity with the findings of Dhillon et al. , (1987)
RCG-1 (9.83%) followed by RCG-3 (9.55%) showing
and Mercado-Silva et al. , (1998) they reported double
at par each other while, lowest content was exhibited
sigmoid growth curve in guava fruit. The analysis
by RCGH-4 (8.75%). However at 120 DAFS,
at 120 days revealed the significant superiority of
significantly highest TSS content was observed in
RCGH-4 (6.38 cm) for the traits over others. The
RCG-11 (11.08%) and RCGH-1 (10.76%) showing at
second best genotype that followed RCGH-4 in fruit
par each other and significantly superiors over other
diameter was RCGH-1 (6.11 cm). RCG-1 (5.15 cm)
genotypes followed by RCG-1 (10.29%), RCGH-7
revealed the lowest fruit diameter followed by at
(10.25%), Lucknow-49 (10.0%), Allahabad Safeda
par values of RCG-2 (5.19 cm). Analysis at 127 days
(9.95%) and RCGH-4 (9.92%) exhibiting at par values
also revealed the significant superiority of RCGH-4
within themselves. Significantly lowest content was
(7.01 cm) for the traits over others. RCG-1 (5.29 cm)
present in Sangam (9.22%) followed by Lalit (9.43%)
revealed the lowest fruit diameter followed by RCG-
and RCG-2 (9.62%) showing at par values. On 127
2 (5.34 cm) both were at par with each other.
days of fruit set, RCG-11 revealed the highest TSS
content (12.19%) and found significantly superior
Total Soluble Solids
over rest of the genotypes. The next best performers
A gradual increase in total soluble solids (TSS)
were RCGH-1 (10.91%) and RCGH-7 (10.55%)
was observed in all the genotypes throughout
exhibiting at par each other while, RCG-1 (10.34) and
development and ripening stage of the fruits (Figure
Lucknow-49 (10.30%) showing at par with RCGH-
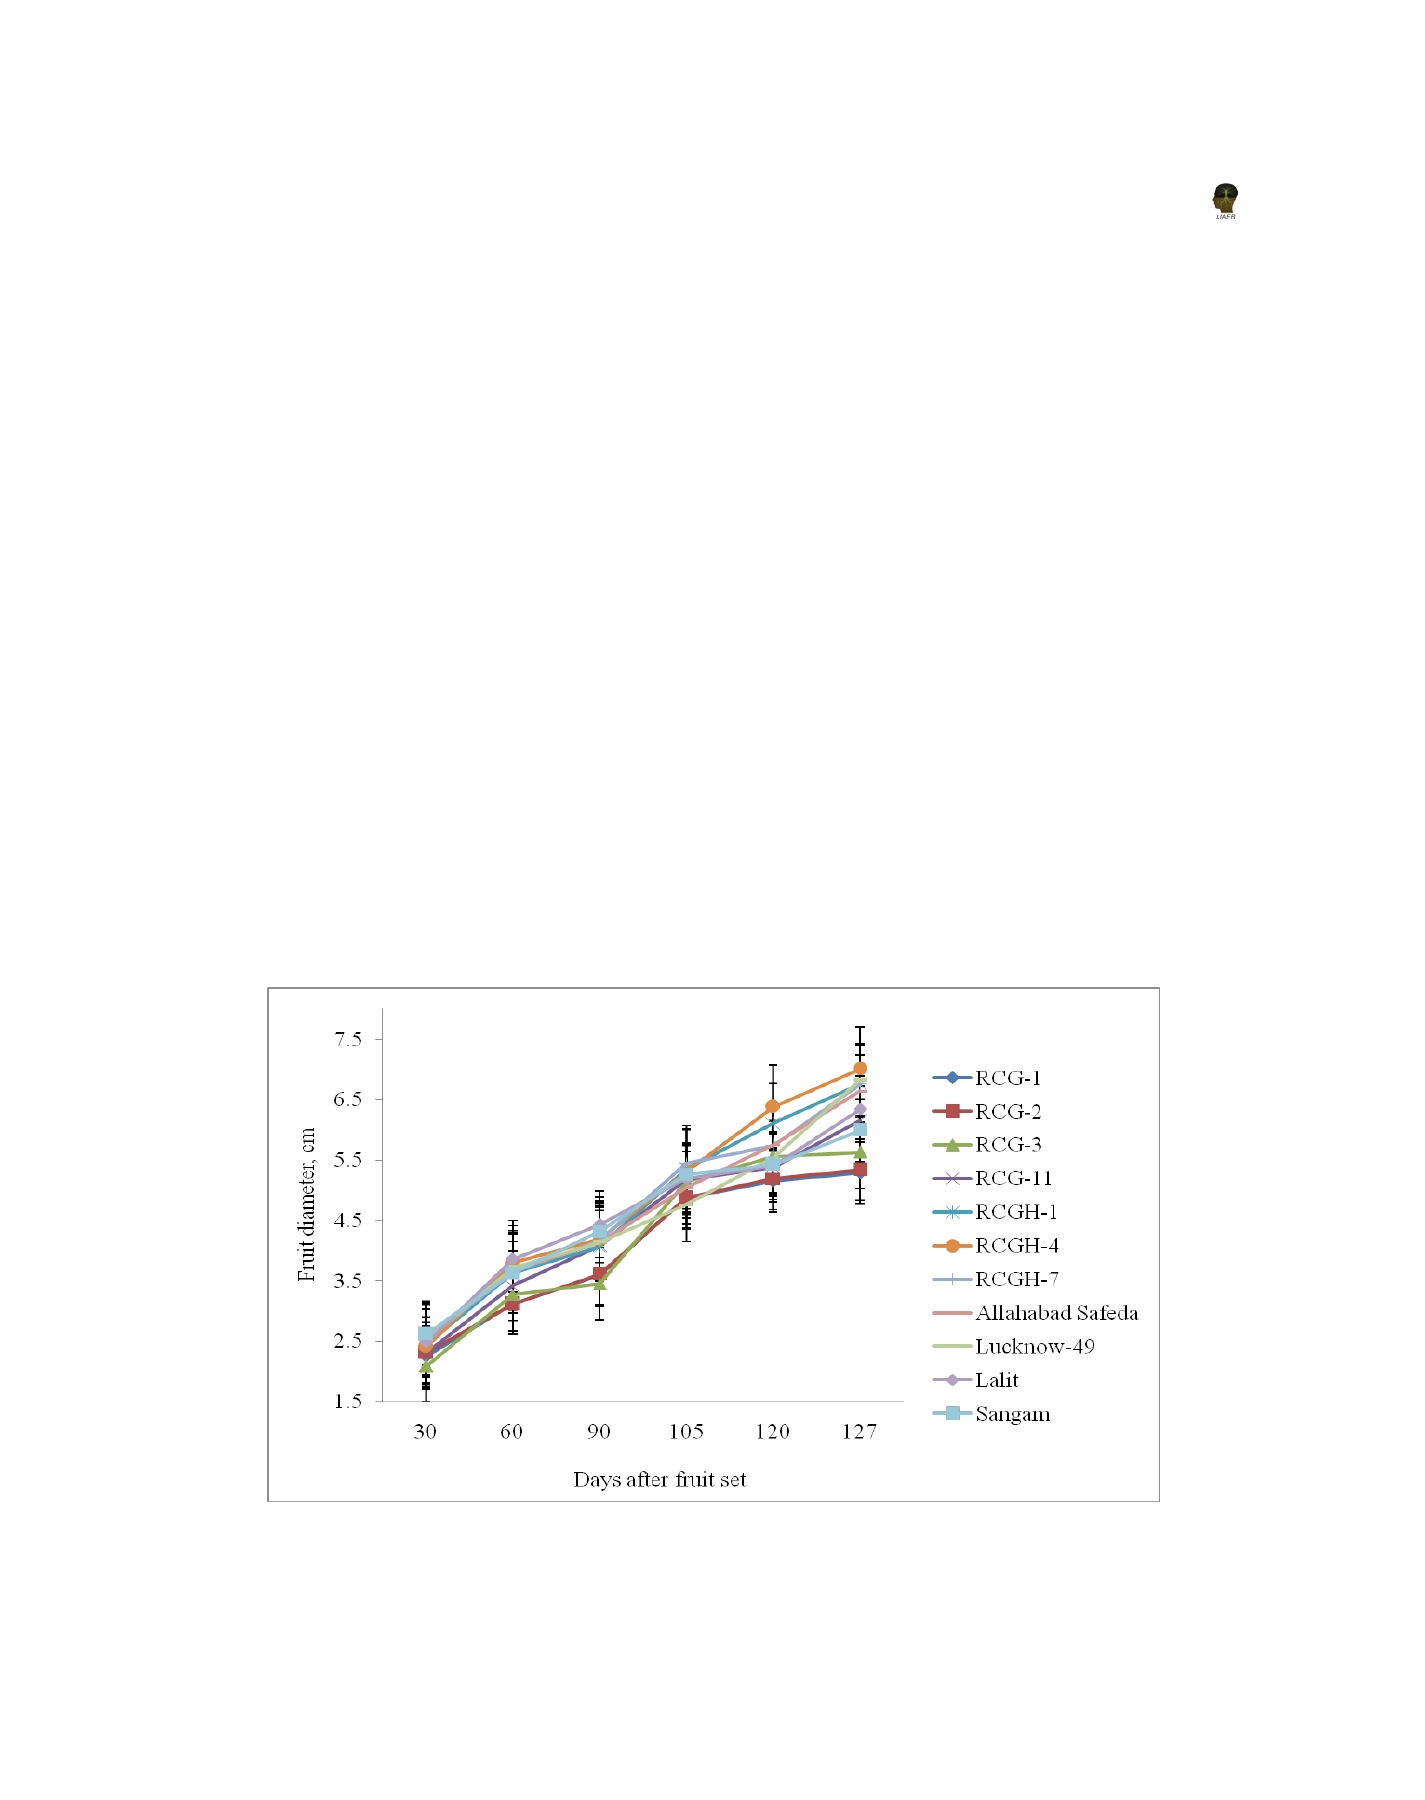
Figure 2. Fruit growth pattern (diameter) of guava genotypes
79