Patel et.al.
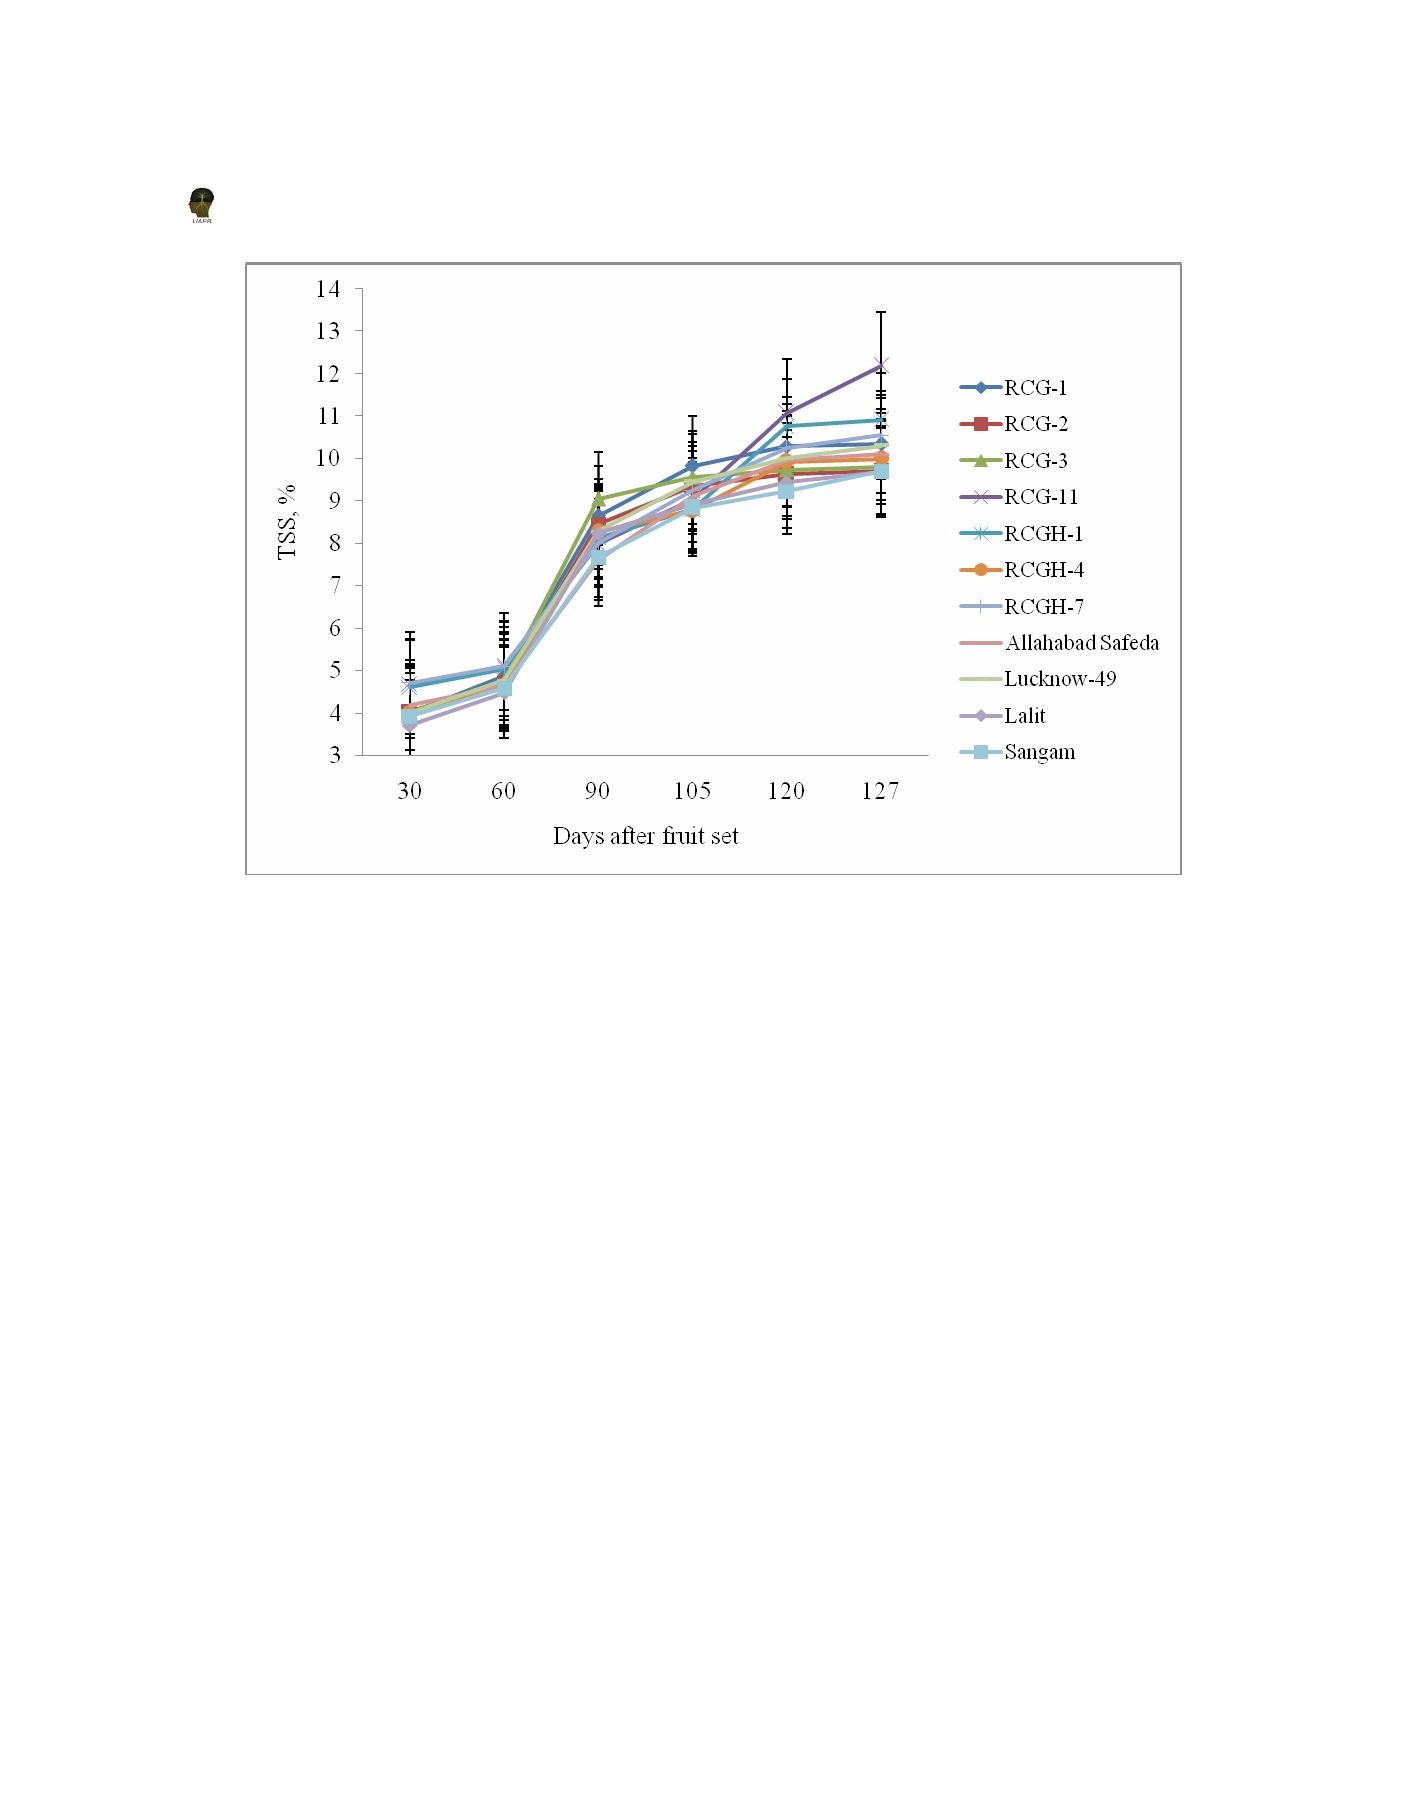
Figure 3. Changes in TSS content of guava genotypes
7. Significantly, lowest TSS content was recorded in
1985). The decrease in titratable acidity at the later
Lalit (9.68%), which was closely followed by RCG-2
stages of fruit maturity and ripening was considered
(9.69%), Sangam (9.70%) and RCG-3 (9.79%) showing
to be due to conversion of organic acids into sugars.
at par values. The highest value of TSS on 105
Similar result was also observed by Mercado-Silva
DAFS in RCG-1 and RCG-3 might be due to genetic
et al. , (1998), Hegde and Chharia (2004) in guava,
characteristics of these genotypes to mature early
Deka et al. , (2006) in Khasi mandarin and Dhillon et
after fruit set. Results are in accordance to findings
al. , (2007) in pear.
obtained by Dhillon et al. , (1987); Bashir et al. , (2003);
Data presented in Figure 4 revealed significant
Hegde and Chharia (2004) and Singh and Jain (2007).
variations among genotypes for acidity content.
Titratable acidity
The highest acidity was present in Sangam (1.71%),
which was closely followed by RCGH-7 (1.59%) and
The amount of total titratable acidity increased
both were at par each other while, lowest content
steadily in the beginning upto 105 days after fruit
was registered in RCG-2 (0.61%) followed by RCG-1
set in most of the genotypes except RCG-1, RCG-2
(0.62%) and RCG-3 (0.66%) showing at par values on
and RCG-3 which showed upto 90 days only and
105 DAFS. Significantly highest acidity on 120 days
afterwards there was a continuous reduction till
of fruit set was noticed in Sangam (0.69%) followed
ripening (Figure 4). The increase in acidity might
by Lalit (0.66%) and Allahabad Safeda (0.63%) which
be attributed to increased bio-synthesis of organic
were at par themselves while, lowest acidity was
acids during initial period of fruit growth (Naik
recorded in RCG-1 and RCG-11 (0.48%
80