Physical and biochemical changes in guava ( Psidium Guajava L. ) during various stages of fruit growth and development
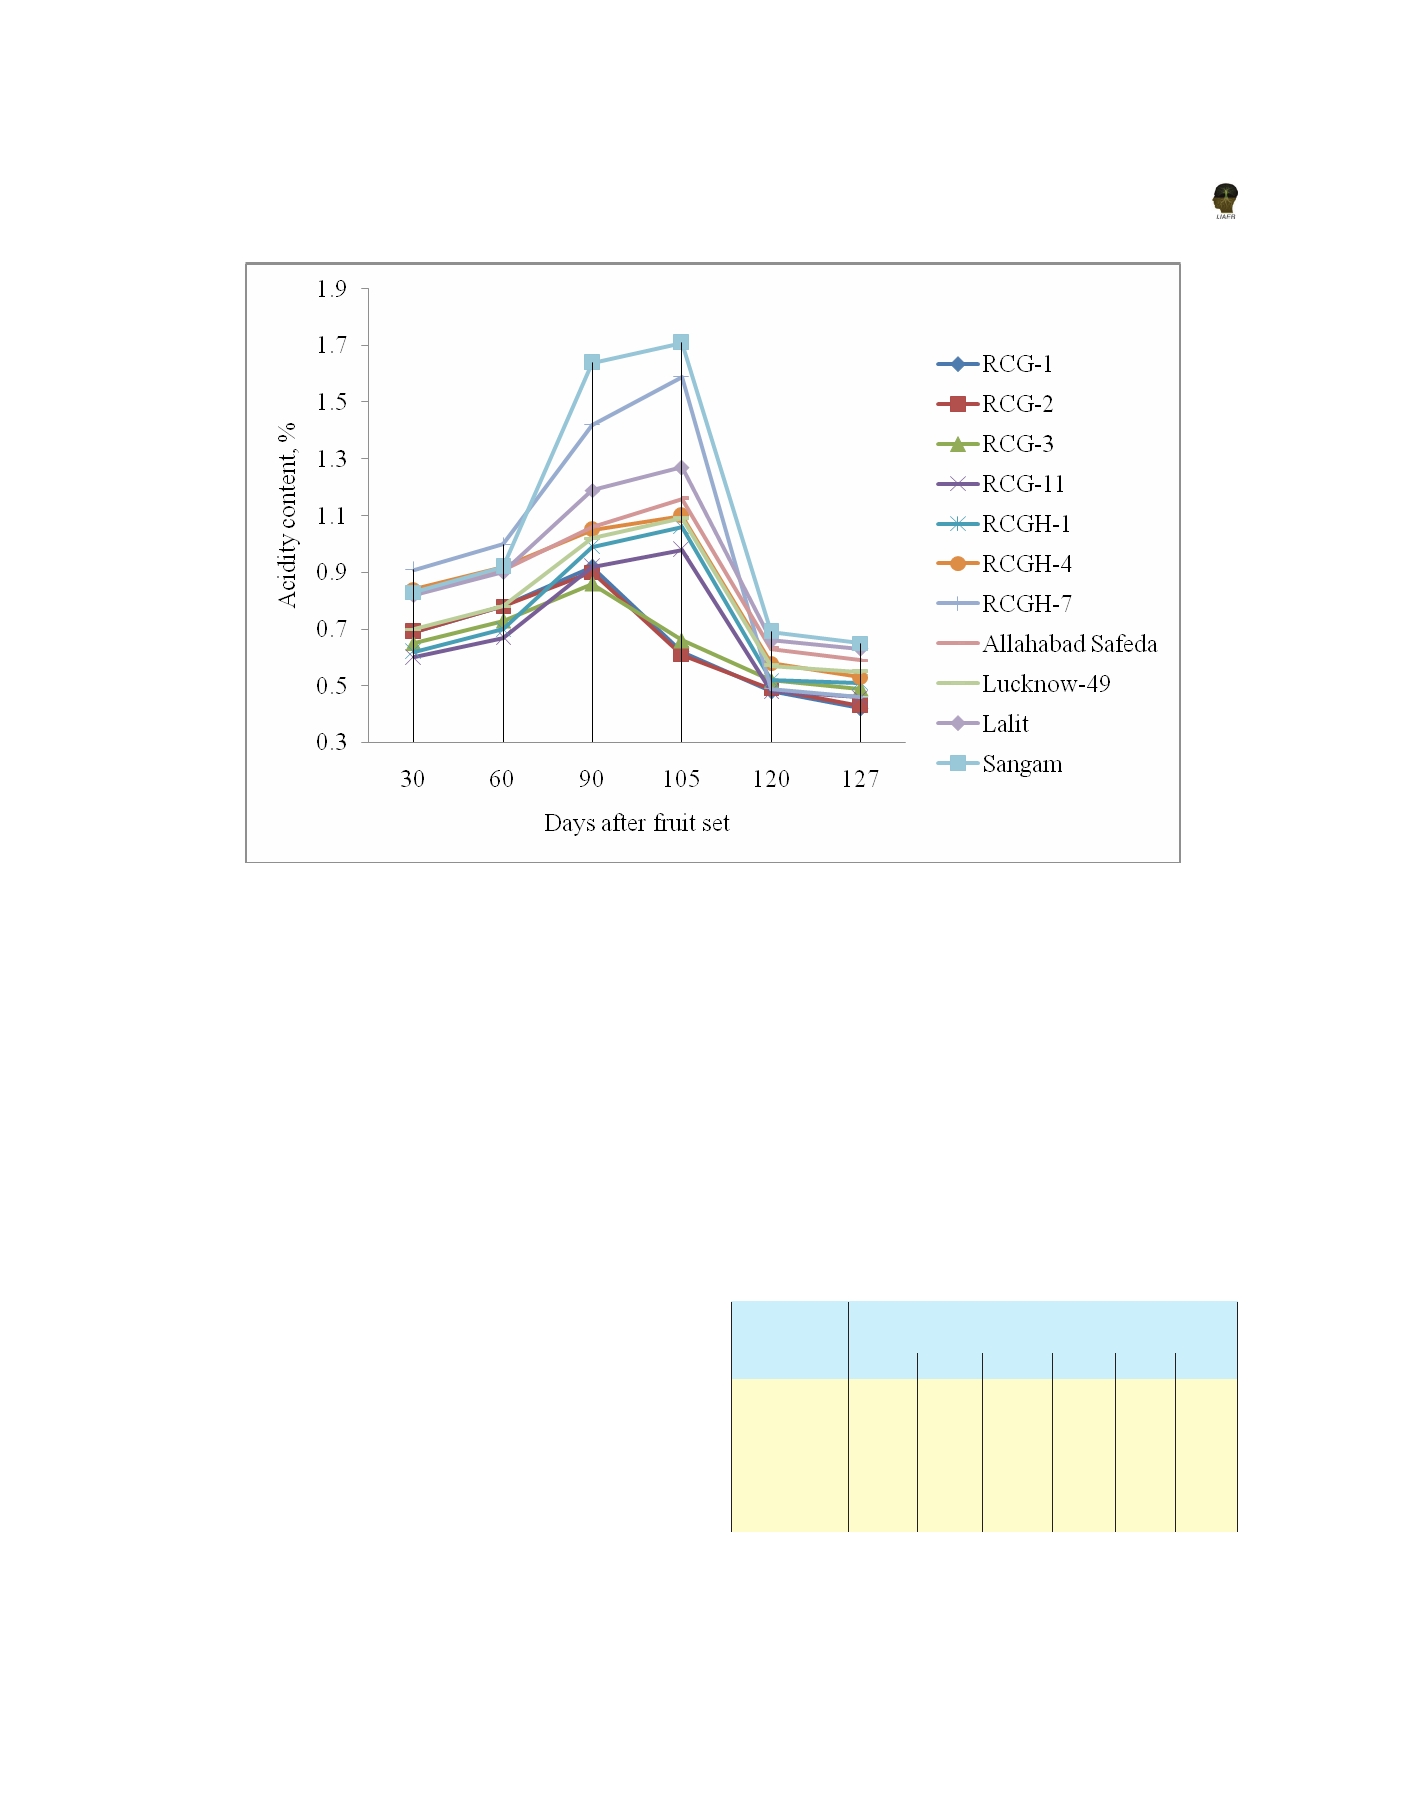
Figure 4. Changes in acidity content of guava genotypes
each) followed by at par values in RCG-2 and RCGH-
(22.11 and 25.20) and lowest in Sangam (13.53 and
7 (0.49% each), RCG-3 and RCGH-1 (0.52% each) and
14.92) followed by Lalit (14.54 and 15.64) at 120 and
Lucknow-49 (0.57%). On 127 days of fruit set also,
127 DAFS, respectively (Table 2). Increase in TSS:
Sangam revealed the highest acidity (0.65%) which
acid ratio till maturity and ripening might be due to
was at par with Lalit (0.63%) and Allahabad Safeda
increasing in TSS and decreasing in acidity. The TSS:
(0.59%) whereas, significantly lowest acidity content
acid ratio was increased markedly towards the last
was present in RCG-1 (0.42%) followed by RCG-
growth stage of guava as reported by Kundu et al. ,
2 (0.43%), RCG-11 and RCGH-7 (0.46% each) and
(1998).
RCG-3 (0.49%) showing at par values.
Table 2 Performance of guava genotypes for TSS: acid ratio
TSS: acid ratio
at different days after fruit set
The fruits showed continuous and progressive
TSS: acid ratio
increase in TSS: acid ratio from 30 DAFS till maturity
Geno-types
Days after fruit set (DAFS)
and ripening in all the genotypes except RCG-11,
30
60
90
105
120
127
RCGH-1 and RCGH-7 that showed from 60 DAFS.
RCG-1
5.83
6.47
9.48
16.25 22.11 25.20
The highest TSS: acid ratio was observed in RCG-1
RCG-2
5.98
6.11
9.50
15.68 19.93 22.90
(16.25) followed by RCG-2 (15.68) and RCG-3 (14.65)
RCG-3
6.37
6.84
10.50
14.65 19.40 20.11
while, lowest ratio was noticed in Sangam (5.15) on
RCG-11
7.88
7.86
8.76
9.33
23.53 27.12
105 DAFS. The highest TSS: acid ratio was recorded
RCGH-1
7.65
7.46
8.29
8.39
21.01 21.77
in RCG-11 (23.53 and 27.12) followed by RCG-1
81