Singh et.al.
commonly used in developing countries to detect the
Statistical analysis
fruit maturity (Jha et al. , 2009). Fruit colour is a key
The data were analyzed with SAS software version
attributesȱbecauseȱitȱisȱtheȱfirstȱpropertyȱobservedȱbyȱ
9.3 (SAS Institute Inc., Cary, NC, USA) using one-way
growers and consumers to judge maturity stage and
analysisȱofȱvariance.ȱTheȱdifferencesȱbetweenȱmeansȱ
quality.ȱTheȱvaluesȱofȱcolourȱdifference,ȱchromaticityȱ
wereȱ testedȱ usingȱ theȱ LSDȱ testȱ atȱ 0.05ȱ significanceȱ
differenceȱ(C*)ȱandȱhueȱdifferenceȱshowedȱdifferencesȱ
level. The mean and standard errors of means are
between mature green and yellow fruit as a function
also tabulated. Regression analysis was undertaken
of ripeness stages (Kovacs et al. , 2010. The aim of the
toȱfindȱtheȱrelativeȱcorrelationȱforȱseasonalȱvariationȱ
study was to ascertain relationship between stages
between fruit development and colour.
of fruit development of grapefruit and colorimetric
coordinates L*, a* and b*.
Results and Discussion
Materials and Methods
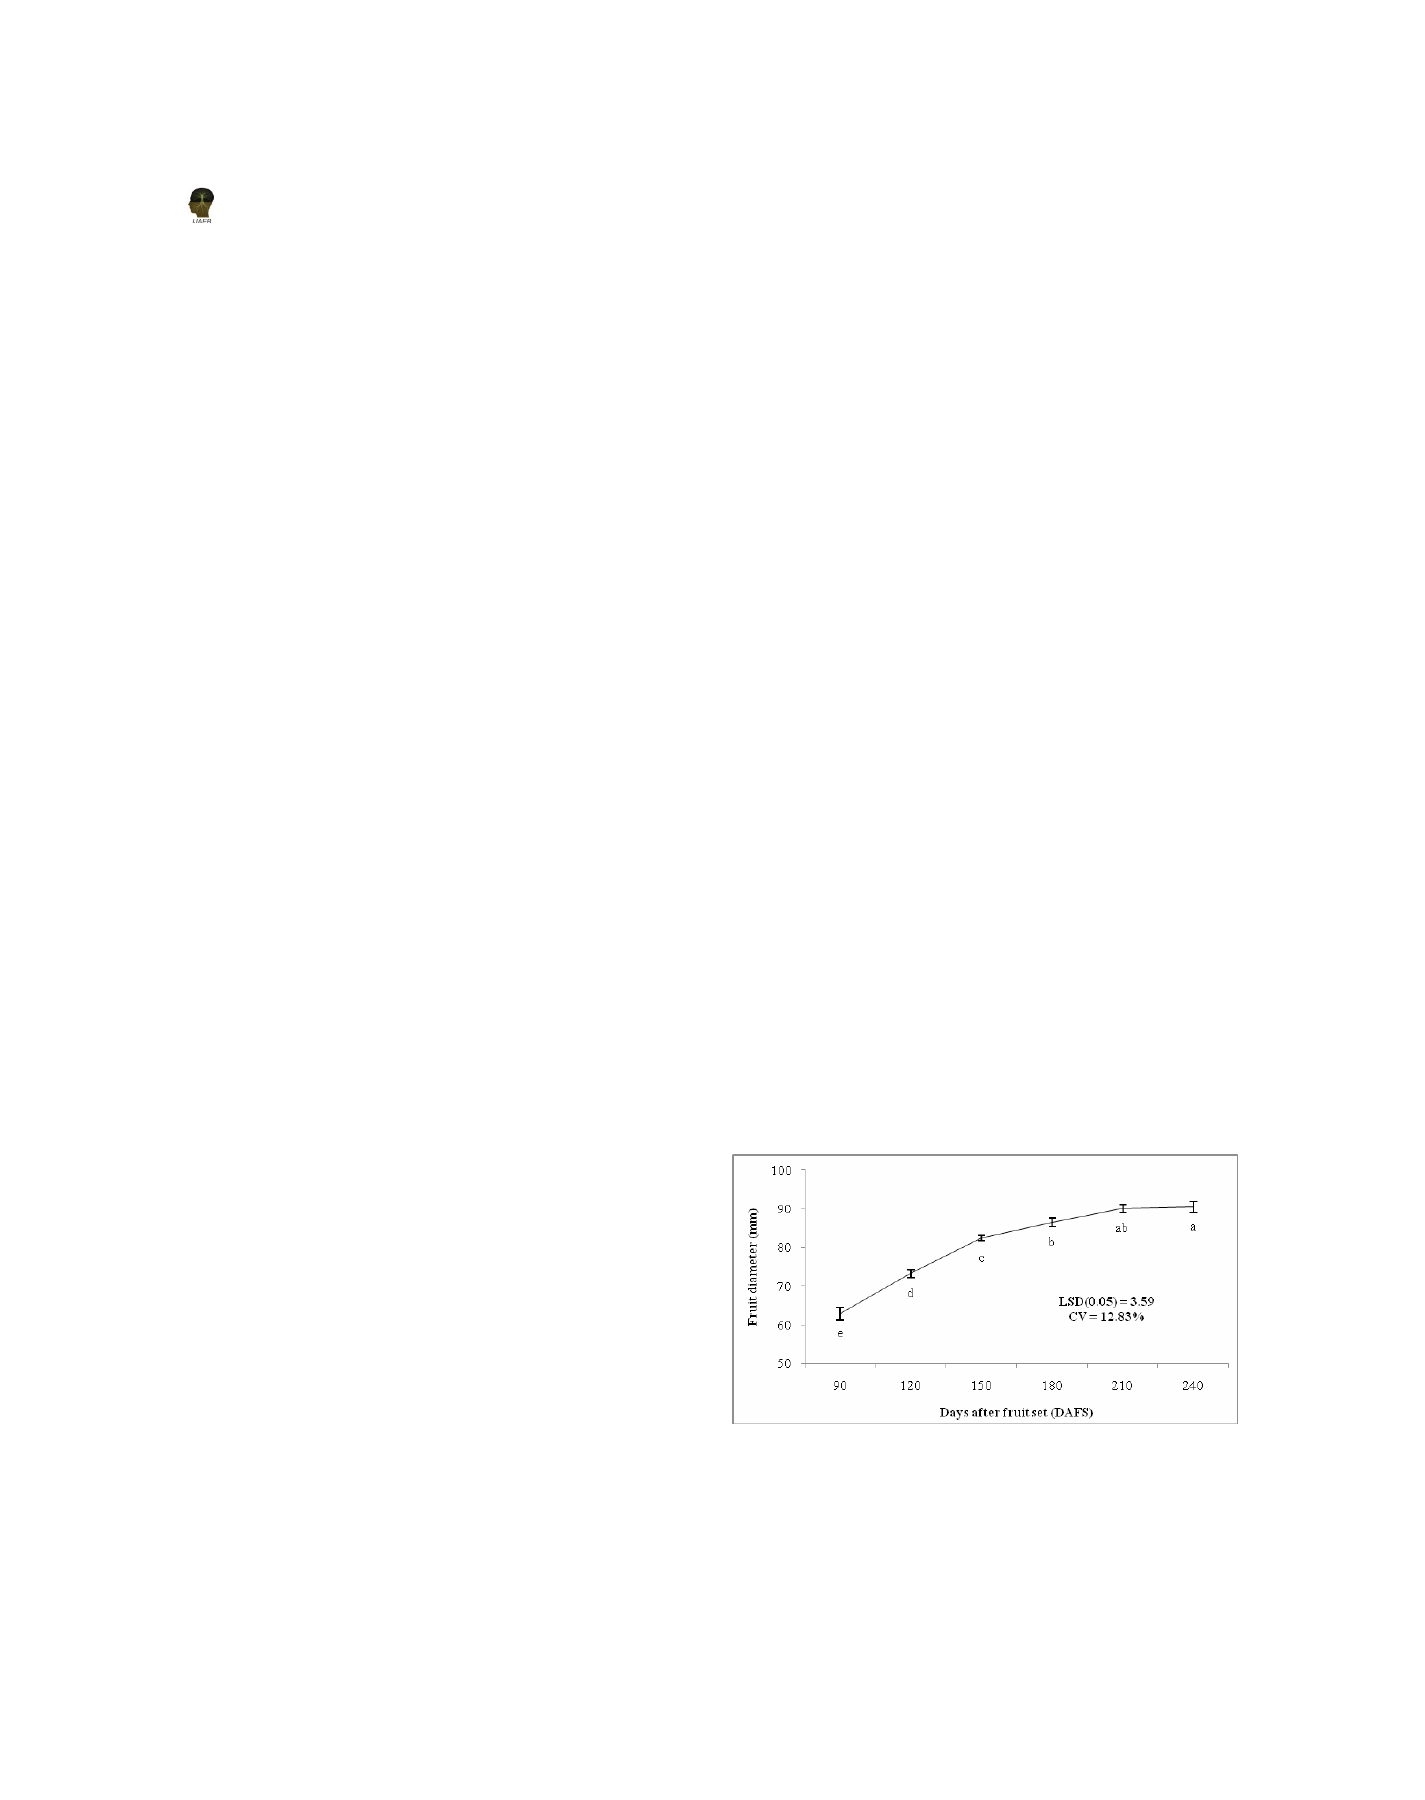
Fruit diameter
In general, the fruit diameter increased with
Experimental site and peel colour measurements
advancement of season and it was minimum
Fresh fruits of grapefruit cv. Star Ruby were collected
(62.85mm) at 90 DAFS and maximum (90.48mm)
from well managed plants growing at Regional
atȱ240ȱDAFSȱ(Figureȱ1).ȱTheȱfirstȱsharpȱfruitȱgrowthȱ
Station of Punjab Agricultural University at Abohar,
phase was recorded from 90-150 DAFS. Second
Punjab (India). Fruits were harvested manually at
growth phase was recorded from 150-180 DAFS and
monthly intervals from July to December and peel
this phase showed less increase in average diameter
colour was determined at 90, 120, 150, 180, 210 and
asȱcomparedȱtoȱfirstȱgrowthȱphase.ȱTheȱthirdȱgrowthȱ
240 days after fruit set (DAFS). At each sampling
phase was noted from 180-210 DAFS and thereafter,
time, the diameter of fruit was measured with digital
non-significantȱincreaseȱinȱdiameterȱwasȱnoted.ȱTheȱ
vernier’s caliper’s (Mitutoyo, Japan). Similarly, the
increase in fruit diameter might be due to an increase
rind colour was measured by using a Hunter Lab
in cell size because of cell division and cell elongation,
(modelȱ ColorFlex,ȱ Reston,ȱ USA),ȱ withȱ reflectanceȱ which enabled the maximum accumulation of food
mode (RSIN), CIE Lab scale (L*, a* and b*). The
materials. The present result was in conformity with
instrument was calibrated with a standard white
theȱ findingsȱ ofȱ Dalalȱ et al. , (2013) in Kinnow and
ceramic tile and black tile and set up for D65 as
Lamare et al. , (2013) in Sohshang. Seasonal variation
illuminate and a 10° observer angle. Sampling was
of 12.83% was recorded in the fruit diameter during
carriedȱoutȱbyȱloadingȱtheȱquartzȱcuvettesȱwithȱfruitȱ fruit development.
peel sample. The colour was determined using a CIE
L*, a*, b* colour system, where L* indicate luminosity
or lightness (L* = 0 for black and L* = 100 for white),
and the chromatic parameters a* represent the
proportion of redness. On horizontal axis, positive
a* indicate a Hue of red-purple; negative a*, of
bluish-green. On the vertical axis, b* represent the
proportion of yellowness and varies from blue (-) to
yellow (+). The colour purity indicated as chroma C*
is calculated as C* = (a*2 + b*2)1/2 and colour tone
indicated as Hue angle (h°) in a colour wheel of 360°
Figure 1. Fruit diameter of grapefruit at different periods of fruit
(0° = red-purple, 90° = yellow, 180° = bluish-green
development. LSD indicates the least significant difference test
and 270° = blue) is calculated as h° = arctan (b*/a*)
at p<0.05. Values are means ± SE and with a common letter are
described by McGuire (1992).
not significantly different at 5% level.
84