Singh et.al.
maturation and fruit colour turned yellow after
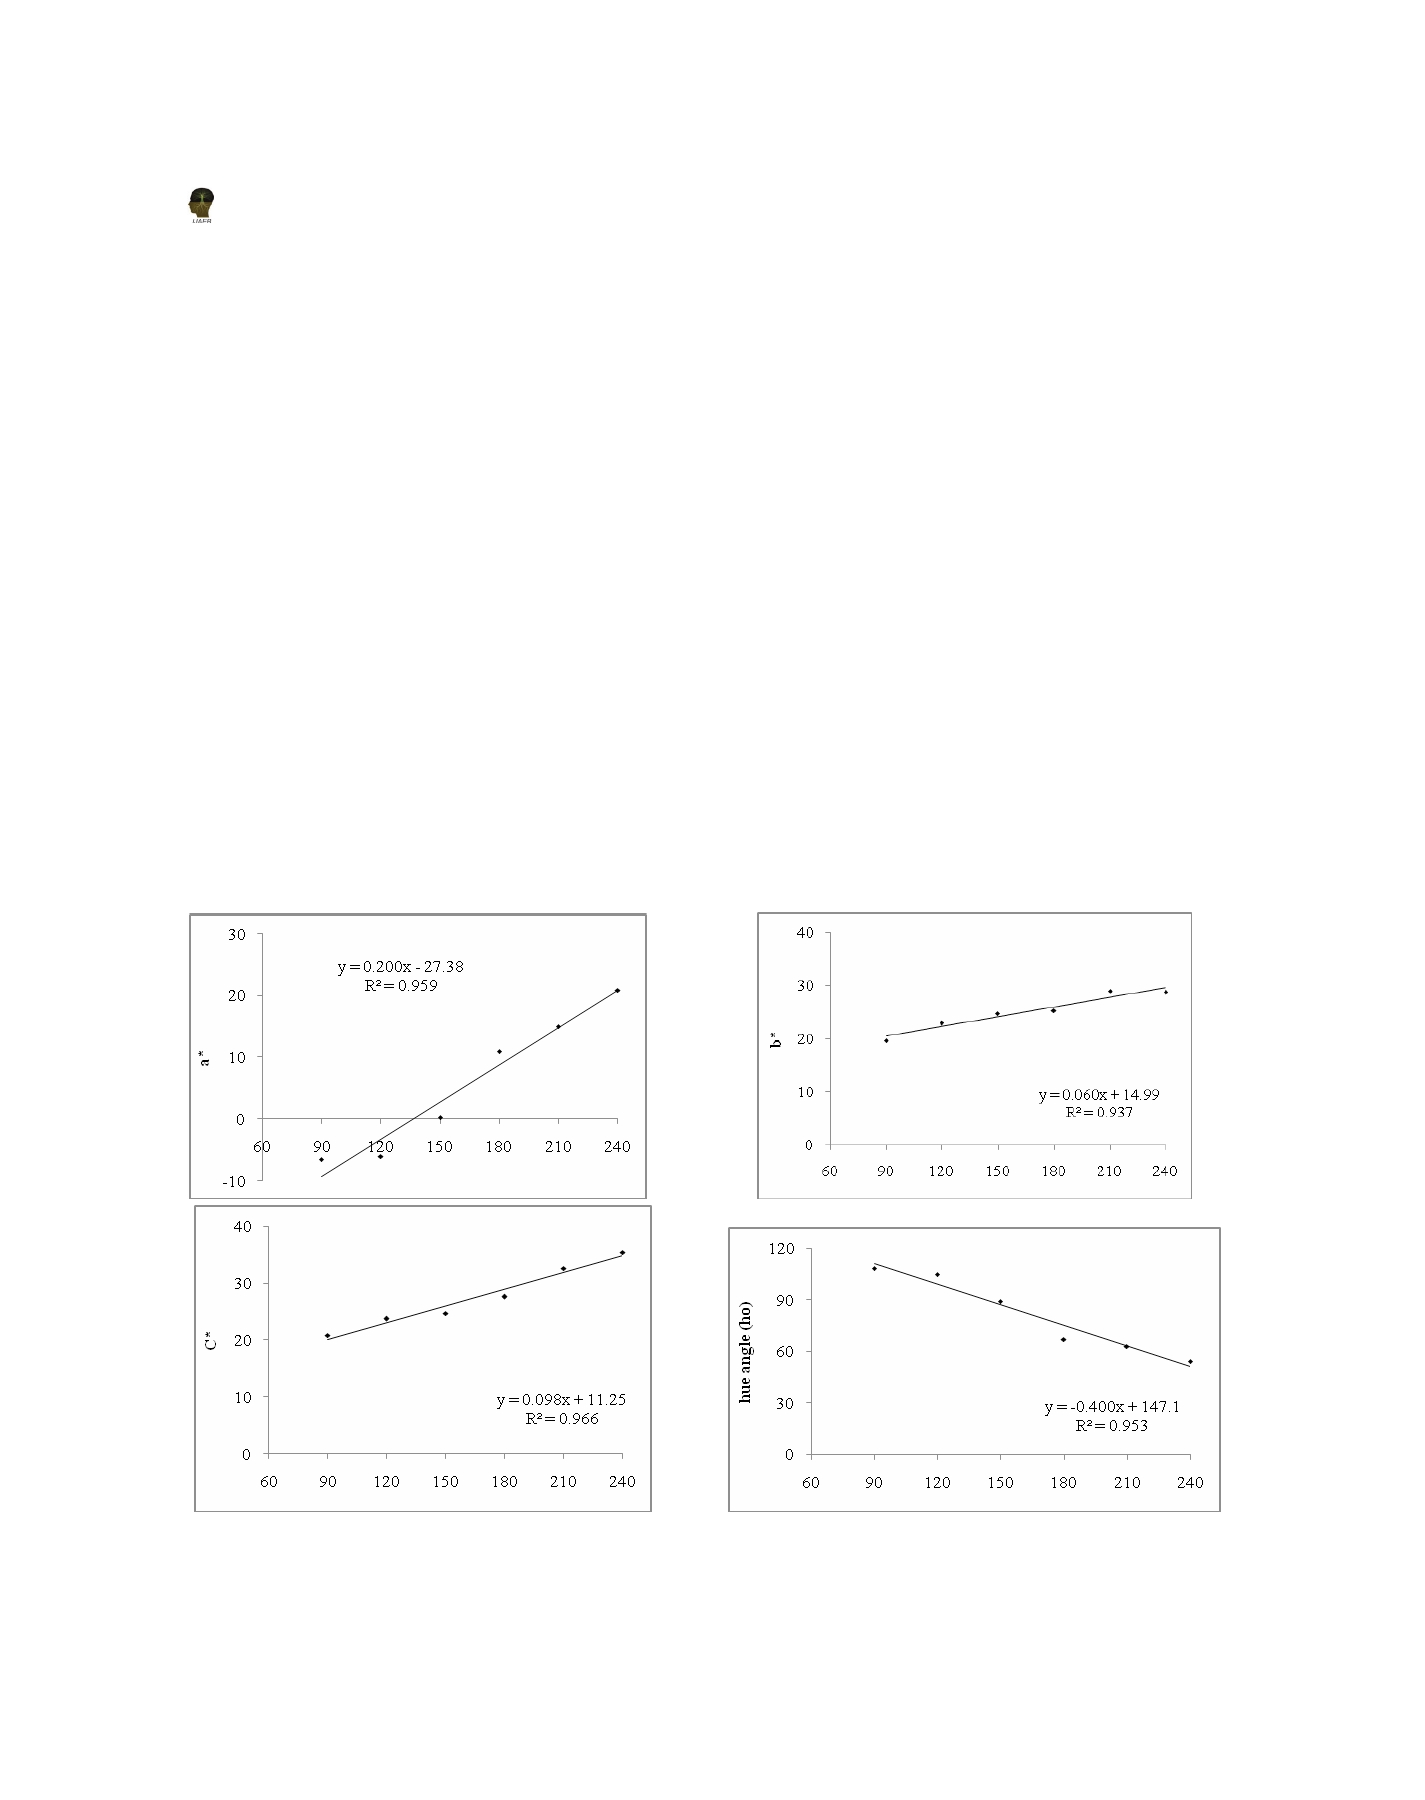
The strong linear relationship, in present study was
250 days. The minimum hue angle (h°=53.99±0.52)
found between a* and fruit development (R 2 = 0.96).
of fruit peel was recorded at the 240 DAFS. But the
The R 2 value indicates that 96% of the variation
maximum hue angle (h° = 108.39±0.33) was noted at
can be accounted for the change in a*. The colour
90 DAFS in the green region during the initial stage of
values b* (R 2 = 0.94) and L* (R 2 = 0.93) were also
fruit development. The maximum seasonal variation
strongly correlated with fruit development period.
was noted in colour parameter a* (CV = 189.99%) and
The R 2 values indicate that 94% and 93% variation
minimum seasonal variation was noted in L* (CV =
in data can be accounted by the change in b* or L*,
9.42%). Similarly, Alam-Eldein (2012) showed that
respectively. Similarly, the positive correlation was
peel colour index is an indicator of early changes, to
recorded in the chroma and fruit development. The
some extends and as such may be used as a quick
determination ratio was recorded R 2 = 0.97, which
and easy tool to determine the level of peel maturity.
accounted 97% variability in data. The negative
correlation was recorded between hue angle and
Relationship between fruit colour parameters (L*,
the fruit development, which implies that hue angle
a*, b*, C*, ho) and fruit development
decreased with the advancement of fruit maturity.
Regression equations for the prediction of fruit
The study suggests that fruit development correlated
maturity based on L*, a*, b*, chroma and hue values
with fruit peel colour and this may be useful for
are given in Figure 2. Studies revealed there exit
establishing harvest guidelines to avoid harvesting
strong correlations between colour space values (L*,
too early (immature fruit) or too late (senescent
a*, b*, C* and ho) with the fruit development period.
fruit) so that less postharvest injuries occur while the
Allȱofȱtheseȱchangesȱwereȱhighlyȱsignificantȱ(pȱ<ȱ0.05)ȱ
fruit still has acceptable quality (Sirisomboon and
andȱfruitȱmaturityȱhadȱeffectȱonȱcolourȱparameters.ȱ
Theamprateep, 2012).
Days after fruit set (DAFS)
Figure 2 Relationship between colour parameters (L*, a*, b*, C* and h°) and fruit development. R 2 indicates dynamic intensity.
86