Gene Expression Study of Arachis Hypogaea L.
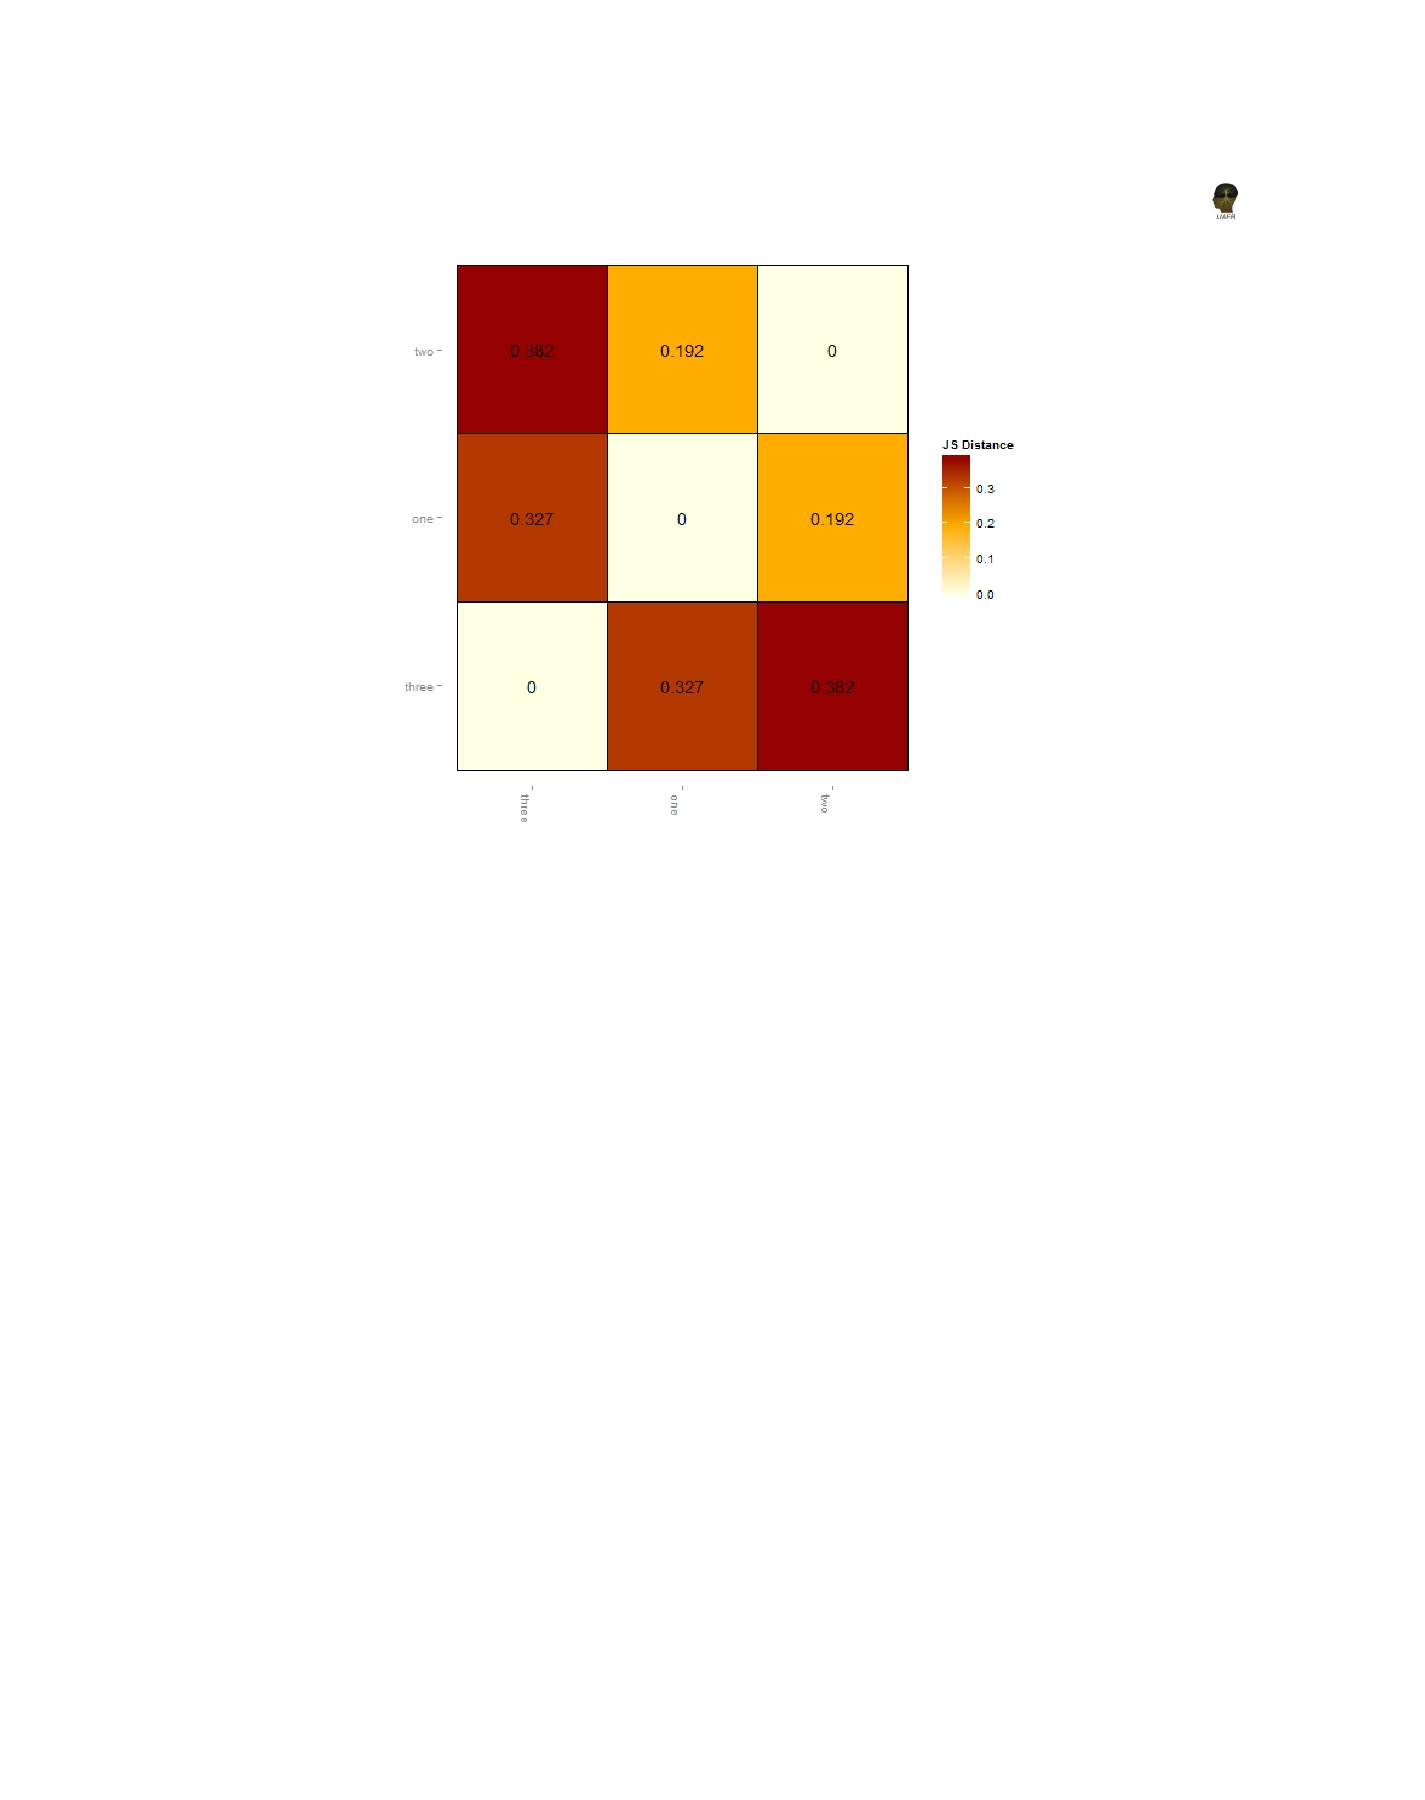
Figure 6. Pairwise similarities of three RNA-Seq samples.
3. Gene density plot
groupingsȱ ofȱ conditionsȱ andȱ Figureȱ 6ȱ providesȱ
Figureȱ3ȱshowsȱgeneȱdensityȱplotȱofȱthreeȱRNA-Seqȱ
theȱ csDistHeat()ȱ methodȱ toȱ visualizeȱ theȱ pairȱ wiseȱ
samples,ȱ whichȱ showsȱ theȱ distributionsȱ ofȱ FPKMȱ
similaritiesȱbetweenȱthreeȱconditions.
scoresȱacrossȱthreeȱsamplesȱwithȱdifferentȱscores.
Conclusion
4. Dendrogram
Next-generationȱ sequencingȱ (NGS)ȱ hasȱ becomeȱ aȱ
Figureȱ4ȱshowsȱtheȱdendrogramȱofȱthreeȱRNA-Seqȱ
feasibleȱmethodȱforȱincreasingȱsequencingȱdepthȱandȱ
samplesȱforȱthreeȱdifferentȱconditions.ȱSampleȱthreeȱ
coverageȱwhileȱreducingȱtimeȱandȱcostȱcomparedȱtoȱ
isȱdistantlyȱrelatedȱwithȱrespectȱtoȱsamplesȱoneȱandȱ
theȱtraditionalȱSangerȱmethodȱ(LȱJȱCollinsȱ et al. 2008).ȱ
two.ȱWhileȱsampleȱoneȱandȱtwoȱshareȱcommonȱnodeȱ
Thereȱareȱseveralȱsoftwareȱpackagesȱexistsȱforȱshortȱ
formȱaȱclade.ȱ
readȱalignment,ȱandȱrecentlyȱspecializedȱalgorithmsȱ
forȱ transcriptomeȱ alignmentȱ haveȱ beenȱ developed,ȱ
5. Volcano plots
e.g.ȱTopHat2ȱforȱaligningȱreadsȱtoȱaȱreferenceȱgenomeȱ
toȱ discoverȱ spliceȱ sites,ȱ Cufflinksȱ toȱ assembleȱ theȱ
Figureȱ5ȱshowsȱtheȱvolcanoȱplotsȱofȱthreeȱRNA-Seqȱ
transcriptsȱ andȱ compare/mergeȱ themȱ withȱ othersȱ
dataȱinȱwhich,ȱredȱdotsȱshowsȱsignificantȱgenesȱwhileȱ
andȱCummeRbundȱisȱdesignedȱtoȱhelpȱsimplifyȱtheȱ
blackȱdotsȱshowsȱnon-significantȱgenes.
analysisȱ andȱ explorationȱ portionȱ ofȱ RNA-Seqȱ dataȱ
derivedȱfromȱtheȱoutputȱofȱaȱdifferentialȱexpressionȱ
6. Similarities between conditions
analysisȱ usingȱ Cuffdiffȱ withȱ theȱ goalȱ ofȱ providingȱ
Similaritiesȱ betweenȱ conditionsȱ canȱ provideȱ usefulȱ fastȱandȱintuitiveȱaccessȱofȱresults.ȱ(LȱJȱCollinsȱ et al.
insightȱ intoȱ theȱ relationshipȱ betweenȱ variousȱ 2008).ȱ
301