Time Series Modeling for Trend Analysis and Forecasting Wheat Production of India
Table 4. Result of ADF test
Critical values at
Test
ADF statistic
Prob.
Decision
1%
5%
10%
ADF at level
-2.978
-4.161
-3.506
-3.183
0.148
Data Non-Stationary
ADF at first difference
-11.016
-4.161
-3.506
-3.183
0.0001
Data Stationary
0.4477ȱZ t-1ȱ +ȱe t
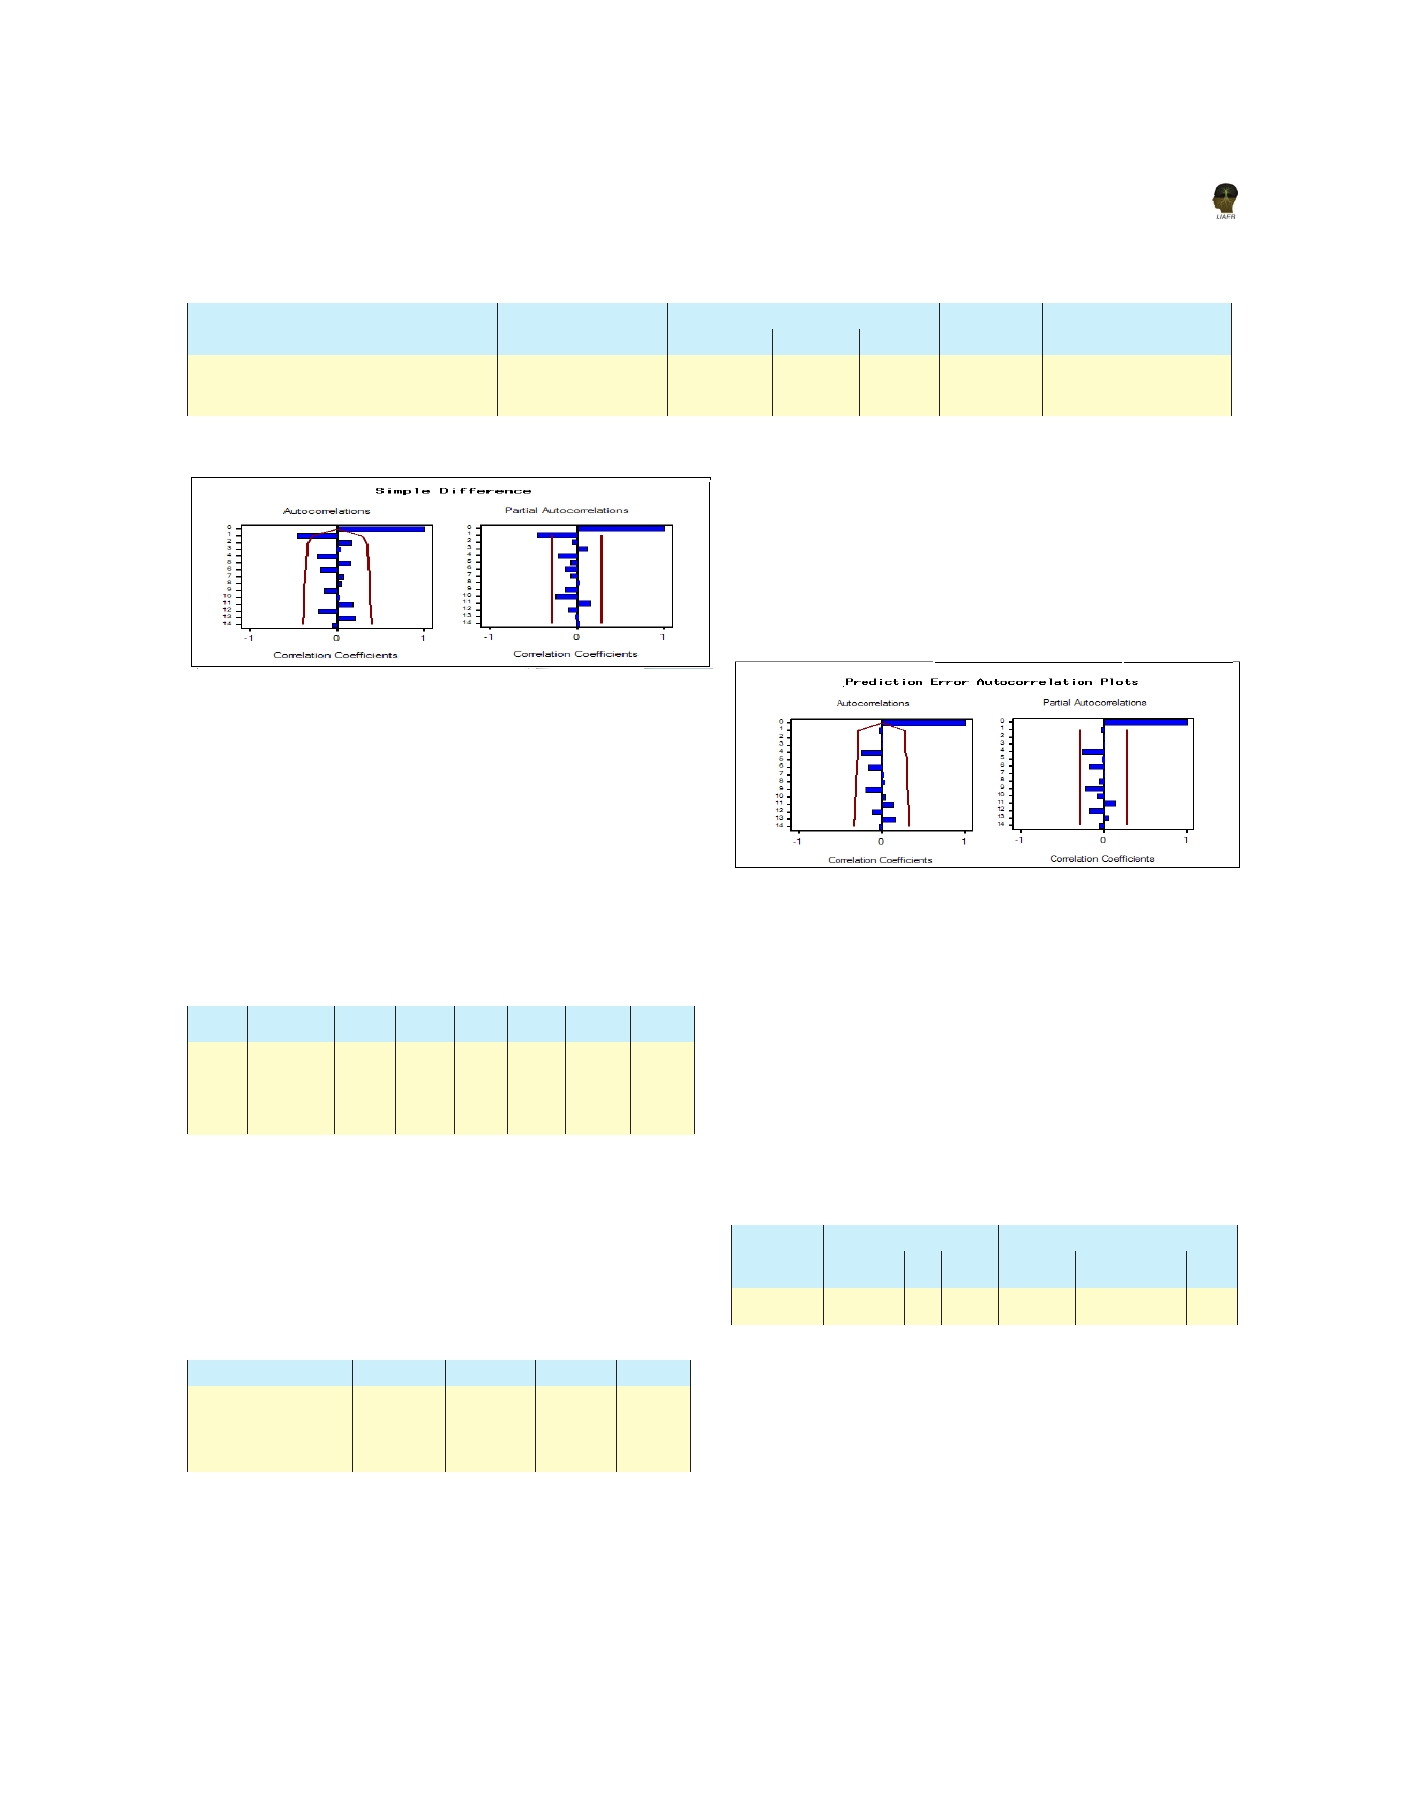
FromȱtheȱresidualȱACFȱandȱPACFȱplotsȱofȱARIMAȱ
(1,1,0),ȱ itȱ wasȱ clearȱ thatȱ allȱ autocorrelationsȱ andȱ
partialȱ autocorrelationsȱ lieȱ betweenȱ 95%ȱ controlȱ
limitsȱasȱshownȱinȱFigureȱ4.ȱThisȱalsoȱconfirmedȱtheȱ
‘goodȱfit’ȱofȱthisȱselectedȱmodel.
Figure 3 Correlogram of ACF and PACF for first differenced
wheat production
Inȱthisȱpresentȱwork,ȱpossibleȱARIMAȱ(p,d,q)ȱmodelsȱ
suchȱasȱ(1,1,1),ȱ(0,1,1)ȱandȱ(1,1,0)ȱwereȱcomparedȱtoȱ
eachȱ other.ȱ Amongȱ allȱ possibleȱ models,ȱ ARIMAȱ
(1,1,0)ȱwasȱselectedȱasȱoptimalȱandȱmostȱappropriateȱ
modelȱ dueȱ toȱ modelȱ selectionȱ criteriaȱ suchȱ asȱ
minimumȱvaluesȱofȱRMSE,ȱMAPE,ȱMAE,ȱMSE,ȱAIC,ȱ
Figure 4 Residual ACF and PACF of ARIMA (1,1,0)
SBCȱandȱhighȱR-squaredȱvalueȱ(Tableȱ5).
Forȱ checkingȱ normalityȱ andȱ randomness,ȱ Shapiro-
Table 5. ARIMA Model Fit statistics
Wilkȱ andȱ Runȱ testsȱ wereȱ appliedȱ respectivelyȱ toȱ
residualsȱofȱARIMA(1,1,0)ȱandȱresultsȱwereȱpresentedȱ
Model
R-squared
RMSE
MAPE
MAE
MSE
AIC
SBC
inȱ Tableȱ 7.ȱ Theȱ probabilityȱ valuesȱ forȱ theȱ bothȱ theȱ
(1,1,1)
0.980
3.141
7.866
2.585
9.861
118.027 123.702
testsȱwereȱgreaterȱthanȱ0.05ȱindicatingȱresidualsȱwereȱ
(0,1,1)
0.978
3.172
8.002
2.631 10.049 117.069 120.852
distributedȱnormallyȱandȱindependently.ȱHistogramȱ
(1,1,0)
0.981
3.136
7.791
2.576
9.838
116.145
119.928
ofȱ residualsȱ isȱ depictedȱ inȱ Figureȱ 5ȱ whichȱ furtherȱ
confirmedȱtheȱnormalityȱforȱtheȱresiduals.
Itȱ wasȱ foundȱ thatȱARIMAȱ modelȱ performedȱ betterȱ
thanȱtheȱearlierȱselectedȱmodelsȱviz.ȱQuadraticȱandȱ
Table 7. Tests of Normality and Randomness of residuals
Holt.ȱ Theȱ parametersȱ wereȱ estimatedȱ forȱ theȱ bestȱ
Shapiro-Wilk
Run test
selectedȱmodelȱi.e.,ȱARIMAȱ(1,1,0)ȱasȱmentionedȱinȱ
Statistic df
Sig. Z-value No of Runs Sig.
Tableȱ6.
Residuals 0.984
49 0.741 -0.801
22
0.423
Table 6. ARIMA (1,1,0) Model Parameters estimation
Finally,ȱforecastingȱwasȱdoneȱforȱwheatȱproductionȱ
Model Parameter Estimate Std. Error
t
Sig.
ofȱIndiaȱfromȱ2011-12ȱtillȱ2017-18ȱbyȱusingȱARIMAȱ
Intercept
1.46373
0.3177
4.6074
0.0001
(1,1,0)ȱ withȱ keepingȱ firstȱ threeȱ yearsȱ dataȱ forȱ
Autoregressive,
-0.44770
0.1295
-3.4562 0.0012
Lag 1
validation.ȱPredictedȱvaluesȱwithȱ95%ȱUpperȱcontrolȱ
limitsȱ (UCL)ȱ andȱ Lowerȱ controlȱ limitsȱ (LCL)ȱ wereȱ
Fromȱ Tableȱ 6,ȱ equationȱ ofȱ theȱ ARIMAȱ modelȱ wasȱ presentedȱinȱTableȱ8.ȱ
formulatedȱ as:ȱ Wheatȱ production t ȱ (Z t ) =ȱ 1.4637ȱ –ȱ
307