Shukla et al.
TimeȱSeriesȱforecastingȱmethodsȱparticularlyȱANNȱ (Shepherdȱ 1968)ȱ andȱ Splineȱ (Schoenbergȱ 1973)ȱ
methodsȱ haveȱ beenȱ developedȱ whenȱ conventionalȱ becauseȱpredictionȱestimatesȱtendȱtoȱbeȱlessȱbiasedȱ
statisticalȱmethodsȱcouldȱnotȱgiveȱsatisfactoryȱresultsȱ andȱ alsoȱ becauseȱ predictionsȱ areȱ accompaniedȱ byȱ
dueȱtoȱrestrictiveȱassumptionsȱincorporatedȱinȱtheseȱ predictionȱ standardȱ errorsȱ (quantificationȱ ofȱ theȱ
methodsȱ (Mishraȱ andȱ Singhȱ 2013,ȱ Kumariȱ et ȱ al.ȱ uncertaintyȱinȱtheȱpredictedȱvalue).
2013,ȱ2014a,ȱ2014b,ȱ2014c).ȱStudyȱconductedȱunderȱ
Theȱ objectiveȱ ofȱ theȱ presentȱ studyȱ wasȱ toȱ developȱ
GPSȱ andȱ GISȱ basedȱ soilȱ fertilityȱ mappingȱ projectȱ
theȱmodelȱforȱestimatingȱ(MishraȱandȱPandeyȱ1992)ȱ
revealedȱthatȱsoilsȱofȱVaranasiȱdistrictȱareȱdeficientȱ
theȱ valueȱ ofȱ deficientȱ micronutrientsȱ atȱ differentȱ
inȱmicronutrientsȱnamelyȱZnȱ(46%),ȱBȱ(37%)ȱandȱFeȱ
locationsȱ inȱ Kashiȱ Vidyapeethȱ blockȱ ofȱ Varanasiȱ
(15%)ȱ (Singhȱ 2012).ȱ Obviously,ȱ estimatingȱ (Pandeyȱ
district,ȱUttarȱPradeshȱ(India)ȱbyȱknowingȱtheȱvalueȱ
andȱMishraȱ1991)ȱtheȱcontentȱofȱsoilȱmicronutrientsȱ
ofȱmicronutrientsȱinȱsampledȱlocationsȱandȱtoȱstudyȱ
inȱparticularȱareaȱcanȱbeȱprovedȱhighlyȱbeneficialȱinȱ
andȱmapȱtheȱspatialȱvariabilityȱofȱmicronutrientsȱbyȱ
guidingȱtheȱfarmers,ȱmanufacturersȱandȱplannersȱinȱ
usingȱtheȱKrigingȱInterpolationȱmethod.
ascertainingȱtheȱrequirementȱofȱvariousȱfertilizersȱinȱ
makingȱprojectionsȱforȱincreasedȱrequirementȱbasedȱ
Materials and Methods
onȱ croppingȱ patternȱ andȱ intensityȱ (Bellȱ andȱ Dellȱ
2006).ȱ Therefore,ȱ presentȱ studyȱ wasȱ carriedȱ outȱ toȱ Study Area
provideȱaȱreliableȱestimateȱofȱmicronutrientsȱstatusȱ
inȱsoilȱinȱorderȱtoȱcontrolȱdirectȱandȱindirectȱlossesȱ
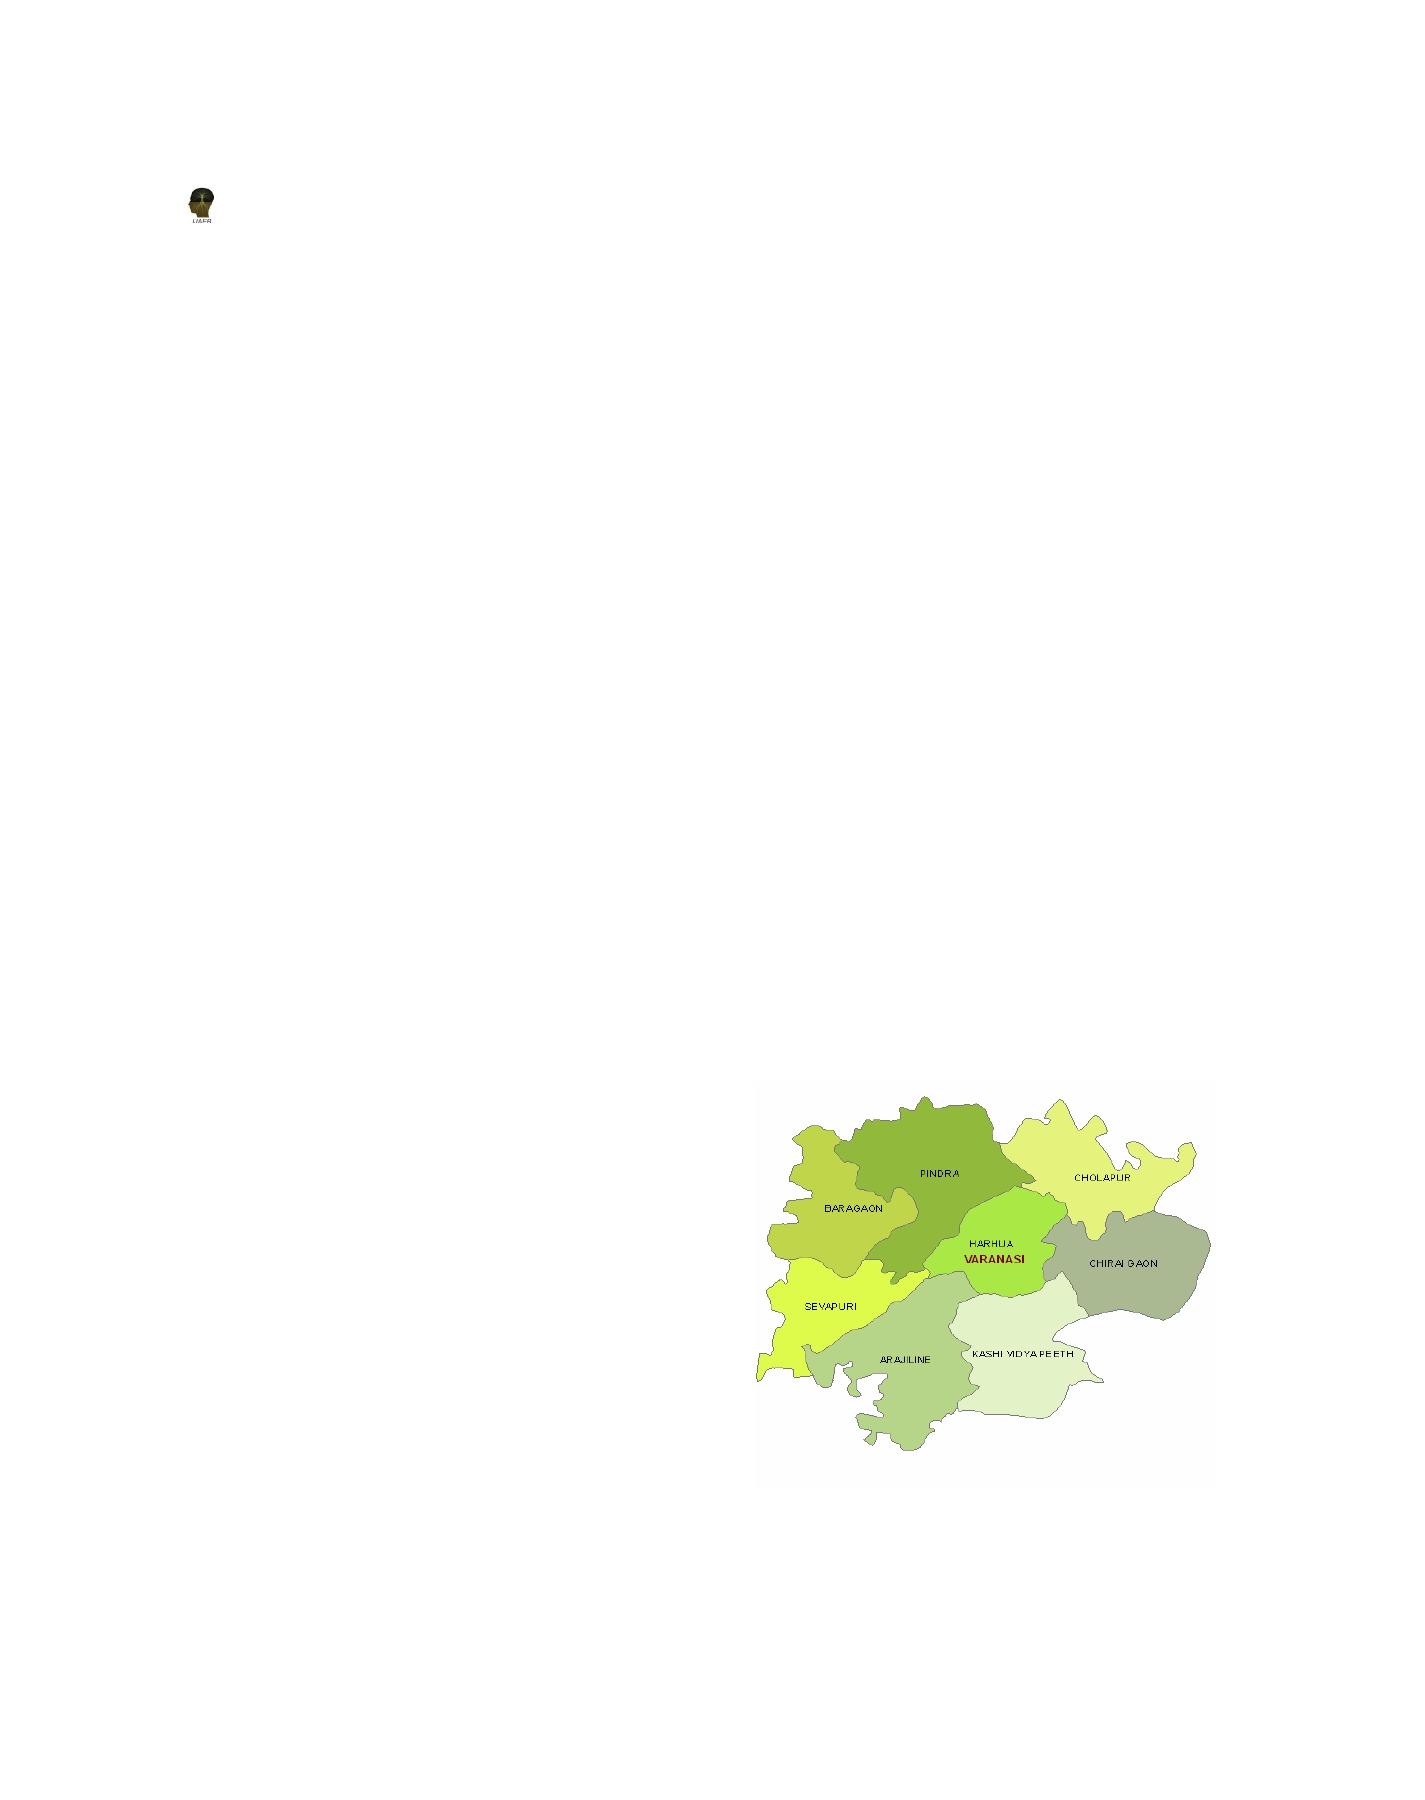
Thisȱstudyȱcoversȱanȱareaȱofȱ15896ȱhaȱlocatedȱinȱKashiȱ
ofȱsoilȱhealth,ȱcropȱproductionȱandȱhumanȱhealthȱtoȱ
VidyapeethȱblockȱofȱVaranasiȱdistrict,ȱUttarȱPradeshȱ
takeȱpriorȱactionȱforȱfuture.
(India).ȱ Varanasiȱ liesȱ inȱ theȱ middleȱ Gangesȱ valleyȱ
ofȱ Northȱ India,ȱ inȱ theȱ Easternȱ partȱ ofȱ theȱ stateȱ ofȱ
Geostatisticsȱhasȱbeenȱprovedȱtoȱbeȱoneȱofȱtheȱmostȱ UttarȱPradeshȱ(shownȱinȱFigureȱ1).ȱTheȱgeographicalȱ
effectiveȱmethodsȱinȱanalysingȱtheȱspatialȱvariabilityȱ coordinatesȱofȱtheȱareaȱareȱbetweenȱ25°16’55.2″ȱnorthȱ
ofȱ soilȱ featuresȱ (Tekinȱ et al. ȱ 2011).ȱ Theȱ precisionȱ latitudeȱ andȱ 82057’22.68″ȱ eastȱ latitude.ȱ Varanasiȱ
agriculture,ȱ therefore,ȱ largelyȱ dependsȱ uponȱ theȱ liesȱ inȱ “UP-7ȱ Easternȱ Plainȱ Zone”ȱ agroȱ climaticȱ
managementȱ ofȱ spatialȱ variabilityȱ inȱ soilȱ fertilityȱ zone.ȱ Theȱ geographicalȱ areaȱ ofȱ VaranasiȱDistrictȱisȱ
whichȱisȱaȱmajorȱproductionȱconstraintȱ(Srivastavaȱ et
approximatelyȱ 1530ȱ sq.ȱ kilometres,ȱ totalȱ croppedȱ
al. ȱ2010).ȱInȱGISȱmethod,ȱweȱcanȱapplyȱdifferentȱspatialȱ areaȱ(‘000ȱha)ȱisȱ157.096ȱ(www.agricoop.nic.in).
interpolationȱ methods.ȱ Geostatisticalȱ interpolationȱ
techniquesȱ areȱ basedȱ onȱ statisticsȱ andȱ areȱ usedȱ
forȱ moreȱ advancedȱ predictionȱ surfaceȱ modellingȱ
thatȱ alsoȱ includesȱ someȱ measureȱ ofȱ theȱ certaintyȱ
orȱ accuracyȱ ofȱ predictions.ȱ Krigingȱ interpolationȱ
(Krigeȱ 1951)ȱ hasȱ beenȱ consideredȱ oneȱ ofȱ theȱ bestȱ
efficientȱspatialȱinterpolationȱapproachesȱforȱspatialȱ
estimation.ȱ Inȱ thisȱ methodȱ surroundingȱ knownȱ
valuesȱ areȱ takenȱ asȱ weightsȱ andȱ theseȱ weightsȱ areȱ
basedȱnotȱonlyȱonȱtheȱdistanceȱbetweenȱtheȱknownȱ
pointsȱ andȱ theȱ unmeasuredȱ pointȱ butȱ alsoȱ onȱ theȱ
overallȱgeostatisticalȱrelationshipsȱamongȱtheȱknownȱ
points.ȱKrigingȱisȱcapableȱofȱproducingȱaȱpredictionȱ
surfaceȱ andȱ alsoȱ providingȱ someȱ measureȱ ofȱ theȱ
certaintyȱ ofȱ theȱ predictions.ȱ Itȱ isȱ anȱ improvementȱ
overȱ otherȱ spatialȱ interpolationȱ methodsȱ viz.ȱ IDWȱ
Figure 1: Map of Varanasi District
310