Shukla et al.
Table 1. Semivariogram models and parameters of spatial distribution for soil micronutrients evaluated
Soil Prop/
Nugget
Spatial Dependence
Residual Sum
Sill (Co+C)
Range
Model
Model R 2
Nutrients
(Co)
{C/ (Co+C)}*100
of Square
Zn
0.0076
0.0632
88.00
630
Spherical
0.510
2.32E-03
B
0.0235
0.2856
50.20
629.07
Gaussian
0.673
5.98E-06
Fe
0.334
0.669
49.93
150
Spherical
0.710
1.07E+00
Tableȱ1ȱshowedȱthatȱdecisionȱcoefficientsȱ(R 2 )ȱofȱZn,ȱ rangeȱofȱvariablesȱandȱwasȱrelatedȱtoȱtheȱinteractionȱ
BȱandȱFeȱandȱotherȱsoilȱpropertiesȱrangedȱbetweenȱ betweenȱvariousȱprocessesȱofȱsoilȱproperties,ȱwhichȱ
0.510-0.710.ȱTheȱresultsȱindicatedȱthatȱtheȱtheoreticalȱ areȱ affectedȱ atȱ bothȱ observingȱ andȱ samplingȱ scale.ȱ
modelsȱ chosenȱ preferablyȱ reflectedȱ theȱ spatialȱ Theȱsoilȱmicronutrientsȱhaveȱspatialȱautocorrelationȱ
structureȱcharacters.ȱTheȱgeostatisticalȱdataȱshowedȱ withinȱtheȱrange;ȱotherwiseȱitȱdoesȱnotȱexist.ȱSimilarȱ
thatȱmanyȱofȱtheȱvariablesȱstudiedȱhaveȱtheȱbestȱfitȱtoȱ findingsȱ wereȱ observedȱ byȱ Wangȱ et ȱ al.ȱ (2008).ȱ Theȱ
SphericalȱandȱGaussian.
rangeȱvaluesȱZn,ȱBȱandȱFeȱwereȱalsoȱsmallȱasȱ630,ȱ
629.07ȱandȱ150m,ȱrespectivelyȱ(Table1).ȱTheȱsmallerȱ
TheȱC 0 ȱinȱTableȱ1ȱisȱnuggetȱvalueȱorȱspatialȱvariabilityȱ
rangeȱ suggestsȱ smallerȱ samplingȱ intervals.ȱ Smallerȱ
arisingȱfromȱtheȱrandomȱcomponents.ȱC 0 ȱofȱFeȱwasȱ
rangesȱwereȱobtainedȱforȱZn,ȱBȱandȱFeȱcontent.
high,ȱhowever,ȱC 0ȱ ofȱotherȱvariablesȱwereȱquiteȱsmall.ȱ
Itȱwasȱconcludedȱthatȱinȱtheȱcurrentȱscaleȱofȱstudy,ȱ Theȱ valueȱ ofȱ Residualȱ sumȱ ofȱ squaresȱ (RSS)ȱ i.e.,ȱ
theȱvariabilityȱofȱmanyȱsoilȱpropertiesȱresultedȱfromȱ theȱ sumȱ ofȱ squaredȱ errorsȱ (SSE)ȱ ofȱ estimationȱ hasȱ
measurementȱerrorsȱandȱmicro-scaleȱprocessesȱwereȱ beenȱ foundȱ smallȱ showingȱ theȱ observedȱ dataȱ andȱ
high.
estimatedȱvalues.
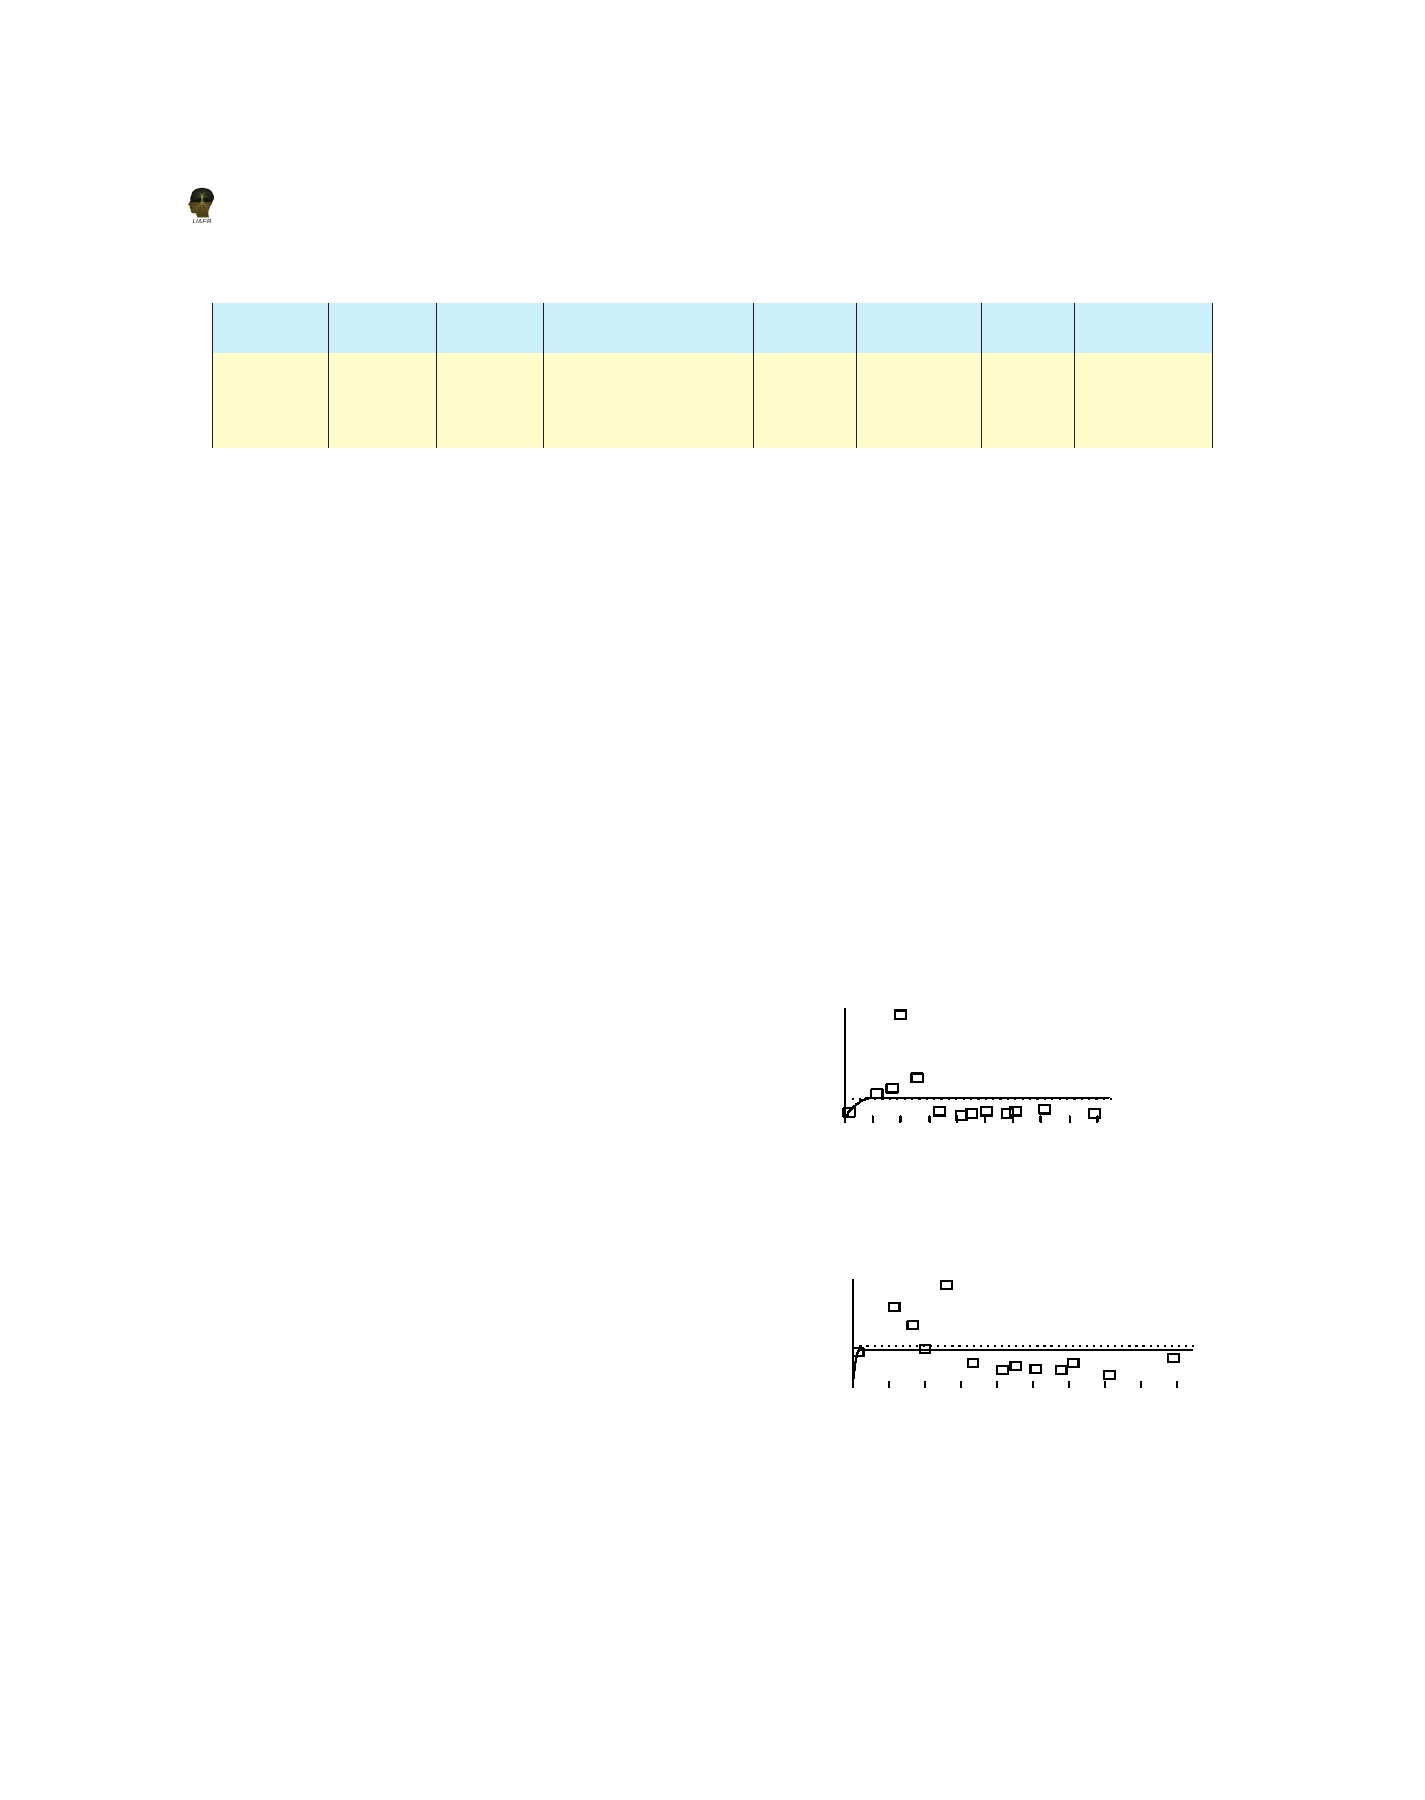
Nugget/sillȱ ratioȱ (calledȱ alsoȱ nuggetȱ effect)ȱ isȱ Figureȱ2,ȱFigureȱ3ȱandȱFigureȱ4ȱareȱtheȱsemivariogramȱ
usedȱtoȱclassifyȱspatiallyȱstructuredȱvariationȱforȱaȱ modelsȱforȱZn,ȱBȱandȱFe,ȱrespectively.
regionalizedȱ variableȱ asȱ wellȱ asȱ givesȱ goodnessȱ ofȱ
Zn: Isotropic Variogram
prediction.ȱIfȱtheȱratioȱwasȱequalȱorȱlowerȱthanȱ25%,ȱ
variableȱ wasȱ consideredȱ toȱ beȱ stronglyȱ dependent;ȱ
0.276
0.207
ifȱ betweenȱ 25-75%,ȱ thenȱ moderatelyȱ dependent;ȱ
0.138
andȱifȱ>75%,ȱweaklyȱdependent.ȱTheȱstrongȱspatialȱ
0.069
dependencyȱofȱaȱsoilȱpropertyȱcanȱbeȱattributedȱtoȱ
0.000
intrinsicȱ factors,ȱ andȱ weakȱ spatialȱ dependencyȱ toȱ
0.00
2123.28
4246.56
6369.84
Separation Distance (h)
extrinsicȱfactors.ȱItȱwasȱobservedȱthatȱC 0 /(C 0 +C)ȱforȱ
Bȱ andȱ Feȱ contentsȱ wereȱ allȱ betweenȱ 25-75%whichȱ
Spherical model (Co = 0.00610; Co + C = 0.05520; Ao = 630.00; r2 = 0.021;
indicatedȱ thatȱ variationȱ ofȱ availableȱ micronutrientȱ
RSS = 0.0641) Figure 2. Variogram Model (Zn)
contentsȱ wereȱ controlledȱ bothȱ byȱ intrinsicȱ andȱ
B: Isotropic Variogram
extrinsicȱ factorsȱ (eg.ȱ fertilization,ȱ Cultivationȱ etc.).ȱ
0.0589
Inȱthisȱstudyȱratioȱwasȱ88%ȱ(>75%)ȱforȱZnȱi.e.,ȱtheseȱ
0.0442
variablesȱwereȱweaklyȱdependentȱandȱitȱalsoȱshowedȱ
0.0295
thatȱsemivariogramȱparametersȱobtainedȱfromȱfittingȱ
0.0147
ofȱ experimentalȱ semivariogramȱ valuesȱ wereȱ fairlyȱ
0.0000
0.00
2123.28
4246.56
6369.84
reasonableȱtoȱdescribeȱtheȱspatialȱvariation.
Separation Distance (h)
Theȱ geostatisticalȱ rangeȱ (calledȱ theȱ largestȱ spatialȱ
Spherical model (Co = 0.00061; Co + C = 0.02022; Ao = 120.00; r2 = 0.000;
RSS = 3.218E-03)
correlationȱ distance)ȱ reflectedȱ theȱ autocorrelationȱ
Figure 3. Variogram Model ( B )
312