Optimal Size of Fish Pond for Socio-Economical Development of Cachar (Assam)
theȱextentȱtoȱwhichȱpoorerȱgroupsȱparticipateȱinȱandȱ sizeȱofȱaȱfishȱfarmȱplaysȱaȱveryȱvitalȱroleȱinȱdecidingȱ
benefitȱ fromȱ fisheriesȱ orȱ aquaculture.ȱ Theyȱ usedȱ aȱ theȱincomeȱofȱaȱfarmer.ȱInȱthisȱstudy,ȱanȱoptimalȱfishȱ
Giniȱdecompositionȱexerciseȱandȱcollectedȱtheȱdataȱ farmȱsizeȱhasȱbeenȱdeterminedȱonȱtheȱbasisȱofȱtotalȱ
byȱ theirȱ ownȱ survey.ȱ Theyȱ collectedȱ dataȱ fromȱ 43ȱ fishȱproductionȱinȱtheȱfarm.
fishingȱcampsȱbyȱconductingȱsurveys,ȱinterviewsȱandȱ
groupȱ discussions.ȱ Itȱ includesȱ recordsȱ ofȱ peoples’ȱ Materials and Methods
incomesȱandȱexpendituresȱinȱtheȱpreviousȱyear.ȱTheyȱ
Thisȱ sectionȱ dealsȱ withȱ theȱ studyȱ areaȱ (location,ȱ
usedȱstatisticalȱtestsȱ(anȱanalysisȱofȱvarianceȱandȱpairȱ
climate,ȱ geographicalȱ area,ȱ statusȱ ofȱ fishery),ȱ
wiseȱmultipleȱcomparison)ȱtoȱdetermineȱcorrelationsȱ
questionnaire,ȱprocedureȱofȱdataȱcollectionȱandȱtheirȱ
onȱtheȱroleȱofȱfisheriesȱparticularlyȱregardingȱincomeȱ
statisticalȱanalysis.
generation.
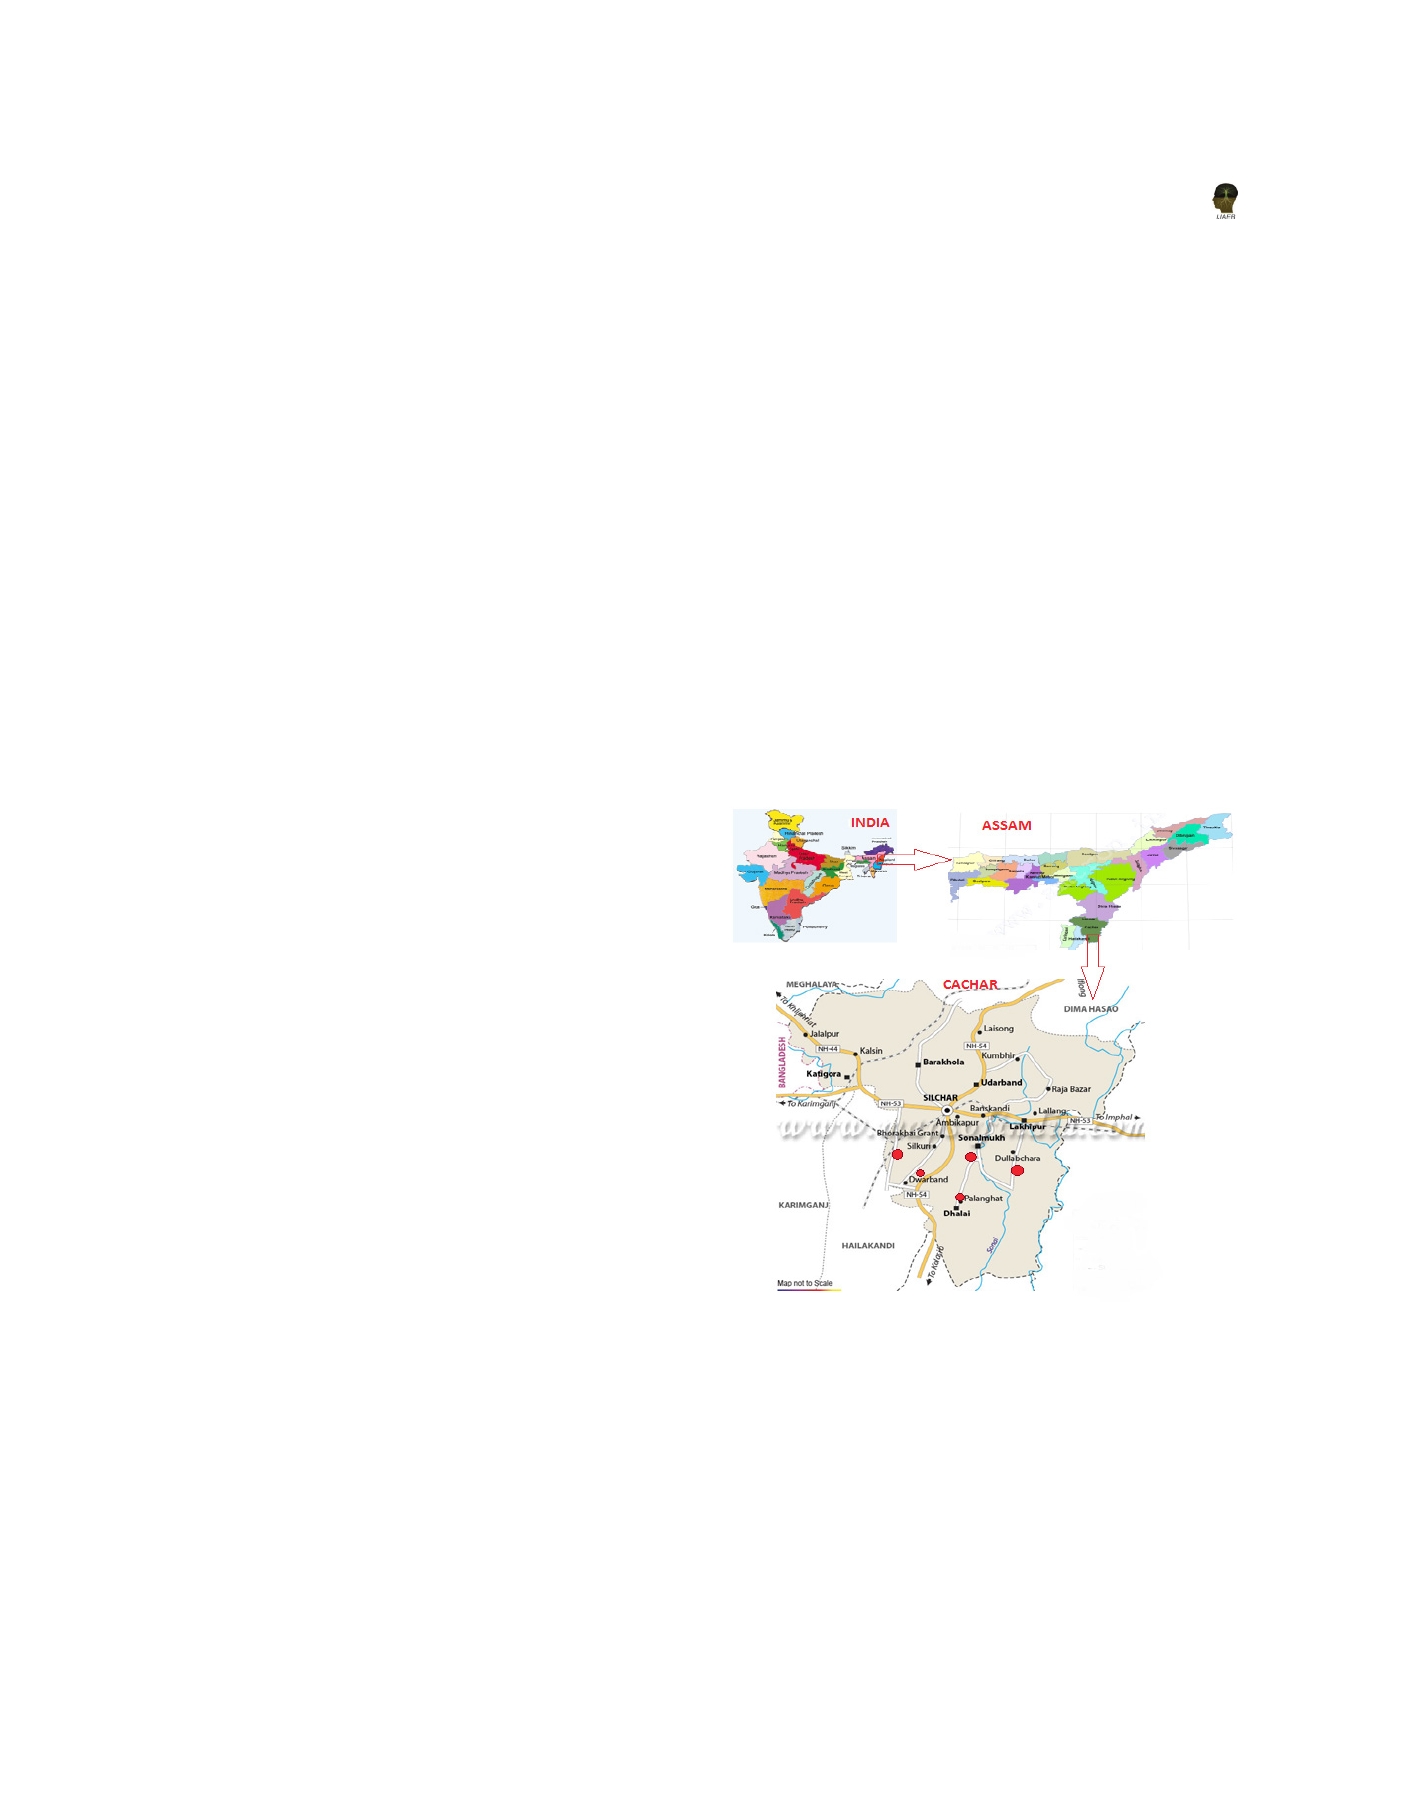
TheȱCacharȱdistrictȱisȱsituatedȱinȱtheȱsouthernȱpartȱofȱ
Stanleyȱ et al. ȱ (2003),ȱ reportedȱ aboutȱ theȱ economicȱ
IndianȱstateȱofȱAssam.ȱTheȱtotalȱgeographicalȱareaȱofȱ
effectsȱ ofȱ fisheriesȱ onȱ shrimp.ȱ Studyȱ conductedȱ byȱ
theȱdistrictȱisȱ3,786ȱSq.ȱKm.ȱTheȱdistrictȱliesȱbetweenȱ
Stanleyȱ et al. ȱ (2003)ȱ wasȱ mainlyȱ basedȱ onȱ nationalȱ
92°ȱ24’ȱEȱandȱ93°ȱ15’ȱEȱlongitudeȱandȱ24°ȱ22’ȱNȱandȱ
householdȱ survey;ȱ Stanley’sȱ methodologyȱ wasȱ aȱ
25°ȱ 8’ȱ Nȱ latitudeȱ 35ȱ metersȱ aboveȱ meanȱ seaȱ level.ȱ
qualitativeȱapproachȱonȱaȱcountryȱspecificȱbasisȱandȱ
Totalȱ populationȱ ofȱ Cacharȱ districtȱ isȱ 17,ȱ 36,319ȱ asȱ
isȱseenȱasȱtheȱbestȱoptionȱforȱappraisingȱaquaculture’sȱ
perȱCensusȱ2011.ȱAverageȱdensityȱisȱ459ȱperȱsq.ȱkm.ȱ
contributionȱtoȱaȱregionalȱeconomy.
TheȱlocationȱofȱCacharȱdistrictȱisȱshownȱinȱFigureȱ1.
Likewise,ȱ Olasunkanmiȱ (2012)ȱ reportedȱ aboutȱ theȱ
economicȱ analysisȱ ofȱ fishȱ farmingȱ inȱ Osunȱ State,ȱ
South-Westernȱ Nigeria.ȱ Theȱ dataȱ wereȱ collectedȱ
fromȱ seventyȱ twoȱ randomlyȱ selectedȱ fishȱ farms.ȱ
Dataȱwereȱanalyzedȱusingȱdescriptiveȱstatistics,ȱcostsȱ
andȱreturns,ȱasȱwellȱasȱmultipleȱregressionȱanalysis.ȱ
Chakravarttyȱ et al. ȱ(2012)ȱworkedȱonȱtheȱfishȱdiversityȱ
withȱ specialȱ referenceȱ toȱ theȱ classifiedȱ ornamentalȱ
fishesȱ andȱ theirȱ prospectsȱ inȱ theȱ Kaplaȱ Beelȱ ofȱ
BarpetaȱDistrict.ȱDeyȱ et al. ȱ(2005)ȱconductedȱstudiesȱ
ofȱdisaggregatingȱconsumptionȱofȱfishȱatȱtheȱnationalȱ
levelȱ acrossȱ differentȱ incomeȱ groupsȱ andȱ differentȱ
speciesȱofȱfishes.ȱInȱmethodology,ȱtheyȱusedȱmulti-
commodityȱmodel,ȱthree-stageȱbudgetingȱnetwork,ȱ
quadraticȱ almostȱ idealȱ demandȱ systemȱ (QUAIDS)ȱ
model,ȱ regressionȱ analysis,ȱ Duncan’sȱ Multipleȱ
RangeȱTestȱ(DMRT).ȱAigaȱ et al . (2009)ȱstudiedȱaboutȱ
theȱcontributionȱofȱsmall-scaleȱfisheriesȱtoȱreducingȱ
malnutrition.
Figure 1. Cachar District Map
Despiteȱ theȱ vastȱ aquaticȱ resources,ȱAssamȱ hasȱ notȱ
TheȱdistinguishingȱfeatureȱofȱtheȱclimateȱofȱCacharȱ
beenȱableȱtoȱproduceȱampleȱfishȱtoȱcaterȱtoȱtheȱneedsȱ
isȱcopiousȱrainfallȱbetweenȱMarchȱandȱMay.ȱCacharȱ
ofȱitsȱeverȱincreasingȱpopulation.ȱAssam’sȱshareȱofȱ
districtȱ receivesȱ anȱ averageȱ annualȱ rainfallȱ ofȱ 3000ȱ
theȱtotalȱinlandȱfishȱproductionȱinȱIndiaȱisȱ6.55%.ȱTheȱ
mmȱinȱaȱyear.ȱClimateȱofȱtheȱvalleyȱisȱgenerallyȱhotȱ
407