Dissipation Studies of Metribuzin in Alfisol Soils and its Terminal Residues in Potato Tubers
Table 2. Residues of metribuzin in soil treated at different
applicationȱviz.ȱ0.25,ȱ0.50ȱandȱ1.00ȱkg.ȱha -1 fittedȱfirstȱ
doses
orderȱkineticsȱdecayȱcurve.
Residues (µg g -1 )
Days
Rates of metribuzin application (kg. ha -1 )
0.25
0.50
1.00
0.190 ± 0.003 0.328 ± 0.07
0
0.660 ± 0.05 (0)
(0)*
(0)
3
0.128 ± 0.002 0.247 ± 0.02 0.585
±
0.06
(32.6)
(24.6)
(11.3)
5
0.098 ± 0.007 0.182 ± 0.03 0.433
±
0.02
(48.4)
(44.51)
(34.3)
7
0.076 ± 0.007 0.154 ± 0.05 0.297
±
0.02
(60.0)
(53.0))
(55.0)
10
0.052 ± 0.001 0.082 ± 0.02 0.192
±
0.02
(72.6)
(69.4))
(70.9)
15
0.034 ± 0.009 0.063 ± 0.04 0.183
±
0.02
(82.1)
(80.7)
(72.2)
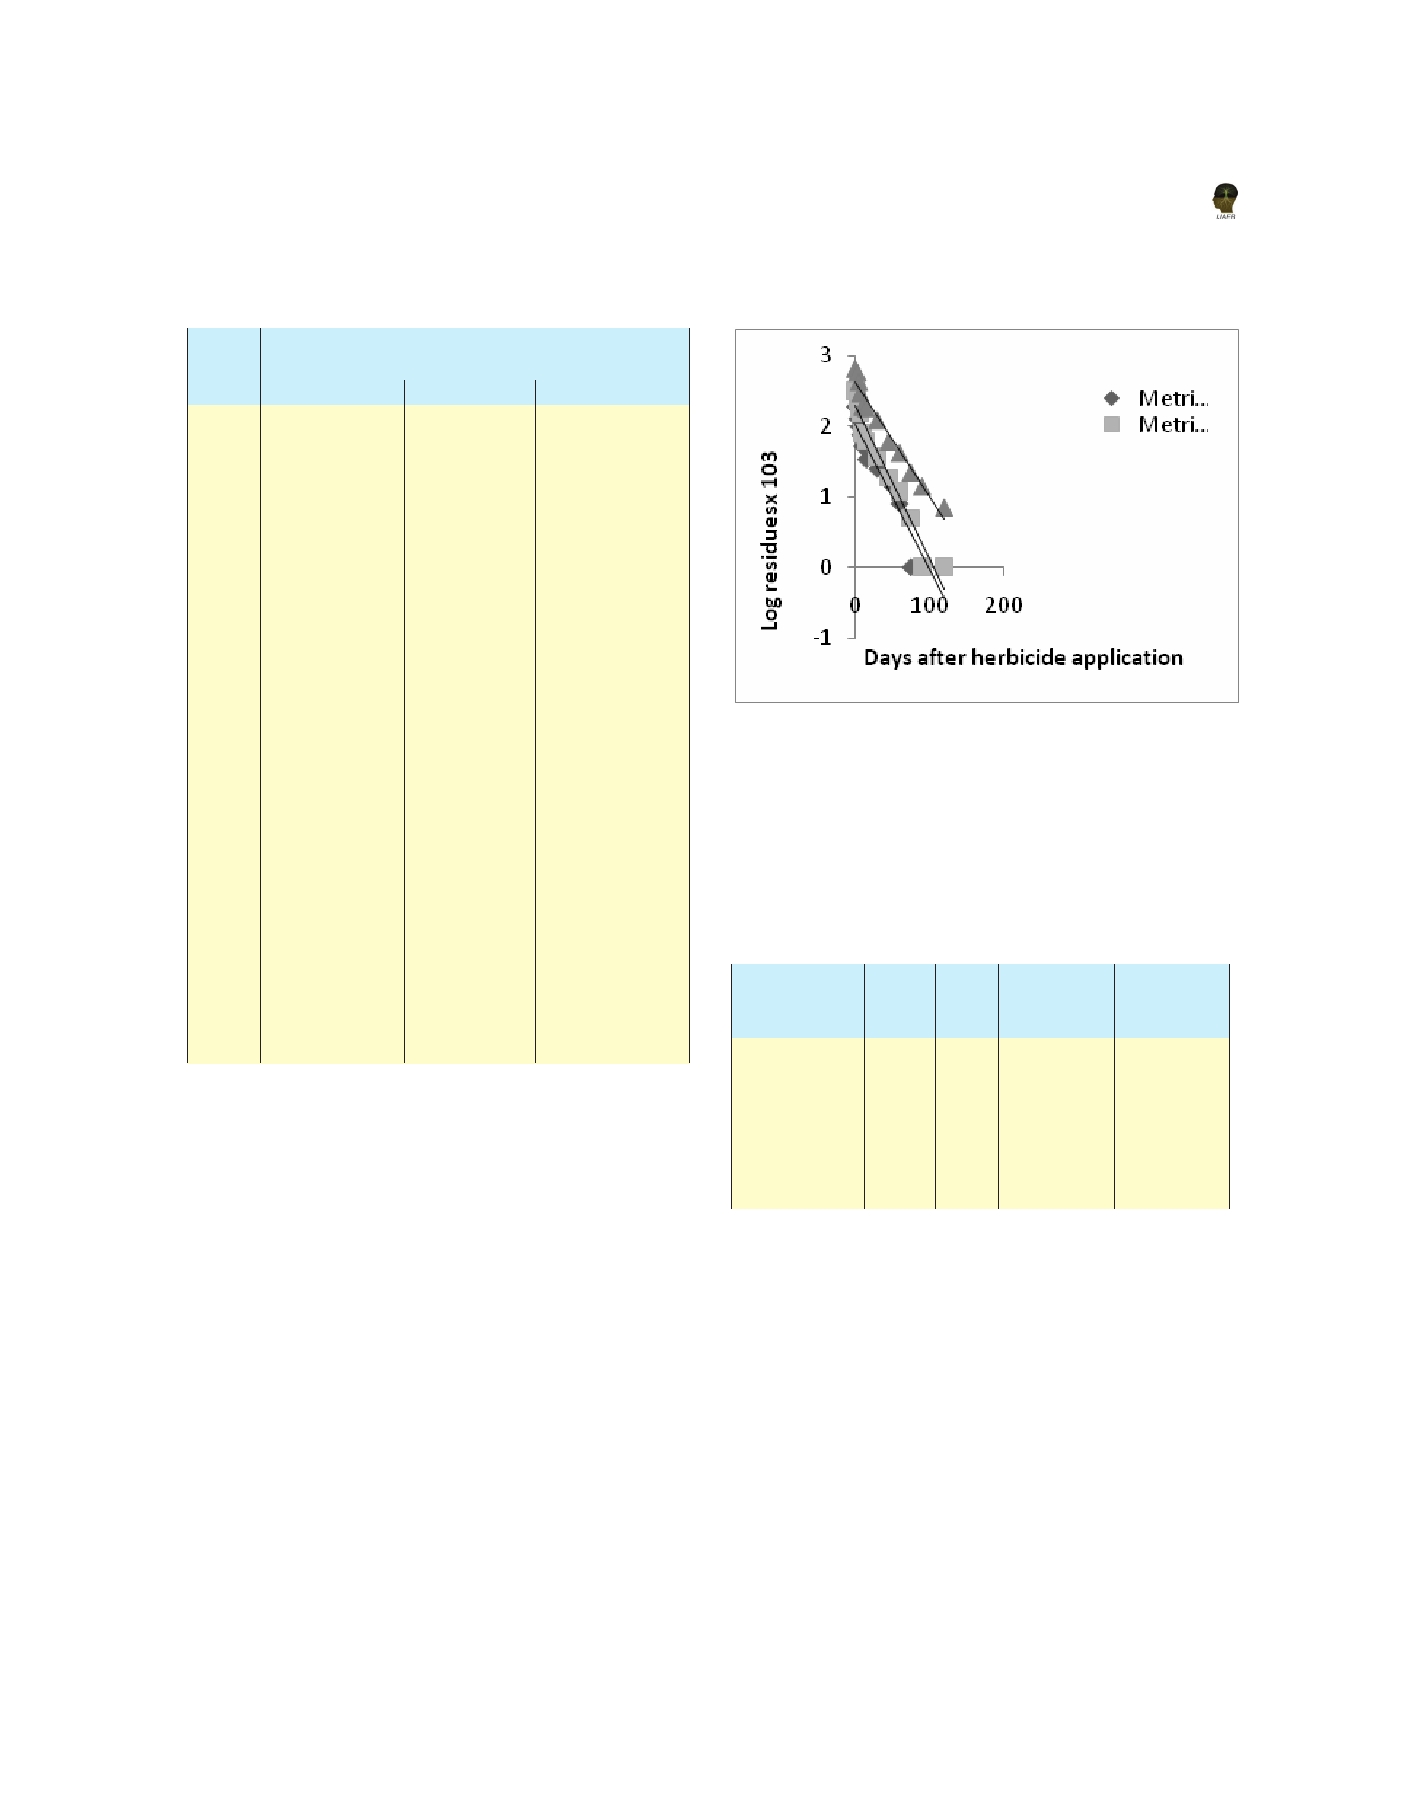
Figure 1. First order dissipation curves of metribuzin at different doses in
soil
30
0.025 ± 0.006 0.038 ± 0.05 0.122
±
0.04
(86.8)
(88.4)
(81.5)
Theȱ slopeȱ ofȱ curve,ȱ correlationȱ coefficientȱ andȱ
45
0.016 ± 0.003 0.019 ± 0.02 0.060
±
0.02
calculatedȱ halfȱ lifeȱ ofȱ herbicidesȱ alongȱ withȱ theȱ
(91.5)
(94.2)
(90.9)
regressionȱequationȱareȱsummarizedȱinȱTableȱ3.
60
0.008 ± 0.004 0.012 ± 0.01 0.042
±
0.03
(95.7)
(96.3)
(93.6)
Table 3. Slope of curve, correlation coefficient, half life and
75
0.005 ± 0.03 0.022
±
0.02
BDL**
(98.4)
(96.6)
regression equation of metribuzin residues in soil
90
0.014
±
0.01
BDL
BDL
Slope
half
(97.8)
Correlation Regression
Treatments
of
life
coefficient
equation
120
0.007
±
0.05
BDL
BDL
curve
days
(98.9)
Metribuzin
Y= -0.020x
0.020
15.0
0.91
0.25 kg. ha -1
+ 2.063
*Values in parenthesis corresponds to% dissipation
**BDL–Below detectable level
Metribuzin
Y= -0.022x
0.022
13.7
0.95
0.50 kg. ha -1
+ 2.327
Inȱgeneral,ȱrapidȱlossȱofȱherbicideȱappliedȱatȱdifferentȱ
Metribuzin
Y= -0.016x
ratesȱ i.e.ȱ 0.25,ȱ 0.50ȱ andȱ 1.00ȱ kg.ȱ ha -1 ȱ wasȱ noticedȱ
0.016
18.8
0.96
1.00 kg. ha -1
+ 2.624
inȱ initialȱ 30ȱ days.ȱAsȱ theȱ periodȱ ofȱ initialȱ 30ȱ daysȱ
experiencedȱhighȱrainfallȱ(191.2ȱmM)ȱitȱisȱquiteȱlikelyȱ
Theȱcorrelationȱcoefficientȱforȱallȱappliedȱdosesȱi.e.ȱ
thatȱmetribuzinȱmightȱhaveȱleachedȱdownȱorȱwashedȱ
metribuzinȱ 0.25ȱ kg.ȱ ha -1 ,ȱ metribuzinȱ 0.50ȱ kg.ha -1 ,ȱ
offȱdueȱtoȱrains.ȱSimilarȱresultsȱbyȱ(Sondhiaȱ2005)ȱofȱ
metribuzinȱ 1.00ȱ kg.ȱ ha -1 ȱ wereȱ 0.91,ȱ 0.95ȱ andȱ 0.96ȱ
theȱrapidȱdissipationȱofȱmetribuzinȱunderȱirrigatedȱ
respectivelyȱ indicatingȱ perfectȱ fit.ȱ Asȱ timeȱ vsȱ logȱ
potatoȱproductionȱinȱsandyȱloamȱsoilȱduringȱinitialȱ
residuesȱ plotȱ isȱ linear,ȱ dissipationȱ followedȱ firstȱ
10-15ȱdaysȱinȱaȱstudyȱledȱtoȱinferȱthatȱleachingȱisȱanȱ
orderȱkineticsȱreaction.ȱTheseȱfindingsȱareȱinȱdirectȱ
importantȱdissipationȱpathwayȱforȱmetribuzin.
conformityȱ withȱ severalȱ otherȱ workersȱ (Burgardȱ et
al. 1994,ȱWorkmanȱ et al. 1995,ȱGynorȱ et al. 1998).ȱTheȱ
Theȱlogarithmicȱplotsȱofȱherbicideȱresiduesȱvsȱtimeȱ
valuesȱforȱtheȱhalfȱlifeȱofȱmetribuzinȱ0.25,ȱ0.50ȱandȱ
hasȱbeenȱillustratedȱinȱFigureȱ1.ȱTheseȱplotsȱindicatedȱ
1.00ȱ kg.ȱ ha -1 ȱ rangedȱ fromȱ 13.7-18.8ȱ daysȱ andȱ wereȱ
thatȱdissipationȱofȱmetribuzinȱatȱallȱthreeȱlevelsȱofȱ
inȱ directȱ conformityȱ withȱ findingsȱ ofȱ severalȱ otherȱ
workersȱ(Savageȱ1977,ȱJohnsonȱ2001).
453