Genetic diversity analysis and RAPD marker
m v-1 mL P1
P20 m
(a)
m P21
P42 m
(b)
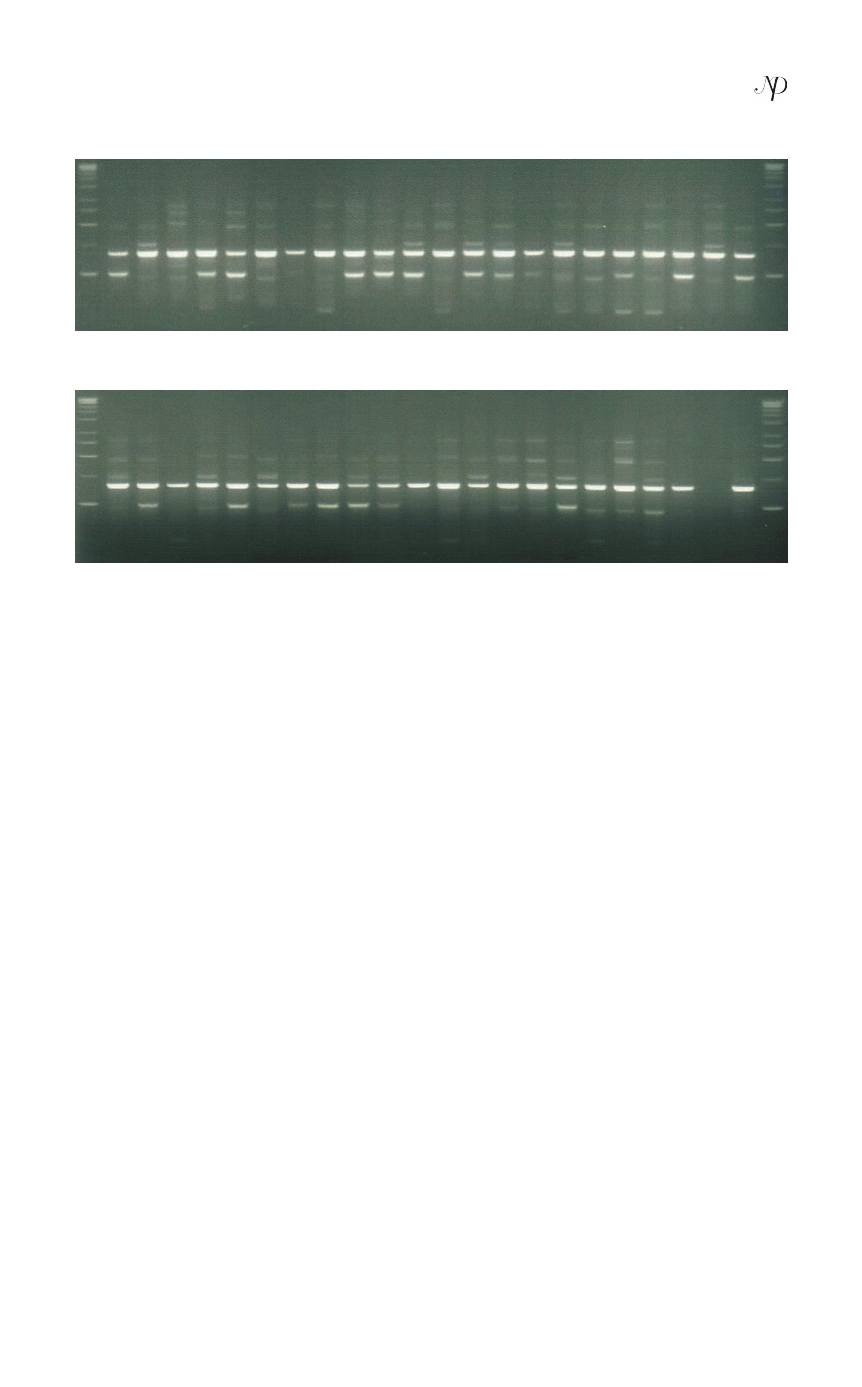
fig. 1: RaPD marker inheritance pattern in mysore Local (mL) x v-1 cross. (a)
Inheritance pattern in progenies (P1 – P42) using oPa-01 and (b) Inheritance
pattern in progenies (P1 – P42) using oPa-07. m is the kilobase DNa marker.
with nutritionally superior leaf and respond very well to agronomical inputs. Of
the about 200 seeds raised from the cross, 57 progenies were finally survived and
transplanted in a small plots. Forty-two progenies were found suitable with respect
to their growth and availability of the leaf material for DNA extraction. Mysore
Local has light green leaf compared to the deep green colour of V-1. Among the
progenies, 10 showed light green leaf colour, 14 showed intermediately green
colour and 18 showed deep green colour as in V-1. Similarily, the character
inheritance with respect to lobation type, leaf margin and phyllotaxy (Table 3).
However, these characters were recorded in the young plants (juvenile stage),
which need to be observed again when the plants reach correct stage of maturity.
RAPD analysis was carried out using five Operon primers. All the RAPD
reactions were performed twice and only reproducible bands in the range of 500
to 3500 bp were considered for scoring. A total of 33 amplicons were generated
of which 20 were monomorphic and rests 13 were polymorphic (33.33%) (Table
1). The RAPD amplification profiles of V-1, Mysore Local and F 1 progenies was
carried out using primers OPA-01, OPA-02, OPA-03 and OPA-07 (Figure 1). Out
of the 13 polymorphic markers 12 were considered for segregation analysis, as
the markers under consideration were present in either one of the parents or in
both. The segregation pattern of RAPD markers of Mysore Local x V-1 cross F 1
progenies showed expected Mendelian pattern of inheritance (3:1 ratio) in 3 RAPD
Int. J. Bioinformatics and Biological Sci.: v.2 n.1&2, p. 23-39. March & June 2014
31