Singh et al.
Figure 3
Figure 4
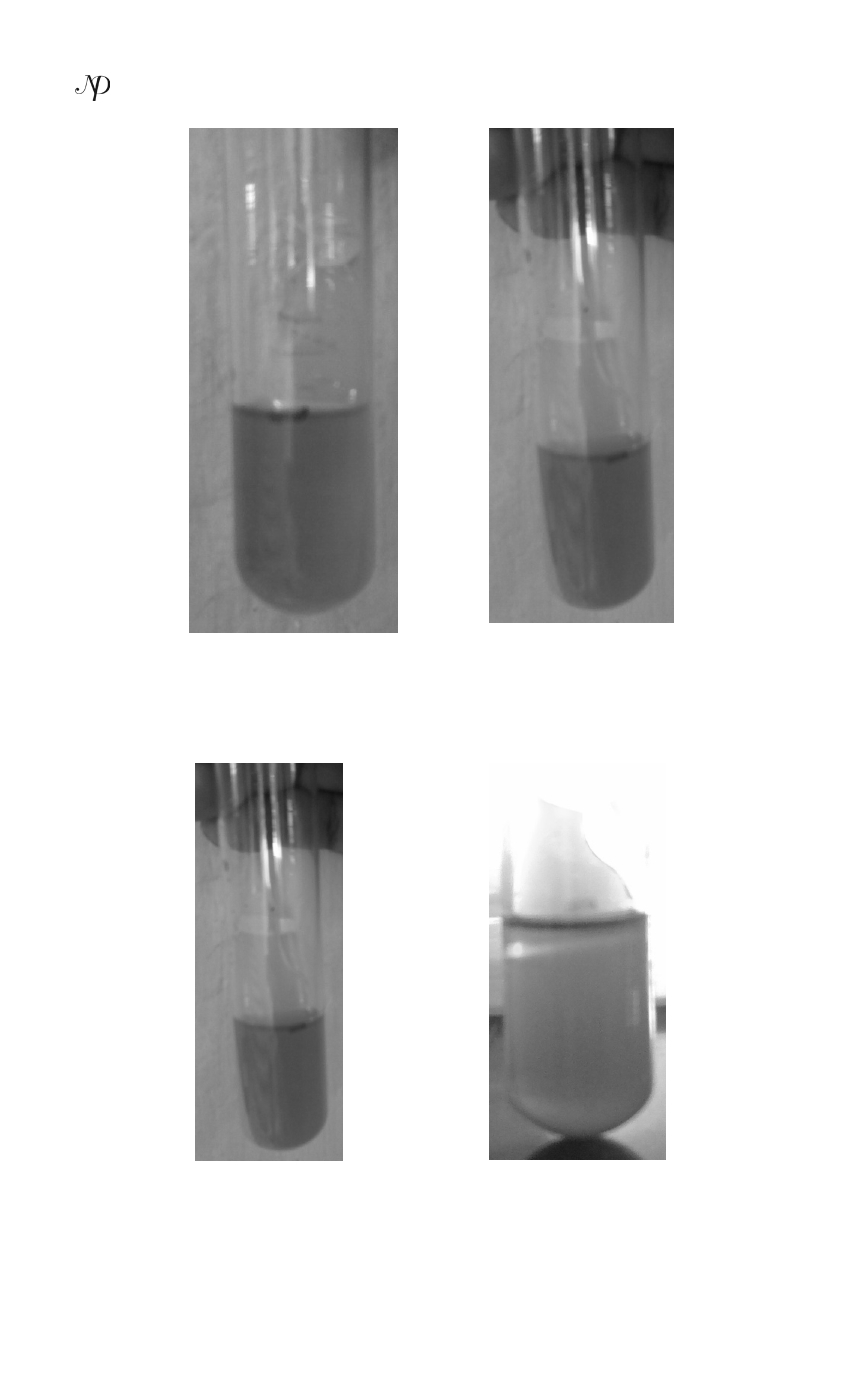
Figure 5 and figure 6 represents the oil degradation observed in both the cultures
from sample 1.
Figure 5
Figure 6
Figure 7 and figure 8 shows the initial oil content in both cultures from sample 2.
194
International Journal of Bioinformatics and Biological Sciences : v.2 n.3&4. Dec. 2014