Comparative Evaluation of Different Lactation Curve Models
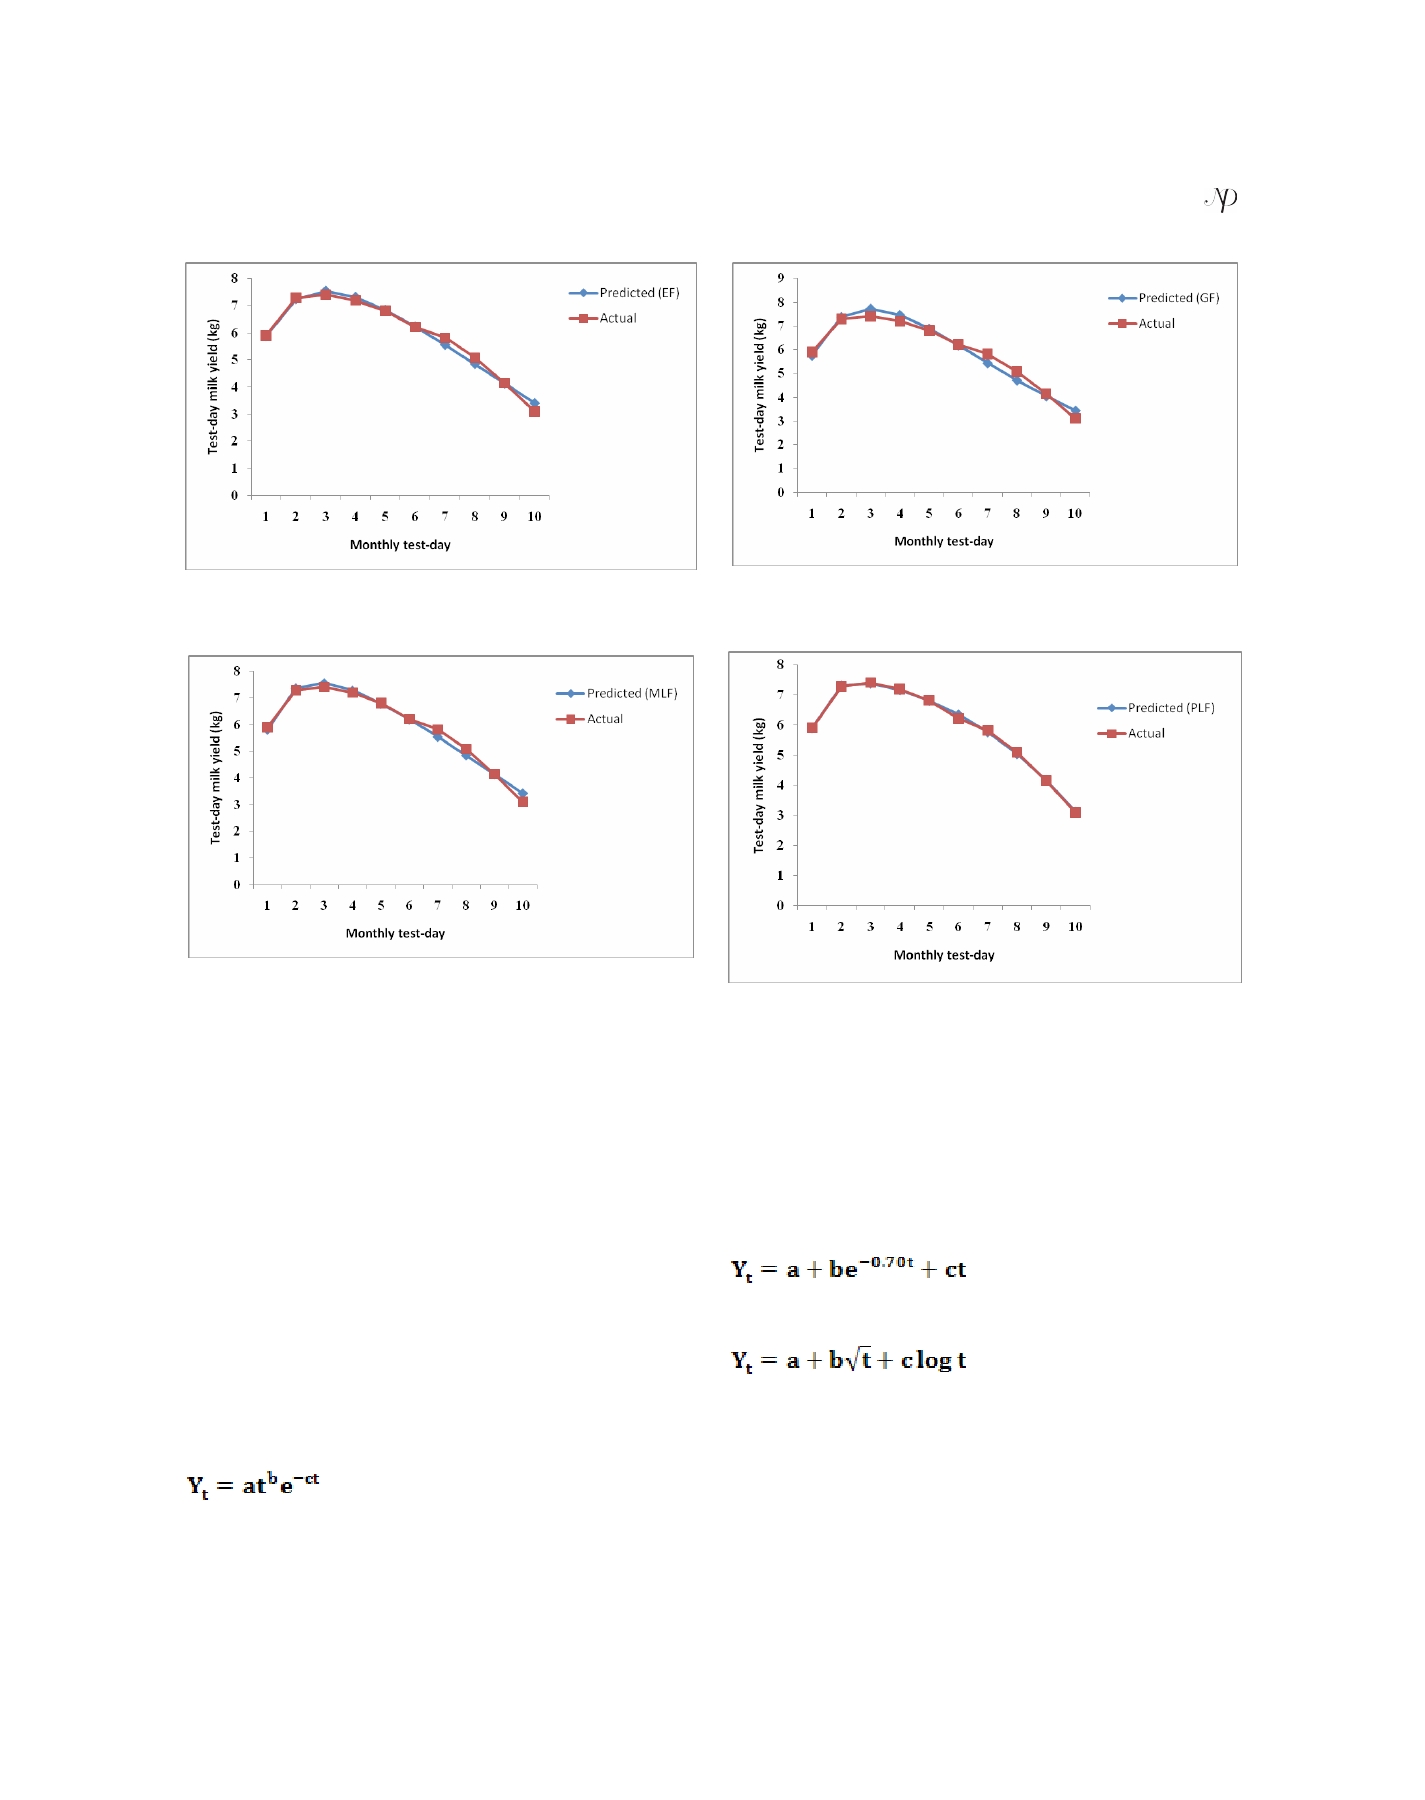
Figure 1. The observed and predicted MTDMYs from the
Figure 3. Observed and predicted MTDMYs from the
exponential function.
gamma function.
Figure 2. The observed and predicted MTDMYs from the
mixed log function.
Figure 4. The observed and predicted MTDMYs from the
polynomial regression function.
outliers were removed and data within the range of mean
In its logarithmic form, this reduces to ln(Y t ) = ln(a) +
± 3SD were considered for study.
bln(t) – ct
2. Exponential function (Catillo, 2002)
Lactation Curve Models
A total of 10 monthly test-day milk yield records (15 th
day, 45 th day,…, 285th day) were taken at an interval of
3. Mixed log function (Guo and Swalve, 1995)
30 days. The data were used to estimate lactation curve
parameters for the following four lactation curve models;
1. Gamma-type function (Wood, 1967)
In the models, Y t = average daily yield in the t th test
day of lactation; a = initial milk yield just after calving;
b= ascending slope parameter up to the peak yield; c =
descending slope parameter and t = length of time since
calving.
Journal of Animal Research: v.5 n.1. April 2015
191