Economic Affairs, Vol. 64, No. 4, pp. 695-702, December 2019
DOI: 10.30954/0424-2513.4.2019.3
©2019 EA. All rights reserved
Economic Development and Female Labour Force Participation in Tamil Nadu: A Test of the ‘U’ Shape Hypothesis
S. Sundari
Department of Economics, Mother Teresa Women’s University (A State University), Kodaikanal, Tamil Nadu, India
Corresponding author: sundarimtwu@yahoo.co.in (ORCID ID: 0000-0001-5147-9566)
Received: 18-06-2019
Revised: 11-10-2019
Accepted: 28-11-2019
ABSTRACT
This paper analyses the trends and pattern of women’s employment in the state of Tamil Nadu and its districts in order to find out the applicability of the “U” curve shape of female labour supply using NSSO and census data on employment for the period 1983 to 2018. Top five and bottom five districts on the basis of district level per capita income and female literacy are selected as sample districts. The results show that there has been a significant growth in GSDP of the state during 1983 and 2018, but there is no corresponding improvement in female work participation rates. Women’s employment has fallen particularly during the period 2011 and 2018 and rural areas have registered a greater withdrawal of women from workforce. The “U” curve hypothesis does not find empirical evidence and support in the case of Tamil Nadu. Strong negative effect of income and weak substitution effect of expansion of female education and lack of job opportunities have contributed towards an inverted “U” curve. If suitable measures are not taken to improve female labour market participation, then Tamil Nadu cannot harvest the benefits of demographic dividend.
Highlights
 “U” curve supply of female labour finds no applicability in Tamil Nadu.
Women’s employment is sluggish in the state despite growth in GSDP and spread of female literacy, which is likely to deter not only women’s empowerment but also the growth of the state economy in the long run.
Keywords: Work participation rate, economic development, “U” curve, per capita income, literacy.
Employment of women is considered as a measure of women’s economic empowerment and is also an important indicator of women’s contribution to economic development. Labour market participation by the women of India is showing a downward movement in the last few decades. According to India Spend report (2016) “India ranks last among BRICS countries and stands second last behind Saudi Arabia among G-20 countries in women’s labour force participation and within South Asia, India has the lowest rate of female employment next to Pakistan”. This falling trend has serious implication for the economy because the current demographic structure seems to be favourable to India. India has the largest number of young working population in the age group of 15- 34 years, and is considered as the youngest country in the world today. The benefits of the demographic dividend cannot be realised if women, who constitute nearly 50 percent of the population, are out of the labour market. Data from National Sample Survey Organization (NSSO) shows that female work participation rate (FWPR) in India had dropped from 29.6 percent in 1983 to 21.9 percent in 2011-12 and further to 16.5 percent in 2017-18. The withdrawal is all the more surprising as it has occurred during a period of sharp rise in wages of women workers (Chaudhary and Verick, 2014); decline in fertility rates from 3.9 in 1990 to 2.6 in 2011 (UNFPA, 2018) and when India was experiencing high average annual GDP growth of eight percent (World Bank, 2012). Further it is puzzling to the researchers to note the downward trend in FWPR in India when the largest employment generation programme viz., Mahatma Gandhi National Rural Employment Guarantee Act (MGNREGA) was being successfully implemented in the country with greater participation of women. The primary objective of this paper is to look at the growth – employment relationship and also find out the relevance of “U” shape curve of female labour supply in Tamil Nadu.
How to cite this article: Sundari, S. (2019). Economic development and female labour force participation in Tamil Nadu: A test of the ‘U’ shape hypothesis. Economic Affairs, 64(4): 695-702.
REVIEW OF LITERATURE
Previous studies point out that most countries often experience a decline in female labour force participation (FLFP) with economic development initially and as the economy develops further, more women enter the labour market. “U” shape curve in the supply of female labour is owing to “structural shifts in the economy, changing influence of income and substitution effects and increasing education levels of women” (Goldin, 1994). The U-shape female labour force supply shows that at low levels of income when agriculture is the dominant form of economic activity there is greater supply of women labour force often as unpaid family workers on the family farm or business. With development in process, economic activity shifts from home-based production to market oriented activities. As incomes increases, women withdraw from the labour force initially and as women’s education expands and with simultaneous rise in their wages, their participation increases. The falling portion of the curve is due to income effect and the rising portion of the curve is owing to substitution effect. The Indian experience is very different. U-shaped curve of women’s labour supply does not exist in India (Lahoti and Swaminathan, 2013). Studies have identified the following four factors as the cause of declining trend in women’s employment in India despite economic growth, increase in female literacy and decline in fertility. i) Increasing attendance in educational institutions; ii) Increased household income iii) Measurement fallacy related to unpaid work of women and iv) Lack of job opportunities for women (Afridi et al. 2016; Mehrotra, 2015; and Chatterjee et al. 2015;). According to a recent study, changes in cropping pattern and mechanization of agriculture has resulted in the decline of female work force particularly in rural Punjab ( Singh and Goyal, 2019). There is very limited research carried out in the Indian context using State level data. A disaggregated approach is imperative to understand the regional and local trends and patterns in FLFP. To fill this research gap, the present paper is designed to explore the relationship between female labour supply and economic development measured in terms of GSDP and also female literacy using state and district level data. Further a study of women’s employment scenario is necessary as a “demographic dividend” is at its peak at the moment in Tamil Nadu i.e. high proportion of population are in the 15 to 60 age group in total population. Hence this opportunity should be made use of at the earliest and the fruits of development emanating from this have to be reaped ( Tamil Nadu Human Development Report, 2017).
Objectives of the Study
1.To study the trends in female work participation rate in Tamil Nadu and also in high and low per capita income districts of the state;
2.To test the applicability of “U” curve hypothesis of female labour supply by analysing the relationship between economic development measured in terms of GSDP growth and women’s employment; and
3.To examine the relationship between the female literacy and female work participation rate in the districts of Tamil Nadu state.
Hypotheses
1.There is no significant difference in work participation rate of women between the districts with high and low per capita income and also between the districts with high and low female literacy rates.
2.There is a U-shaped relationship between: (i) Female labour force participation rate and GSDP, (ii) Per capita income and female work force participation rates and (iii) Female literacy and work participation rates of women.
MATERIALS AND METHODS
The primary data source for this paper is NSSO (38th to 68th rounds), Periodic Labour Force Survey (2017-18) and Census. Other data sources are also used to supplement the arguments. While the state level data on female employment and GSDP of Tamil Nadu relates to the period 1983 to 2018, the district level data is confined to 2011 census. The study covers all the 32 districts in the state as population and top five (rich) and bottom five (poor) districts are selected as sample districts based on district level per capita income for the year 2011 (See table 2). Similarly top five and bottom five districts are selected as sample districts of the state based on district level female literacy as per 2011 Census (See table 4). t-test and compound annual growth rates are used along with descriptive statistics for data analysis.
RESULTS AND DISCUSSION
Female work participation rate (FWPR) is defined as the percentage of female engaged in the total working population of a state or country. It includes persons who are also engaged in any economic activity as unpaid helpers in the household farm or non-farm activities (Census, 2011 and NSS, 2011-12). An examination of WPR of women by usual status (principal and subsidiary workers) in Tamil Nadu reveals that the FWPR has declined over time from 38 percent to 35 percent between the period 1983 and 2004-05. The WPR of women has almost remained stagnant at 30 percent during 2009-10 and 2011-12 and has declined to 25 percent in 2017-18. Highest FWPR is recorded in 1983 (37.6%) and least in 2017-18. The rate of increase in FWPR is relatively higher during the period 1999-2000 and 2004-05 by 2.8 percentage points and the decline in FWPR is remarkable between the period 2004-05 and 2009 -10 and also during 2011-12 and 2017-18. (5 percentage points). No major changes are seen in the WPR of men which varies between 58 and 59 percent over the period except for the significant fall by 7.2 percentage points in 1987-88 and by 3 percentage points in 2017-18 (Refer table 1).
Rural women of Tamil Nadu display a higher WPR than their urban counterparts. Greater participation by rural women makes it explicit that the economic pressure to work is more among rural than urban women. It should be noted here that there exists a large difference in the WPR of males and females in Tamil Nadu, which is an important aspect of gender inequality. For the state the gender gap is 31.1 percentage points as per 2017-18 data and the gap has been narrowed just by 4.2 percentage points over the period 1983-2018. The gender gaps are more pronounced in urban than rural Tamil Nadu.
Female labour force participation rate in high and low per capita income districts
Table 2 maps the trends in female WPR across rich and poor districts. According to 2011 Census, the highest rate of FWP is seen in Perambalur district (48%) and the least work participation rate of women is found in Kanniyakumari district (16%). Overall, out of 32 districts, in 14 districts FWPR is much below the state average of 31.8 percent.
Table 1: Work Participation Rate in Tamil Nadu by Gender and Region
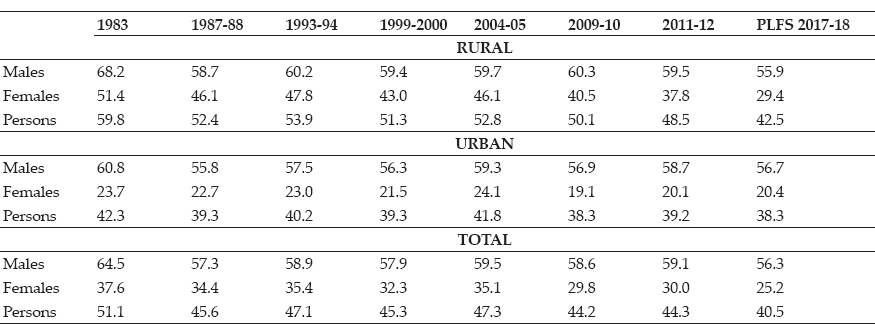
Source: NSSO. Employment and Unemployment in India. 38th to 68th Rounds, 1983 – 2011-12, New Delhi: Ministry of Statistics and Programme Implementation, Government of India and Periodic Labour Force Survey (PLFS). 2017-18, New Delhi: Ministry of Statistics and Programme Implementation, Government of India.
Table 2: Female Work Participation Rate in Sample High and Low Per Capita Income Districts of Tamil Nadu (2011)
| Districts |
Total |
Rural |
Urban |
| Top five districts with high per capita income |
|
|
|
| Kanniyakumari |
16.4 |
18.4 |
16.0 |
| Kancheepuram |
24.8 |
33.6 |
19.7 |
| Tiruppur* |
36.2 |
47.2 |
29.2 |
| Virudhunagar |
38.1 |
46.7 |
29.6 |
| Thiruvallur |
23.5 |
33.6 |
18.0 |
| Bottom five districts with low per capita income |
|
|
|
| Ariyalur |
38.7 |
41.1 |
20.2 |
| Perambalur |
48.4 |
52.6 |
28.3 |
| Thiruvarur |
26.7 |
30.0 |
14.2 |
| Viluppuram |
39.9 |
43.8 |
18.2 |
| Theni |
35.9 |
46.1 |
27.3 |
Source: Census of India, Tamil Nadu Series, 2011.
Perambalur district is the poorest district in the state and stands second position among the bottom five districts on the basis of per capita income and this district shows the highest percentage of women in the labour market (48 %). Kanniyakumari district ranks first in per capita income and in female literacy but it records the lowest female labour force participation in the state. Besides Kanniyakumari district, lowest female labour force participation rate of less than 25 percent is seen in Thiruvallur districts which occupies 5th position in top 5 districts of the state in per capita income. It is interesting to note that districts such as Tiruppur and Virudhunagar, falling under top five in per capita income accounts for over 36 percent of women in paid labour force. Overall it is seen that the mean WPR of women of top five high per capita income districts (27.8 %) is much below the mean WPR of women of the bottom five low per capita income districts (37.9%). Thus poorer districts account for higher female WPR than the rich districts which is supported by the results of t-test (See Appendix 1).
Comparing the WPR of women in the rural areas of high and low per capita income districts it is noted that the women’s employment is higher in low income districts (42.7%) than the top five rich districts in per capita income (35.9%). However in the urban areas of rich and poor districts the work participation rates of women are almost the same (22 %). The results of t-test based on disaggregation of data by region suggest the acceptance of null hypothesis that there is no significant difference in the mean FWPR of rich and poor districts both in rural and urban areas (See Appendix 1).
Test of U Hypothesis
In this study economic development of the state of Tamil Nadu is measured in terms of the growth in Gross State Domestic Product (GSDP) and per capita income at the district level. GSDP is defined as a measure in monetary terms, of the volume of all goods and services produced within the boundaries of the state during a given period of time, accounted without duplication (https://data.gov.in/keywords/gross-state-domestic-product). There has been dramatic improvement in the growth of GSDP in Tamil Nadu from ₹ 55034 crores in 1983-84 to ₹ 842764 crores in 2017-18 indicating a compound annual growth rate of 8.36 percent over time. However there is no corresponding improvement in the labour market participation of women which has recorded a negative growth rate of 1.2 percent during this period indicating a lesser impact of development on women’s WPR (See table 3).
Table 3: GSDP (at Constant Prices 2004-05) and Growth Rates in FWP in Tamil Nadu
| Period |
GSDP ₹ in crores |
CAGR in GSDP |
CAGR in Female WPR |
|
|
|
Total |
Rural |
Urban |
| 1983-84 |
55034 |
— |
— |
— |
— |
| 1987-88 |
84153 |
11.20 |
-2.20 |
-2.68 |
-1.07 |
| 1993-1994 |
122069 |
6.40 |
0.48 |
0.61 |
0.22 |
| 1999-2000 |
179094 |
6.60 |
-1.52 |
-1.75 |
-1.12 |
| 2004-2005 |
219003 |
4.11 |
1.68 |
1.40 |
2.31 |
| 2009-2010 |
356630 |
10.24 |
-3.22 |
-2.56 |
-4.54 |
| 2011-2012 |
433238 |
10.22 |
0.34 |
-3.39 |
2.58 |
| 2017-18 |
842764 |
11.73 |
-2.86 |
-4.10 |
0.25 |
| CAGR |
|
|
|
|
|
| (1983-2018) |
|
8.36 |
-1.17 |
-1.63 |
-0.44 |
CAGR – Compound Annual Growth Rate computed by the author.
Source: NITI Aayog, State Statistics, niti.gov.in/content/state-statistics.
When GSDP recorded a growth of 11 percent between 1983-84 and 1987-88, the participation of women in paid work declined by 2.2 percent. With decline in GSDP growth in the subsequent periods (6.4 %) there was only a marginal increase in female WPR (0.5%) in 1993-94 and significant increase in 2004-05 (1.68%). When GSDP registered a growth rate of over 11 percent in 2017-18, FWPR recorded a negative growth rate of 2.86 percent. Thus a study of aggregated data suggests that “U” curve hypothesis has no applicability for Tamil Nadu. Rural Tamil Nadu has recorded the largest decline in FWPR particularly from 2009-10 onwards with growth in GSDP. Urban scenario seems to be relatively better. The inverted “U” curves observed in Fig. 1 suggest that there is no corresponding improvement in female WPR both in rural and urban areas with growth in GSDP. These trends and patterns raises the question whether the state is experiencing jobless growth.
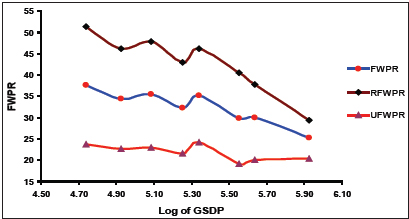
Fig. 1: GSDP and FWPR in Tamil Nadu
These results are supported by the disaggregated data at the district level of Tamil Nadu. An examination of per capita income and female WPR at the district level for the period 2011 clearly shows an inverted “U” shape curve of female labour supply which may be due to the income effect – that is at the higher levels of income, women withdraw from the labour force (See Fig. 2).
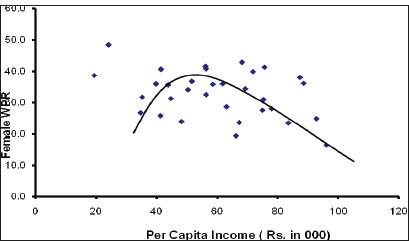
Fig. 2: Per Capita Income and Female WPR in Tamil Nadu
Well developed districts viz. Kanniyakumari, Chennai, Thiruvallur, Kancheepuram and Coimbatore in terms of industrialization, urbanization, District GDP, per capita income and higher levels of female literacy account for the least WPR of women workers (less than 25 percent). The poor, backward and agro based districts viz. Ariyalur, Perambalur, Villupuram, Tiruvanamalai, and Dindigul with lower levels of per capita income and female literacy display higher FWPR of over 40 percent. So, it may be inferred that economic necessity is the prime push factor of women’s entry into the labour market in Tamil Nadu.
Appendix 1: Results of t-tests
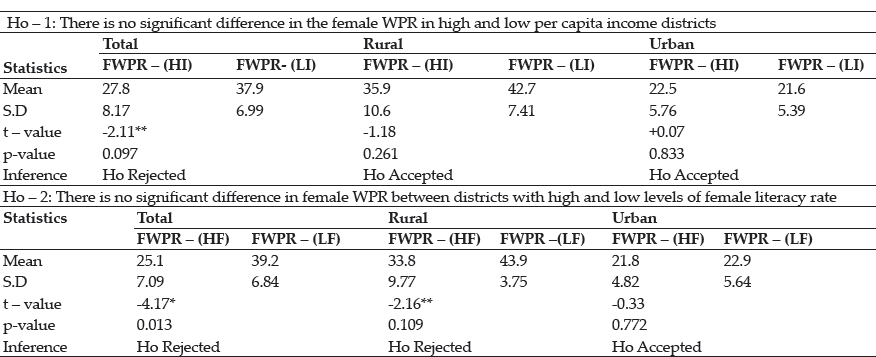
* - significant at 1 % level, ** - significant at 5 % level; Computed by the author.
Linking per capita income and WPR of women in rural areas an inverted U shape curve is noticed signifying that there is no “U” shape curve of female labour supply. In the case of urban areas also “U” curve has no applicability. Thus an analysis of disaggregated data at the district level leads to the conclusion that “U” curve hypothesis does not hold good for both rural and urban Tamil Nadu because of strong negative effect of income on women’s entry into paid work.
Female work participation rate and female literacy
Education is considered to be one of the key determinants of women entering the labour market. Education enhances the job prospects for women by raising their skills and productivity. Education also has an indirect effect on female WPR through reduction in fertility rates. The overall literacy rate of women has improved remarkably from 40 percent in 1981 to 73 percent in 2011 (Census) that is by about 33 percentage points, and there has been no corresponding improvement in the entry of women into work force which has increased just by 5 percentage points during the period. It is interesting to note that Kanniyakumari district while recording the lowest female WPR in the decades of 2001 (12.7%) and 2011(16.4%), shows the highest female literacy rates both in 2001 (84.8%) and 2011 (89.9%) in the state. While female literacy in Kanniyakumari district increased by 5 percentage points, FWPR has increased by 3 percentage points, indicating a positive association between education and FWPR (See table 4). A similar pattern is seen in the case of Chennai, a metropolitan city that occupies a second place in top 5 districts in female literacy.
Coimbatore and Nilgiri districts falling under top 5 in female literacy in 2001 and 2011, show that while female literacy increased by 7 to 10 percentage points, female WPR dipped in Coimbatore (0.7 percentage points) and has actually increased in Nilgiri district by 1 percentage point during the decades. Thus in these districts a varied pattern of decline in female WPR is noted that does not match the spread of women’s education.
A different trend is seen in the case of districts falling under bottom 5 in female literacy. Female literacy in these districts increased by more than 10 percentage points for the period 2001 and 2011, but female work participation rate declined by 1 to 3 percentage points in Ariyalur and Perambalur districts while it increased by 1 percentage point in Dharmapuri, Villupuram, and Thiruvanamali districts. Thus overall it may be inferred that though there has been significant improvement in the female literacy rate invariably in all the districts of the state, simultaneously there is a reduction in the proportion of female workers in 16 out of 30 districts during 2001 -2011. Thus the increase in female literacy has failed to be associated with improvement in female WPR in the districts of Tamil Nadu.
Examining the rural and urban trend in female literacy and their WPR in Tamil Nadu, it is seen that for the state as a whole rural female literacy has expanded by 10 percentage points and at the same time rural female work participation rate has declined marginally by 0.2 percentage points during 2001 and 2011. Improvement in urban literacy rate (15.8 percentage points) has been during the period 2001 and 2011, has been associated with 2.9 percentage points increase in FWPR in urban Tamil Nadu. The results of t-test in this context indicate that there is no significant difference in female WPR between top 5 and bottom 5 districts ranked on the basis of female literacy rate in urban areas and in rural areas significant difference exists in the WPR of women in high and low literate districts (See Appendix I).
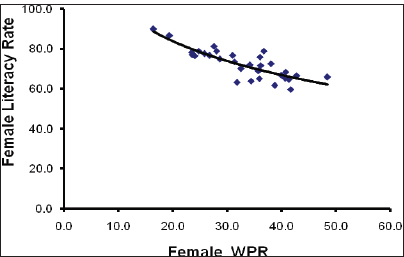
Fig. 3: Female Literacy and Female WPR in Tamil Nadu
Fig. 3 illustrates a downward movement between female WPR and female literacy rates in the districts of Tamil Nadu, indicating that the Goldin hypothesis of “U” curve shape of female labour supply does not find empirical evidence and support for Tamil Nadu. In rural areas there is a steeper downward movement and in urban areas there is no significant improvement.
Table 4: Female literacy rate in top five and bottom five districts in Tamil Nadu
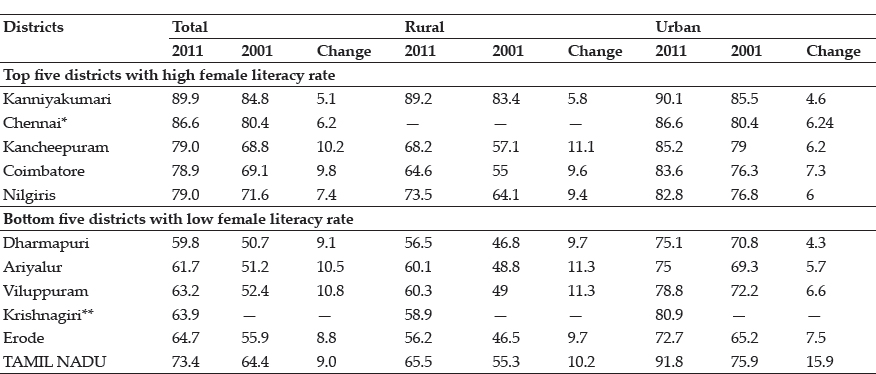
*- Chennai is a metropolitan city, ** - district formed in 2004
Source: Census of India, Tamil Nadu Series, 2011.and 2001.
Why there is no U curve supply of female labour in Tamil Nadu despite economic growth?
The following factors are likely to explain the phenomenon:
1. Negative Income effect
2. Weak substitution effect
3. High levels of unemployment
There seems to be a negative impact of income on female employment. Higher the income, lower the FWPR as women prefer domestic to paid work. Substitution effect of increase in women’s education would directly enhance their work participation seems to be weak in the case of Tamil Nadu. The effect of education on female employment is not simple and direct which implies that higher level of female literacy do not necessarily result in higher work participation of women. Education specific FWPR is likely to explain this phenomenon. WPR is higher among the illiterate women and also among women with University degrees than women with middle, secondary and higher secondary level of education in rural as well as urban areas. Women of poorer households tend to work out of necessity and women with higher levels of education and of higher income groups also prefer work outside home as they can afford to hire domestic help. It is the middle educated women of middle class that withdraws from the labour force with increase in household income (See Fig. 4).
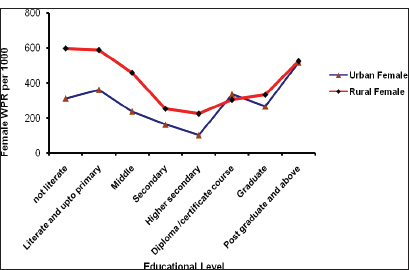
Fig. 4: Education Level WPR of Women in Tamil Nadu (Age 15+)
Bhalla and Kaur (2013) point out that there is depressing effect of the emerging middle class on FWPR in India. A positive trend noted in this context is that while the WPR among the illiterate women is declining it is increasing for women with graduation and above qualifications. Rural women experience greater unemployment of over 10 percent over the decades (1993-93 and 2011-12) than urban women. So it may be concluded that the downward shift in rural women’s employment is largely owing to lack of farm and non farm rural jobs.
CONCLUSION
“U” curve hypothesis does not find empirical evidence and support in the case of Tamil Nadu. With economic development, with growth in GSDP, with an increase in per capita income and spread of female literacy, women’s employment in Tamil Nadu has declined to 25 percent in 2017-18. Strong negative income effect and weak substitution effect has resulted in an inverted “U” curve of female labour supply. Further, lack of employment opportunities in the rural sector has contributed towards a decline in rural women’s WPR. If suitable measures are not taken to improve the female labour force participation rates, then further increase in GSDP / per capita income is likely to bring a dramatic fall in the female WPR in Tamil Nadu. Participation of women in the labour force is of utmost importance not only to accomplish the full benefits of demographic dividend and overall economic growth but also for women empowerment.
ACKNOWLEDGEMENTS
I wish to thank Indian Council of Social Science Research, New Delhi for providing me financial assistance in the form of Senior Fellowship and also Mother Teresa Women’s University, Kodaikanal for permitting me to work on this project entitled “Structural Changes in the Labour Market and Female Labour Force Participation in India: Theoretical Models, Empirical Evidence And Policy Implications”.
REFERENCES
Afridi, F. Dinkelman, T. and Mahajan, K. 2016. Why are Fewer Married Women Joining the Work Force in India? A Decomposition Analysis over Two Decades. Discussion Paper No. 9722, Bonn: Institute for Labour Study, Retrieved from http://ftp.iza.org/dp9722.pdf.
Bhalla, S. and Kaur, R. 2013. Labour Force Participation of Women in India: Some Facts, Some Queries. Working Paper No. 40. Asia Research Centre, London: London School of Economics and Political Science. Retrieved from https://eprints.lse.ac.uk/38367/ARCWP40-BhallaKaur.pdf.
Chatterjee, U. Murgai, R. and Rama, M. 2015. Job Opportunities along the Rural – Urban Gradation and Female Labour Force Participation in India. Working Paper No. 7412, World Bank, Policy Research, Retrieved from http://econ.worldbank.org.
Chaudhary, R. and Verick, S. 2014. Female Labour Force Participation in India and Beyond. ILO Asia Pacific Working Paper Series, Retrieved from https://www.ilo.org/wcmsp5/groups/---asia/---ro-bangkok/---sro-new_delhi/documents/publication/wcms_324621
Goldin, C. 1994. The U-shaped Female Labour Force Function in Economic Development and Economic History. Working Paper No. 4707. Cambridge, MA: National Bureau of Economic Research. Retrieved from http://www.nber.org/papers/w4707.
Government of India. 1981 to 2011. Census of India, Tamil Nadu Series. New Delhi. Ministry of Home Affairs.
Government of Tamil Nadu. Tamil Nadu Human Development Report 2017. State Planning Commission, Chennai.
India Spend Report. 2016. Retrieved from https://archive. indiaspend.com/cover- story/rising-income-levels-stbility-linked-to-declining-female-workforce-participation-in-india-84594.
Lahoti, R. and Swaminathan, H. 2013. Economic Growth and Female Labour Force Participation in India. Working Paper No.414, Bangalore: Indian Institute of Management.
Mehrotra., S. 2015.Why the Female Labor Force Participation is Low and Falling? Retrieved from https://www.researchgate.net/publication/29515719,doi:10.13140/R.2.1.4047.9841.
NSSO. Employment and Unemployment in India. 38th to 68th Rounds, 1983 – 2011-12, New Delhi: Ministry of Statistics and Programme Implementation, Government of India.
Periodic Labour Force Survey. 2017-18, New Delhi: Ministry of Statistics and Programme Implementation, Government of India.
Singh, J. and Goyal. K. 2019. Employment Status of Women in Rural Punjab: Dwindling Trends. Economic Affairs, 64(2): 281-290.
UNFPA. 2018. The State of World Population 2018. United Nations Population Fund.
Retrieved from https://www.unfpa.org/press/state-world-population-2018.
World Bank. 2012. World Development Report: Gender Equality and Development. Retrieved from https://siteresources.worldbank.org.