Economic Affairs, Vol. 64, No. 4, pp. 703-710, December 2019
DOI: 10.30954/0424-2513.4.2019.4
©2019 EA. All rights reserved
Gold vs Gold Exchange Traded Funds: An Empirical Study in India
Sathish Kumar, B.*1 and Ram Raj, G.2
1Department of Commerce, Christ (Deemed to be University), Bengaluru, India
2Department of Commerce CA, VHNSN College, Virudhunagar, Tamil Nadu, India
*Corresponding author: sathish.kumar@christuniversity.in (ORCID ID: 0000-0002-2292-842X)
Received: 05-07-2019
Revised: 02-10-2019
Accepted: 23-11-2019
ABSTRACT
This study aim of this is to estimate the relationship between gold and Gold Exchange Traded Fund (ETF) and the performance of Gold ETFs in India by using various statistical models. The data for the study covers a period of three years from 2015 to 2018. The data was collected from the National Stock Exchange database and other sources. The outcome of this study was to find out whether there is a relationship between gold and Gold ETFs. It was found out that Gold ETFs has more returns than the physical gold; Axis ETF performed the best among those Gold ETFs selected for the study. This study will be beneficial for the market researchers and investors who find the best opportunities in the Gold ETFs.
Highlights
 This study is filling the lights on the darkness of the Gold vs Gold Exchange Traded Funds with particular reference with the Indian market.
This study gives a clear idea regarding the performance evaluation of the Gold and Gold ETFs in India.
One of the exclusive feature of this study is that it looks into Risk and Return of Gold ETF in Indian markets
Keywords: Gold vs Gold ETFs, Sharpe’s Index, Treynor’s Index, Jensen’s Index, Fama’s Measure, Correlation
Finance is the study of how people apportion their resources over time in situations of both certainty and vagueness. Investment means that the act of deploying money in business with the aim of increasing profit over some time. Financial investment is putting money into something with anticipation of gain through analysis. It has a high degree of security for the principal amount as well as the safety of returns within an expected time period. Every investor has a different perception of the risk and returns of their investments. Some would like to generate higher returns, and they are ready to take any degree of risk. Few people don’t want to take the risk; they are sensible in their investment. In India, there are many investment avenues like Shares, Bonds, Debentures, T-Bill etc. In spite of various investment channels available, Indians prefer to invest in gold. The demand for physical gold is increasing year after year. Its demand increases in various forms like jewellery, gold coins and bars etc. (Mehrotra, 2004) Gold is one of the oldest and precious metals. India is one of the countries where is gold is considered as an auspicious gift. As per various studies, there are 16,000 tons of gold in India. But due to highly priced, small investors feel hard to make investments in gold. Therefore, to make investors have the possibility of investing in gold, the Gold Exchange Traded Fund (ETF) was launched. (Kaur & Singh, 2017) It was first announced in the United States of America in 1993. In India, the ETF scheme was introduced in 2007. ETFs is also available in other forms such as equity Index ETF, International Index ETF etc. Gold ETF is one of the investment funds in the stock exchange. It functions similar to mutual funds. Gold ETF are listed and traded in the stock exchanges like another instrument. They are traded at net asset values of its underlying assets. Gold ETF can be bought or sold online and held in demat account. These Gold ETF represent physical gold and its price move similar to physical gold. This research paper aims to examine the performance of Gold ETF about physical gold in India.
How to cite this article: Sathish, K.B. and Ram, R.G. (2019). Gold vs gold exchange traded funds: An empirical study in India. Economic Affairs, 64(4): 703-710.
REVIEW OF LITERATURE
An ample amount of research has been conducted in the field of Gold ETF. Some of them are referred to the review of the literature. (Ratner & Kelin, 2008) investigates the portfolio implication of gold investment. Study found that, an investor wants to spend their fund for long term purpose, then gold is the best avenue compare with buy and holding of US equities. The gold investment will give much more than marginal value.
(Pandey, 2010) Stated that Gold ETFs are buying and selling of electronic Gold. This is more convenience, safety and price effective than the typical physical form of gold. Moreover, it has some tax benefit also (Athma, Prashanta, & K, 2011). Revealed that Gold prices are less volatile compared to the equities market. The investors prefer to own gold because it was perceived to be a strong asset class. The investors also felt that it would diversify the portfolio risk.
(Kumar, Kumar, & Roy, 2012) Attempted to analyse the performance of Gold ETF concerning risk and return against the diversified equity fund and the market portfolio. Moreover, they examined the role of gold in hedging equity investment risk. This shows that the old ETF has given good return in comparison to a diversified equity fund during the study period (Barman, 2014).
This study about to describe the investor’s behavior towards gold investment in India. This study explains the various forms of gold investments and gold investment is giving more satisfaction to investors. Moreover, its socio-economic status, psyche behavior of investment, beliefs, and values, the lifestyle of the investor. (Gurgun & Unalmis, 2014) this study found that gold is the best safe haven investment and its hedge during the crisis period. During post-crisis period falls in the equity market become more severe, gold acts as a safe haven in a large set of countries.
(Narend, 2014) Empirically studied the performance of exchange-traded funds and index funds using tracking error, actual returns and Jensen’s Alphas. The study revealed that index funds had done better than ETFs. Regarding active returns, ETFs performed better. (Eswara, 2015) evaluated the performance of Gold ETF and found that ETF is better than a mutual fund in terms of return. It was also suggested that gold should be part of portfolio investment to hedge or mitigate the risk that arises due to market volatility. (Athma & Suchitra, 2017) found that the gold price is less volatile when compared to equity market which creates confidence among the investor believing as a strong asset to invest. (Anand, 2017) The analysis shows that upcoming Gold ETFs are heavily influenced by gold prices and therefore generates similar returns. Since the Gold ETF market is relatively new in India, they were not performing well. In the long run, Gold ETFs may provide the highest return. It is also expected to be a more attractive investment and good portfolio diversification.
(Mishra, 2018) this study reveals the benefits of gold investments and investors also consider few factors while investing their money which is the flexibility of payment mode, amount of investment, tax benefits, liquidity, principal safety, risk in return, expected return, etc.,(Jain & Mary, 2018) found that Gold ETF is a new investment avenue for retail investors in India. It is a more comfortable and convenient way of trading in gold. It is also found that it is a safe form of trading. Due to the scarcity of physical gold, investors prefer gold ETFs. However, the literature review reveals certain aspects of the existing body of research on the existence of Gold ETF. This study examines the relationship between physical gold and Gold ETF and its performance. (VR Nedunchezhian, 2012) has studied the financial performance of selected equity-linked savings schemes. He has applied various portfolio evaluation tools and ranked the schemes taken for research based on these evaluation measures. (Kumar S. 2019) has the risk and return of gold and selected gold ETF. He has found that there is a strong relationship between gold price and the performance of gold ETF.
Statement of the Problem
It was found from the literature review, in India, Gold ETFs have been launched with the objective to increase the liquidity of the portfolio of a retail investor. Indians prefer to buy gold and hold gold in physical form, so they do not prefer to invest in gold ETF. The price of Gold ETFs is determined by the underlying asset held in form of gold. In recent days, retailer investors investment in gold ETFs to a larger extent. The study aims to analyse the returns generated by Gold and Gold ETF.
Objective of the Study
♦To examine the risk and return of Gold Exchange Traded Funds
♦To investigate the financial performance of the Gold ETFs
♦To analyse the relationship between the price of Gold and Gold ETFs in India
Research Methodology
This Study was aimed at estimating the comparative performance of gold Vs Gold ETF in India. A total of thirteen exchange-traded funds based on gold are listed in National Stock Exchange of India. For the purpose of study ten gold exchange-traded fund which are presently traded are taken for the study. The selected gold exchange-traded fund for study are presented in table 1.
Table 1: List of Gold Exchange Traded Fund in India
| Issuer |
Name |
Symbol |
| Axis Mutual Fund |
Axis Gold ETF |
AXISGOLD |
| Birla Sun Life Mutual Fund |
Birla Sun Life Gold ETF |
BSLGOLDETF |
| UTI Mutual Fund |
UTI GOLD exchange Traded Fund |
GOLDSHARE |
| ICICI Prudential Mutual Fund |
ICICI Prudential Gold Exchange Traded Fund |
IPGETF |
| IDBI AMC |
IDBI Gold Exchange Traded Fund |
IDBIGOLD |
| Kotak Mutual Fund |
Kotak Gold Exchange Traded Fund |
KOTAKGOLD |
| Quantum Mutual Fund |
Quantum Gold Fund (an ETF) |
QGOLDHALF |
| Reliance Mutual Fund |
Reliance Exchange Traded Fund Gold BeES |
RELGOLD |
| HDFC Mutual Fund |
HDFC Gold Exchange Traded Fund |
HDFCMFGETF |
| SBI Mutual Fund |
SBI Gold Exchange Traded Scheme |
SBIGETS |
Source: Bombay Stock Exchange.
This study is empirical in nature and carried out with secondary data. The historical net asset value of the selected gold ETF for a period from 1st November 2015 to 31st October 2018 (739 Daily Observations) was collected from National Stock Exchange. The daily price of physical gold was collected from Wold gold Council. Adjusted monthly average returns for a period of 36 Months based on the net asset value was taken for the study.
Similar manner the returns of gold also was calculated. Descriptive statistical tools like mean, standard deviation, skewness and kurtosis were calculated. To measure the risk alpha and beta coefficient has been deployed. Various portfolio evaluation measures like Sharpe’s, Treynor’s and Jensen’s model has been used to investigate the funds. The risk-free rate of interest is taken as 7.58% (Source from RBI database) for the purpose of calculation.
Performance Evaluation Tools
Alpha
Alpha is a measure of estimating the excess return generated by portfolio when compared to the market after making necessary adjustment of risk. It also shows how better a portfolio manager acts in the selection of security for the portfolio. A positive alpha value shows that the portfolio has performed better than the market on a risk-adjusted basis. A negative alpha value shows that the portfolio performed worse than the market.
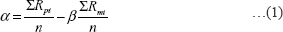
Where Rpi represents portfolio excess return (portfolio return minus risk-free return), n represents the number of observations, β the sensitivity of a portfolio’s rate of return to the market and Rmi represents the market excess return (market return minus risk-free return).
Beta
Beta measures undiversifiable (systematic) risk. It also shows how the price of security reacts to the market. It analyses the amount to which the fund’s return is impacted by the market.
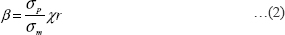
Where, σp and σm represents stanthe dard deviation of the returns of mututhe al fund scheme and benchmark index respectively. R represents the correlation between the return of mutual fund and benchmark index.
Sharpe’s Index
Sharpe’s index is one of the tools to measure the performance of a portfolio. The Sharpe index is calculated by dividing the mutual fund’s excess return by its standard deviation. Here the excess return is calculated by subtracting the actual return from the risk-free rate of return. A higher Sharpe index is considered to be better.

Where, R = average return, Rf = Risk free rate of return, S = Standard deviation.
Treynor’s Index
The Treynor index is the mutual fund’s excess return than the risk-free return divided by beta. The Treynor’s index represents the excess return earned per unit of systematic risk.

Where, ri = portfolio is return, rf = risk free rate of return, βi = portfolio i’s beta.
Jensen’s Index
Jensen’s Performance index is based on CAPM. It measures the absolute performance of a fund. A standard is fixed, and the actual performance is compared with it. The standard is created based on the portfolio manager’s predictive ability of price. Successful prediction of security price would enable the manager to earn higher returns than the ordinary investor expects to earn in a given level of risk.

Where, Rp = average return of portfolio, Rf = riskless rate of interest, α = the intercept, βi = a measure of systematic risk, Rm = average returns of market.
Sortino Ratio
The Sortino ratio is a measure of the returns of a hedge fund portfolio or a specific asset after making an adjustment for risk in it. Sortino Ratio is a revised form of Sharpe’s index. It considers only the negative effect, i.e., the returns earned below a required rate of return of the portfolio or specific asset.

Where R = Return of a portfolio, T = Required Rate of Return, D = Downside Risk.
Fama’s Measure
Fema’s Model measures the performance of mutual funds in terms of the different components of the risk of a portfolio. As per the Capital Asset Pricing Model, the return of a portfolio consists of risk-free returns and risk premium. The risk premium is a reward for risk plus rewards for selection. The reward for stock selection is for the better selection of stock for the portfolio. It’s the return earned on a portfolio over and above the return. As Fama’s measure is based on total risk, the reward for risk can be decomposed into a reward for systematic risk and reward for unsystematic risk.
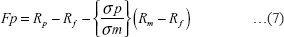
Where Rp represents the return of a portfolio, Rf is the risk-free rate of return. Rm represents the market return, σm and σp represent the standard deviation of return of market and portfolio respectively.
Correlation Analysis
Correlation is a statistical measure to show how strongly two or more variables correlate with each other.
Empirical Results
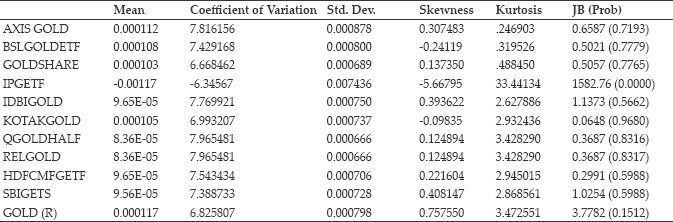
The descriptive statistics of Gold and Gold Exchange Traded Funds are presented in Table 2. It shows a summary of the descriptive statistics of returns of Gold and Gold ETF. The table shows the central value (Mean) and the spread of the data from the central value (Standard Deviation and covariance). It also summarises the statistical characteristics of data with tools like skewness, kurtosis and normal distribution. The highest means return was found in Axis Gold ETF and the lowest ICICI Prudential Gold Exchange Traded Fund. The highest standard deviation was observed in ICICI Prudential Gold Exchange Traded Fund which depicts that the returns are more volatile and may be considered highly risky. The lowest value of standard deviation is found in Reliance Mutual Fund and Quantum Mutual Fund. This shows that these funds are less volatile in terms of return when compared with other funds. The skewness for the returns are positive (non-asymmetric) in many of the funds; except Birla Sun Life Gold ETF, ICICI Prudential Gold Exchange Traded Fund and Kotak Gold Exchange Traded Fund which are negative (symmetric). The Jarque-Bera test for normality portrays at a significance level of 5%, indicating the rejection of the null hypothesis, which means the time series data of market indices are not normally distributed.
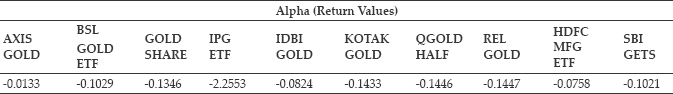
Alpha Calculation
The table 3 shows the alpha values of various Gold ETF taken for study. The higher value indicates generating more returns than gold. From the above, it is observed that all the alpha values are negative. ICICI Prudential Gold Exchange Traded Fund has the least alpha value. So, it is inferred that the ETFs generate a very low return which comparing to Gold.
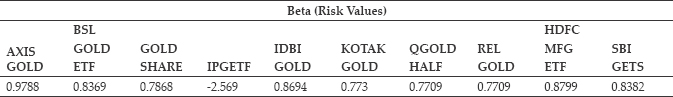
Beta Calculation
From table 4, Beta values express that a value less than 1.0 indicates that the would be less volatile than gold and more than 1.0 indicates that the fund would be more volatile than the gold. From the above table, it is found that all the funds have a beta value of less than one. So, it could be inferred that Gold ETFs are less volatile than gold.
Table 2: Summary statistics of the Gold and Gold ETF
Source: Author’s Calculation.
Table 3
Source: Author’s Calculation.
Table 4
Source: Author’s Calculation.
Table 5
Source: Author’s Calculation.
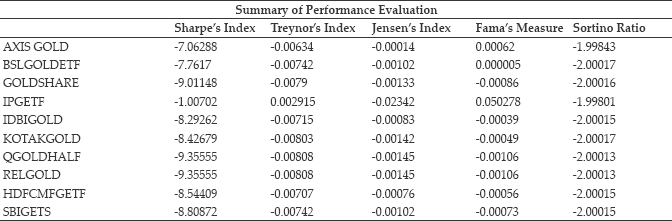
Performance Evaluation Calculation
The table 5 shows the various methods of evaluations of the portfolio. A fund with higher Sharpe’s index depicts better performance. It is calculated as per equation 3. Since the returns generated by gold ETFs are lesser than the risk-free rate of return, most of the values are negative, so it can be inferred that the funds are underperforming. Treynor’s index shows a negative value to all the ETF except for ICICI Prudential Gold Exchange Traded Fund. Jensen’s index measures the ability of the fund manager investment ability to generate a better return. All the ETF here also has a negative value. When compared to other funds it is found that Axis Gold ETF is performing better. Sortino ratio is a revised form of Sharpe’s index; it shows the downside risk of a portfolio. Since all the ETF generate lesser return than the risk-free rate of return all the funds have a negative value. According to Fama’s performance evaluation model, it is inferred that ICICI Prudential Mutual Fund performs better when compared to other ETF
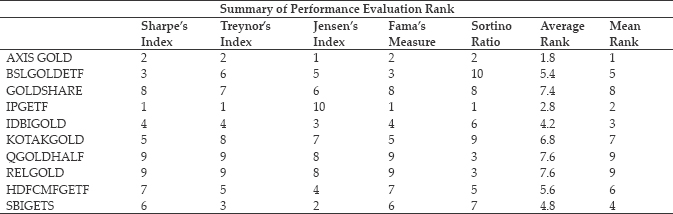
Performance Evaluation Ranking Calculation
The table 6, shows the ranking of the selected ETF as per different performance measure. Overall ranked based on the average ranking is also calculated. Axis Gold ETF performances better when compared to other ETF. Even though ICICI Prudential Gold Exchange Traded Fund performed better based on four portfolio evaluation measure but gained the least rank as per the Jensen model, Quantum Mutual Fund and Reliance Mutual Fund have the least rank.
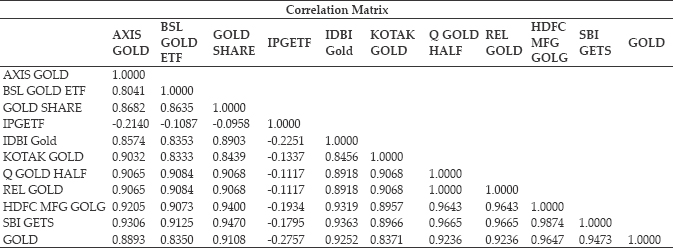
Correlation Matrix
Table 7 shows the correlation between physical gold and selected ETFs. It is found that all the Gold ETFs are strongly positively correlated with physical gold except ICICI Prudential Mutual Fund; it has a weak negatively correlated. Similarly, except ICICI Prudential Gold Exchange Traded Fund all ETFs have a strong positive correlation with other ETFs.
Gold Vs. Gold ETF analysis
The table 8, shows that the number of months in which the Gold ETF has generated more return than Physical Gold. As per the table out of 36 months taken for study, Gold ETFs have approximately generated more returns to the extent of 18 months accounting to 50%.
Table 6
Source: Author’s Calculation.
Table 7
Source: Author’s Calculation.
Table 8
| Gold Vs. Gold ETF Analysis |
|
No. of Months |
Percentage of Times |
| AXIS GOLD |
18 |
50 |
| BSLGOLDETF |
17 |
47.22 |
| GOLDSHARE |
21 |
58.33 |
| IPGETF |
18 |
50 |
| IDBIGOLD |
18 |
50 |
| KOTAKGOLD |
20 |
55.56 |
| QGOLDHALF |
16 |
44.44 |
| RELGOLD |
16 |
44.44 |
| HDFCMFGETF |
20 |
55.56 |
| SBIGETS |
17 |
47.22 |
Source: Author’s Calculation.
CONCLUSION
This study was conducted to examine the relationship between returns of physical gold and Gold ETF. It is found that the standard deviation of the ICICI Prudential Mutual Fund is high when compared to other ETFs, which implies that there is high volatility of returns and the data is not normally distributed. The negative Alpha value states that the ETF did not perform well when compared to the benchmark of gold. Beta values that say the systematic risk is negative for ICICI Prudential Gold Exchange Traded Fund which leads us to conclude that it has not performed well. The performance evaluation tools such as shaper’s index, Treynor’s Index, Sortino Ratio and Fama’s Model shows that ICICI Prudential Gold Exchange Traded Fund is performed better. But in the Jensen model shows Axis Gold ETF has performed better. These analyses provide the required information for the investors to take an investment decision. The correlation Analysis stated that physical gold and Gold ETFs have a strong positive relationship. So the investor may opt for investing in ETF than holding physical gold which is considered riskier. It is also found that Gold ETFs generates a better return than physical gold. So, investors can invest in Gold ETF.
REFERENCES
Anand, R.G. 2017. A Comparative Study on Gold vs Gold ETF’s and an Analysis of Gold ETF’s as an Effective Investment Tool for Indian Retail Investors. IJMBS, 7(3).
Athma, P. and Suchitra, K. 2017. GOld Exchange Traded Funds: Global Scenario. International Journal of Management Research, 7(08).
Athma, Prashanta, and K, S. 2011. Gold ETF: An Emerging investment option, Asia Pacific Management Jurnal of Research in Business Management, 2(1): 66-78.
Barman, A. 2014. Communities Behaviour in Gold Investment: An exploration in Guwahati City. International Journal of Trade & Global Business Perspective.
Eswara, M. 2015. An Empirical Study on Performance of Gold ETFs in India - Post Crash Period. Research Journal of Finance and Accounting, 6(13).
Gurgun, G. and Unalmis, I. 2014. Is gold a haven against equity market investment in emerging and developing countries? Finance Research Letters, 341 - 348.
Jain, S.P. and Mary, S. 2018. A Study on Performance of GOld ETFs trading in National Stock Exchange in India. International Journal of Advanced Research and Development, 829-833.
Kaur, P. and Singh, J. 2017. Evolution of Exchange Traded Funds (ETFs) – Comparison US and Indian Bourses. Amity Business Review, 116 - 126.
Kumar, M., Kumar, M.V. and Roy, S. 2012. Gold ETF Performance: A Comparative Analysis of Monthly Returns. IUP Journal of Financial Risk Management, 9(2).
Kumar, S. 2019. A study on the relationship between Gold price and Gold ETFs price. International Journal of Management, Technology And Engineering, 29(01).
Mehrotra, N. 2004. Gold and Gender in India: Some Observations from South Orissa. Indian Anthropological Association, 27-39.
Mishra, A. 2018. Gold Investment Vs. Real Estate Investment: An analysis. Journal of Business Management and Quality Assurance, 33 – 39.
Narend, S. 2014. Performance of ETFs and Index Funds: A Comparative Analysis. Department Studies Indian Institute of Technology, Madras.
Pandey, N. 2010. Invest in Gol, But via ETFs. Business Standard.
Ratner, M. and Kelin, S. 2008. The Portfolio Implications of Gold Investment. The Journal of Investing, 77 - 87.
VR Nedunchezhian, S.K. 2012. Financial Performance of Selected Indian Mutual Funds Schemes. European Journal of Social Sciences.