Economic Affairs, Vol. 64, No. 4, pp. 717-723, December 2019
DOI: 10.30954/0424-2513.4.2019.6
©2019 EA. All rights reserved
Value Chain Upgrading Strategies for Integration of Indian Small Coffee Growers in Global Coffee Value Chain
Pradeepa Babu, B.N.*1, Nagaraj Gokavi2, Rudragouda, C.S.3 and Y.B. Venkata Reddy4
1 Market Research and Market Intelligence Unit, Coffee Board, Bengaluru, India
2 Division of Agronomy, Central Coffee Research Station, Chikkamagaluru, India
3Promotion Unit, Coffee Board, Bengaluru, India
4Technical Officer, Coffee Board, Bengaluru, India
*Corresponding author: pradeepagecon2006@gmail.com (ORCID ID: 0000-0002-0454-1272)
Received:05-07-2019
Revised: 02-10-2019
Accepted:30-11-2019
ABSTRACT
Government of India believes boosting exports of agricultural commodities is a sure-shot way to enhance the farmers income in the country. Indian coffee is primarily an export-oriented commodity with over 75% of the annual production being exported to various destinations around the world. Small coffee growers dominates coffee production in the country. The main objective of the study is to estimate the operational cost involved in the production of Robusta coffee and also to estimate the price spread between the coffee growers at farm gate level and at exporters level. The results of the study indicates that, there is a huge price spread (₹ 34,147 per ton) in coffee value chain due to the inability of the small coffee growers to ship their coffee directly to export destinations which is caused by a number of impediments like low bargaining power associated with fragmented production, lack of trade knowledge, lack of capital and information barriers. Thus, it is important to provide visionary long run sustainable solutions to micro level weakness and threats by considering strengths and opportunities of small coffee growers in the country to move up in the value chain. The results of the study also indicates that, there is huge potential for the coffee growers to enhance their gross income from existing ₹ 94,900 per acre to ₹ 1,29,047 per ton by moving up in the value chain. The study also highlighted the initiatives taken by the Coffee Board to support small coffee growers to move up in the value chain.
Highlights
 Small holders dominates the coffee sector in India. The purpose of this study is to understand where the small coffee growers stand in the global value chain and to identify the main constraints and opportunities for the coffee growers to move upward in the value chain..
Keywords:Value chain, coffee growers, price spread, coffee board, blockchain, cost of production
Coffee is most widely traded tropical agricultural commodity across the globe. Coffee production (over 90&) takes place in the developing countries while more than 75 per cent of it is consumed in developed countries (ICO1). The total global production of coffee stood at 101.87 lakh tonnes and consumption at 97 lakh tonnes in 2018 (ICO). The coffee industry engages about 100 million people of which 20-25 million are small growers (Coffee Barometer, 2018). The reports of International Coffee organization details that coffee is supporting millions of small farmers and creates enormous employment opportunities in rural areas.
Major Coffee growing countries have been distinguished under four regions: South America (48&), Asia and Oceana (28&), Mexico and Central America (13&) and Africa (11&) (ICO). Across these regions, Brazil, Vietnam, Colombia, Indonesia, Honduras, Ethiopia, India, Uganda, Peru and Mexico are being recognized as top 10 coffee growing countries (ICO, 2019). Brazil and Vietnam are the world’s biggest coffee growers, accounting for more than half of the total production (Fig. 1). South America & Asia dominated the coffee production worldwide, which accounts more than three-fourth of total world production.
How to cite this article: Pradeepa, B.N, Gokavi, N., Rudragouda, C.S. and Venkata Reddy, Y.B. (2019). Value chain upgrading strategies for integration of Indian small coffee growers in global coffee value chain.
Economic Affairs, 64(4) 717-723.
_____________
1international Coffee Organization
Production of coffee in India has increased from 1.70 lakh tonnes in 1990-91 to 3.16 lakh tonnes in 2017-18 (Coffee Board Database). Arabica coffee production was 78, 311 tonnes (46& of the total coffee production) in 1990-91 which increased to 95,000 tonnes in 2017-18 (30& of the total coffee production). However, the share of arabica in total coffee production decreased from 46 per cent in 1990-1991 to 30 per cent in 2017-2018. During the same period, the share of robusta coffee production increased from 54 to 70 per cent, from 91,415 tonnes to 2,24,500 tonnes, indicates Indian coffee production is moving towards Robusta mainly due to the problem of higher cost of cultivation in Arabica necessitated in controlling diseases and pests and also declining yields not compensated by increase in prices.
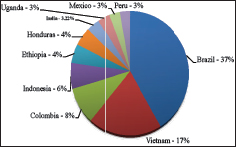
Fig. 1: Top Coffee Producing Countries in the World during 2018
Source: International Coffee Organization
Coffee in India is mainly cultivated in the four southern states viz. Karnataka, Kerala and Tamil Nadu. Karnataka is the leading coffee producer accounting for 54 per cent of the total area and 69 per cent of production in India (Fig 3), followed by Kerala (19& of area and 22& of production) and Tamil Nadu with 8& of area and 6& of production (Coffee Board Database).
The contribution of coffee in India’s gross domestic product (GDP) is about 0.05& per cent in 2017-18 and the share of coffee sector in the country’s exports during 2017-18 was 0.43& (Economic Survey, 201819). However, it is much more important for the economies of the states in which it is grown. Coffee sector provides employment to more than 20 lakh people directly or Indirectly in India (Coffee Board of India).
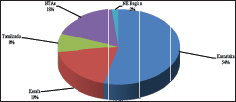
Fig. 2: Planted area under coffee in coffee growing States (% to total)
Source: Coffee Board
It contributes 2.5 per cent to the nation’s primary sector export earnings, highlighting its economic importance (Economic Survey, 2018-19). There are 3,66,242 coffee holdings in India, of which 99 per cent are less than 10 hectares in size and falls under the category of small holdings. Small holders form about 75& of the total planted area of the country and accounts for 70& of the production. Large holders form 25 percent of the total planted area and account for 30 percent of output, as their productivity levels are moderately higher.
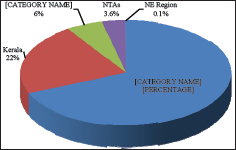
Fig. 3: Coffee production in coffee growing States (% to total)
Source: Coffee Board
Small holders dominates the coffee sector in India. This study attains importance in the eve of the global coffee industry facing a chronic over supply which is termed as ‘Coffee Crisis’ resulting in a plummeting coffee prices. internationally, Coffee futures are traded in commodity exchanges viz., Intercontinental exchange (ICE) US in the New York and ICE Europe in the London terminal markets. India with about 3.2& share in World coffee production does not have significant influence on the international coffee prices. Hence, we are basically price takers rather than the price influencers.
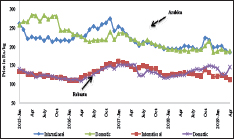
Fig. 4 : Price Trend -International Vs Domestic
Source: International Coffee Organization and Coffee Board
Domestic coffee prices which mainly depends on International coffee prices ruling low for last couple of years, as per the International Coffee organization, the monthly average of the International Coffee Organization composite indicator fell to 94.42 US cents/lb in April 2019 (Fig. 4), this represents the lowest monthly average composite indicator since July 2006 when it reached 88.57 US cents/lb.
The International Coffee Organization reported that, the Market fundamentals are one of the main drivers contributing to the low prices and during the coffee year 2018/19 production exceeds consumption and this is the second consecutive season of surplus.
In the other hand, the production costs are going up in the recent years in major coffee growing regions mainly due to increase in Labour wages. Coffee is traded down with many number of intermediaries, ranging from Commission Agents, local traders, Village Level Consolidators, Curers, International Traders, Exporters, Roasters and Retailers who each capture a significant proportion of the retail value of coffee. Thus, the purpose of this study is to understand where the small coffee growers stand in the global value chain and to identify the main constraints and opportunities for the coffee growers to move upward in the value chain.
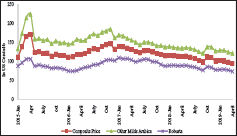
Fig. 5 : International Coffee Price Tend
Source: International Coffee Organization
Constraints in the study; Asymmetry of Information: The study is mainly qualitative based and most of the information was coded to ensure secrecy of data. Complex quantitative tools are not applied in the study as it demands a larger sample size and more time and effort in collecting the data. Another constraint related to availability of respondents since the coffee growing households are scattered. Further, the secondary data pertaining raw coffee price prevailed in Chikkamagaluru and Hassan district and value of coffee exports are used in estimating price spread. Hence, the price spread quantification has some limitations.
MATERIALS AND METHODS
Data, sampling design
The study used quantitative data pertaining to cost of production collected for coffee value chain actors in Chikkamagaluru and Hassan districts of Karnataka during 2017-18 period. A semi-structured, pre-tested survey with both open and closed ended questions was used to collect relevant information. The survey addressed information related to production and marketing practices. Care was taken to explain the objectives of the study to the coffee growers so as to convince them to provide factual and truthful information and avoid redundancy. Overall, the sample included 60 planters.
Milford 2004 reported that a coffee bean may change hands as many as 150 times from producer to consumer (MILFORD 2004). The value chain framework helps in understanding the various actors involved in the value chain and relationship between them and which also demonstrates how coffee moves from production, processing, retailing and to final consumer.
Analysis of the Data
The data collected from coffee growers subjected for simple descriptive statistics like averages and percentages. The technical aspects include the cost of production, marketing costs and price spread.
Price Spread = Pc - Pp
Pc - Price paid by the consumer
Pp - Price received by the producer
Value Chain Framework
The identification of the actors and the constraints faced by the grower in production and marketing of the coffee in the value chain is gathered based on field survey and a value chain framework for coffee in Chikkamagaluru and Hassan districts is prepared and presented below.
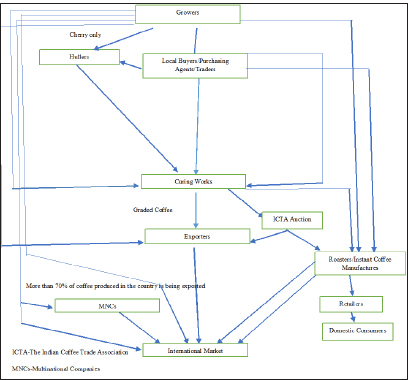
Fig. 6 : Coffee value chain framework
RESULTS AND DISCUSSION
An assessment of the Chikkamagaluru and Hassan district Robusta coffee value chain
In Chikkamagaluru and Hassan district over 90 per cent of the growers sell their produce at farm gate level due to easy accessibility to the local traders and village level consolidators. Hence, growers are not involved in marketing of coffee and are not much benefitted in terms of value addition and prices. The growers sell their produce to village level consolidators, traders and facilitators of MultiNational Companies. Besides, a few companies (viz., TATA coffee and Amalgamated Bean Coffee Trading Company Ltd.,) are engaged in coffee production while they market their coffee in both domestic and international markets in their own brand names.
Primary level processing of coffee (at estate level) can be either by wet or dry methods. In Chikkamagaluru and Hassan districts a majority of the Robusta growers2 practice dry processing method where the coffee beans are spread over in the drying yard/ floor (mud /cement/tile) subject to sun drying. Fresh beans are also pulped by wet process to get parchment coffee. However, the small growers are unable to produce parchment coffee as they do not have the required infrastructure in their own farm. But, few have ventured in to get it processed in their neighbouring farms where pulping facilities are available on rental basis. After dry or wet processing, it flows to village level consolidators or traders, who further sell them to bigger traders, curing works, facilitators/agents of MNCs and exporters.
Some of the producers sell their produce directly to curers/exporters/roasters to earn better producer share in the consumer rupee. The Curers further process dried cherries and parchment coffee to clean coffee3. The curer market their produce to exporters/roasters or in some cases curer himself exports. However, the traders normally have informal supply agreement with other traders/ curers/roasters/exporters. In the coffee value chain in Chikkamagaluru and Hassan Districts, village level traders are identified as ‘powerful local actors’ who are involved in collection of coffee from growers. They pass the product to curing works, roasters, MNCs and exporters. They are acquainted with updated price information, in addition to provisioning finance and storage facilities. They hugely dominate the local market and act as prominent middlemen between the growers and curers/exporters/roasters.
_____________
2For that matter, it is convenient for small growers to go for dry processing as it requires only sun drying and involves a very less cost. But, the wet method of processing requires heavy machinery (coffee pulper), water, electricity/diesel and labour. But the wet coffee which also called parchment is considered to be of higher quality and fetches higher price. Generally, Arabica coffee is wet processed while robusta is processed into cherry. Thus, small robusta growers largely undertake dry processing.
3Clean coffee is nothing but the coffee beans after removal of husk. Note that, wet coffee does not need hulling. It is cured directly. Further, hulled coffee needs to be cured.
The secondary processing is carried out by the curers either MNCs or local private companies. The role of curing works is important in the coffee value chain. These players practice systematic vertical integration involving in marketing activities such as sourcing coffee from growers, local traders and commission agents. Thereupon, they cure the coffee procured, store and sell in domestic and international markets. Some of them are adding certification of coffee to the bag of their activity by expanding their marketing functions and moving towards higher degree of vertical integration. This move from few buyers, to the advantage of coffee farmers. The nodal points in coffee marketing network are the village level traders who operate at local level and curing works who operate at regional level are largely controlled by the exporters. The exporters have high access to market information and are highly benefitted from the information provided by the agents in the international markets (David and Clementine, 2008). These local curers inturn sell their coffee to export markets and domestic roasters and retailers to reach ultimate consumers.
Exporting of coffee is largely undertaken by MultiNational companies and few domestic companies. Top 20 exporters having share of 86& in India’s total coffee exports. As per the available sources, these companies supply quality coffee to the wholesalers/roasters of importing countries which is then distributed to retailers. The roasting process usually takes place near the consumption centre to obtain a desirable flavor and taste suiting the tastes of the consumers. The roasters, retailers and traders exert a high degree of control in the value chain of coffee. The coffee value chain is comprised growers, traders, curers, domestic companies, multinational companies (MNCs), exporters, importers, domestic and international roasters, retailers, and consumers (Fig.6).
Cost of Cultivation in Robusta
The estimated average total variable cost incurred for irrigated Robusta is ₹ 65,254/acre (Table 1). Coffee production being labour intensive, the total labour cost is accounted for about 73& (₹ 47,382) of the total variable costs indicates lack of cost leadership.
The cost of inputs is about ₹ 17,872 which accounted for 27 per cent. Among the total variable costs, cost of fertilizers (including FYM) accounted for maximum share of ₹ 15,203 (23.30&) followed by harvesting cost ₹ 12,159 (18.63&) and bush management cost of ₹ 10,061(15.42&).
Table 1: Cost of cultivation of Robusta Coffee- Irrigated (₹/acre.) during 2017-18
| Particulars |
Labour (Man Days) |
Labour cost (₹/acre) |
Input cost (₹/acre) |
Total cost (₹/acre) |
| Fertilizer including FYM |
11 |
3394 |
11809 |
15203 |
| Shade regulation |
19 |
5822 |
- |
5822 |
| Weeding |
21 |
6428 |
- |
6428 |
| Bush Management(Pruning +Desukering) |
33 |
10061 |
- |
10061 |
| Soil Management(Cradle pits renovation + Lime Application) + Supply Planting) |
12 |
4311 |
1150 |
5461 |
| Pest/ disease management |
3 |
1054 |
870 |
1923 |
| Harvesting |
40 |
12159 |
|
12159 |
| Processing |
3 |
915 |
|
915 |
| Irrigation |
7 |
2018 |
2690 |
4708 |
| Miscellaneous |
4 |
1220 |
1353 |
2573 |
| Total variable cost |
154 |
47,382 |
17,872 |
65,254 |
| Gross Returns (Clean Coffee) |
₹ 130/Kg and estimated average yield is 730 kg per acre=94,900 |
|
|
|
| Net Returns |
₹ .94,900- ₹ 65,254=29,646 |
|
|
|
| Returns per Rupee of operational cost |
₹ 94,900/? |
65,254=1.45 |
|
|
Note: 1. For the purpose of the above calculation, wage rate of ₹ 305/man day is considered
2. Estimated average yield of 730 kg/acre.
3. Cost of Production estimated at ₹ 89 per Kg and ₹89041 per ton
The operational costs including marketing costs was estimated to be ₹ 65,254 per acre. The estimated yield is 730 kg/acre and the gross income realized was about ₹ 94,900 per acre giving return of ₹ 1.45 per rupee of operational costs. The net returns over operational costs was ₹ 29,646 per acre.
Price Spread in Robusta Coffee Value Chain
In case of Robusta about 80 per cent of the fruits are processed in the form of cherry while rest is in the form of parchment. Hence, the Robusta cherry is considered for estimating the price spread in the value chain. In order to enable easy comparison of cost from production to exports, the returns are calculated per tonne of clean coffee of Robusta cherry.
Robusta Coffee is predominantly an export oriented commodity, which accounts for more than 50& of India’s total coffee exports. Robusta Cherry is the major chunk in India’s coffee exports with the share of about 45& in India’s total coffee exports. Indian Robusta’s highly preferred for its good blending in the European Union. Hence, this study is limited for estimating the price spread from grower to exporter in case of Robusta Cherry. Findings of the study indicated that, there is a huge differences in the prices obtained by growers at farmgate level and at exporters level.
The average price received by the coffee growers at farmgate level for Robusta cherry coffee (raw coffee) during 2017-18 is about ₹64,927 per ton which is converted to clean coffee with the out turn of 50% (from Robusta Cherry to clean coffee- Robusta Cherry-AB) then the estimated cost of Robusta Cherry AB coffee is ₹ 1,29,853 per ton at grower level. The average exported value of Robusta Cherry -AB exported to Belgium (European countries are the major destination for Indian coffee exports.) during 2017-18 is about ₹ 164000 per ton. Hence, the estimated price spread is ₹ 34,147 per ton of Robusta Cherry-AB. This high price spread is mainly due to inability of the small coffee growers to reach the export market directly. These results are in consonance with the value chain study conducted by Bhavya Venkatesh in Coorg district of Karnataka during 2011. Small holdings dominates coffee production in India. The coffee Board is the nodal agency for the coffee sector in the country working with the coffee growers to enable them to move up in the value chain.
Value Chain upgradation strategies for small coffee growers by Coffee Board
♦Block chain technology for online market place and traceability of Indian coffee: Coffee Board activated Blockchain based market place application for trading of Indian coffees in collaboration with Eka analytics on pilot basis. The initiative will help in creating a brand image for Indian Coffee through traceability, in reducing growers dependency on intermediaries by having a direct access to buyers for a fair price for their produce, in finding right coffee suppliers for exporters and within the stipulated time to meet the growing demands and in building a better trust & long term relationship due to increased visibility towards the traceability and transparency of the produce.
♦Coffee Board is encouraging Farmer Producer Organizations (FPOs) help the small growers to become competitive and get better market access.
♦Coffee Board is facilitating access to e-commerce by connecting the small Farmer Producer Organizations with the leading e-commerce platforms in India to enable the growers directly market their value added, branded coffees and earn higher returns.
♦Coffee Board encouraging marketing of coffee on community basis, support is being extended for Small Growers’ Collectives / SHGs / Cooperatives for Coffee Marketing @ ₹ 4/- per Kg. of Clean Coffee in traditional coffee growing areas of Karnataka, Kerala and Tamil Nadu, @ ₹ 10/- per Kg of clean coffee in Non-traditional areas of Andhra Pradesh and Odisha and @ ₹ 15/- in North Eastern Region.
♦Coffee Board is extending the support for encouraging small growers to improve quality for higher returns and improve access to high value specialty markets through production of eco-certified coffees by forming groups/ collectives.
♦The Coffee Board has obtained Geographical Indication (GI) registration in 2019 for Arabica coffees grown in Bababudangiris, Chikkamagaluru, Coorg, Araku Valley and for Robusta coffee grown in Wayanad apart from Gl registration obtained during 2008 for two speciality coffees viz., Monsooned Malabar Arabica and Monsooned Malabar Robusta. These GI registrations will increase the credibility of Indian coffee in the International market which in turns helps the grower to earn better premiums for their coffees.
♦The Coffee Board is working on Digital media campaigns for Promotion of uniqueness of Indian coffees in the International market which help in boosting the Indian coffee exports.
♦The Coffee Board has developed a “COFFEE CONNECT - MOBILE APP” for providing advisory services to the coffee growers.
♦The Coffee Board has taken up a pilot project in Collaboration with Precision Agriculture for Development (PAD), a USA based Not for Profit Organization for providing efficient, timely customised advisory to the coffee growers.
CONCLUSION
The coffee value chain in India is at an important transition point. Traditional means of marketing and production are increasingly under threat from market pressures, with new strategies for diversification of income streams and production lines necessary especially for small coffee growers. In this backdrop, the Coffee Board is intensively working with the small coffee growers to enable them to move up in the value chain. Keeping the limitations in increasing coffee production as there is limited scope for increasing area in traditional coffee growing regions and low productivity of tribal holdings in non-traditional coffee growing regions, Coffee Board is focussing on increase the value of exports by focusing on the strengths and uniqueness of Indian coffees in the international market through branding and promotional campaigns. Coffee Board of India has taken up many initiatives viz., encouraging Farmer Producer Organizations (FPOs) and linking FPOs with e-market platform, protection of uniqueness of regional coffees through GI tags, coffee specialized shops and private branding on e-Commerce platform, traceability using Block chain technology, Precision Agriculture for Development (PAD) to enhance the income of small coffee growers by empowering them to move up in the value chain.
REFERENCES
Ashwin Kumar Sinha and Sunil Kumar Singh. 2019.Economics of Potato Production in Northern Hills of Chhattisgarh. Economic Affairs, 64: 01-07.
Babita Kathayat. 2019. Performance of Regulated Markets in Odisha Under New Agricultural Marketing Reforms Regime. Economic Affairs, 64: 292-295.
Singh, O.P., Singh, H.P., Rakesh Singh and Khim Raj Regmi. 2013. A Value Chain Analysis of Vegetables: A Case Study of Palpa District, Nepal.Economic Affairs, 58: 135-146.
Bitzer Verena, Mara Francken and Pieter Glasbergen. 2008: Intersectoral Partnerships for a Sustainable Coffee Chain: Readdressing Sustainability or Just Picking (coffee) Cherries?. Global Environmental Change, 18: 271-284.
Coffee Barometer, 2018. https://www.hivos.org/assets/2018/06/Coffee-Barometer-2018.pdf
Database on Coffee, Coffee Board of March. 2019. www.indiacoffee.org.
David, M. and Clementine, V. 2008. Coffee Value Chain and Geographical Indications in India: origin, reputation and marketing of Indian coffees. Published by CIRAD.
Deepa, M.P.M. and Srikantha Murthy, P.S. 2019. Economic Analysis of Women Empowerment Through Value Addition of Jackfruit in Bengaluru Rural District. Economic Affairs, 64: 402-406.
Economic Survey 2018-19, Department of Economic Affairs, Ministry of Finance, Government of India.
Economic Times, 2013: India’s coffee exports down by 10 per cent in FY13, 4 Apr, 2013, 01.57PM IST (http://economictimes.indiatimes.com/articleshow/19378295.cms).
GTZ. 2008. ValueLinks Manual: The Methodology of Value Chain Promotion, Ed. Andreas Springer-Heinze, German Organisation for Technical Cooperation, Bonn, Germany.
Kaplinsky, R. and Morris, M. 2000. A Handbook for Value Chain Research. Prepared for International Development Research Centre, Ottowa.
Milford A. 2004. Coffee cooperatives and competition: The Impacts of Fair Trade. Michelsen Institute Development Studies and Human Rights, Bergen.
Mercereau, David and Vignault, Clementine. 2008. Coffee Value Chain and Geographical Indications in India: Origin, reputation and marketing of Indian Coffees. CIRAD- Agriculture Research for Development.
Ponte Stefano. 2002. The ‘Latte Revolution’? Regulation, Markets and Consumption in the Global Coffee Chain. World Development (Elsevier Science Ltd.), 30: 1099-1122.
Ponte, S. 2004. Standards and Sustainability in the Coffee Sector. A Global Value Chain Approach. United Nations Conference on Trade and Development and the International Institute for Sustainable Development, Published by the International Institute for Sustainable Development, Canada.
Qammer, N.A. and Baba, S.H. 2018. Analysis of Modernized Value Chain of Walnut in Jammu & Kashmir. Economic Affairs, 63: 165-174.
Schipmann, C. 2006. Value Chains for Better Integration of smallholders to trade-the case of Chilli in Ghana. Unpublished Master Thesis in Agricultural Economics, Humboldt University of Berlin, Faculty of Agriculture and Horticulture.
Trade Statistics, International Coffee Organization. http://www.ico.org.
Upendranadh, C. 2010. Coffee Conundrum: Wither the Future of Small Growers in India?. Discussion Paper 3, NRPPD, Centre for Development Studies, Thiruvananthapuram.
Upendranadh, C. and Subbaiah, C. 2012. Small Growers and Coffee Marketing-Issues and Perspective from the field. Discussion Paper 15, NRPPD, Centre for Development Studies, Thiruvananthapuram.