Economic Affairs, Vol. 64, No. 4, pp. 733-746, December 2019
DOI: 10.30954/0424-2513.4.2019.8
©2019 EA. All rights reserved
Direction and Destination Pattern of Indian Mango & Mango Pulp’s Exports
Namrata Devi1*, R.L. Shiyani1 and N.J. Ardeshna2
1Department of Agril. Economics & Statistics, College of Agriculture, J.A.U., Mota Bhandariya, Amreli, Gujarat, India
2Department of Agril. Economics, Junagadh Agricultural University, Junagadh, Gujarat, India
*Corresponding author: nimso1995@gmail.com (ORCID ID: 0000-0003-0545-5955)
Received: 12-07-2019
Revised: 03-10-2019
Accepted: 26-11-2019
ABSTRACT
This study explores growth dimensions, instability, sources of growth and variability of mango and mango pulp exports to major importing countries. The secondary data on volume and value of mango and mango pulp exports from India collected for 30 years from the year 1987-2016 were analyzed using Markov Chain and accordingly the future exports were forecasted. UAE and Kuwait for fresh mango and Saudi Arabia, UAE and Netherland for mango pulp were the most stable markets. It was predicted that quantum of mango export to countries Viz; Saudi Arabia, Kuwait and UK are expected to increase while quantity exported to UAE, Bangladesh and other countries are expected to decline from the year 2016-17. On the other hand, for mango pulp, forecasting revealed that in terms of quantity its export to UK, UAE, Netherland and USA would rise and quantity exported to Saudi Arabia, YAR and other countries would decline. A need for more concentration on export promotion to tap the potential and strengthening of existing processing units by providing access to information on modern technology, packaging, markets, food laws and hygiene requirements of different market are suggestions emerged from the study.
Highlights
 Export promotion through access to information on modern technology, packaging, markets, food laws and hygiene requirements of different market will help to boost the export are the key findings of the study.
Keywords: Fresh mango, mango pulp, markov chain, prediction of export
India is the largest producer of mangoes with 41.63 per cent of the total world production. India’s share in world mango market is less than 20 per cent, but mangoes account for about 40 per cent of the total fruit exports from India. Nearly 200 million dollar had earned through export of mango and mango based products (Kumaresh and Sekar, 2013). Mango is cultivated in area of 2.2 million ha with a production of 15.5 million tonnes in the country (Anon., 2011). The export earnings from unit area of mango were higher when compared to that from the unit area of other crops. Even though export of mangoes is increasing, the share of quantity exported (0.38%) out of total production is meager (Kusuma and Basavaraja, 2014). India exports mango to over 50 countries worldwide. The export value of fresh mangoes has increased from ₹ 35.2 crores in 1991-92 to ₹ 215.09 crores in 2016 (Anon., 2011). The major export markets for Indian mangoes are U.A.E, United Kingdom, Saudi Arabia, Qatar, Kuwait, Nepal, Bahrain and Bangladesh, both in quantity and value terms. Mango pulp is also the major source of export earnings. It is exported to Saudi Arabia, Netherland, Yemen Republic, United Kingdom etc. India is also a major exporter of Mango pulp in the world. The country has exported 1,05,873 MT of Mango pulp to the world for the worth of ₹ 657.66 crores / 93.95 USD Millions during the year 2018-19 (Anon., 2019). India’s contribution to the world’s mango production is the highest (1,84,31,330 MT) as compared to Thailand (35,97,589 MT) who is the leading exporter of mango in world. However, India’s share in total export of mango is only 2.00 per cent (42,555 MT) in International market and in the value terms, it earns USD 48,255 as compared to Thailand whose share is 16.85 per cent (2,02,507 MT) and in value terms, it earns USD 4,07,296 which is higher than India (Anon., 2015). This study addresses the direction of trade and destination pattern of export of mango & mango pulp and forecasting the future exports to major importing destinations from India
How to cite this article: Devi, N., Shiyani, R.L. and Ardeshna, N.J. (2019). Direction and destination pattern of indian mango & mango pulp’s exports. Economic Affairs, 64(4): 733-746.
Methodology
Padmanaban et al. (2014) studied the export of cashew kernel from India: its direction and prediction by using Markov chain approach.To examine direction of trade in export of mango and mango pulp from India, country wise export data collected from Agricultural & Processed Food Products Export Development Authority (APEDA), India and National Horticulture Board (NHB), New Delhi from the year 1987-88 to 2016-17, split into four periods viz. pre-WTO (Period I (1987-88 to 1995-96)), trans-WTO (Period II (1996-97 to 2004-05)), post-WTO (Period III (2005-06 to 2016-17)) and overall period (Period IV (1987-88 to 2016-17). The collected data were analyzed using the first order Markov chain approach for estimation of the transitional probability matrix ‘P’ whose elements, Pij indicates the probability of exports switching from country ‘i’ to country ‘j’ over time. The diagonal element Pij measures the probability of a country retaining its market share or in other words, the loyalty of an importing country to a particular country’s exports. The average exports to a particular country were considered to be a random variable which depends only on the past exports to that country, which can be denoted algebraically as:

Where, Ejt is exports from India to the jth country in the year t; Eit-1 is exports of ith country during the year t = 1; Pij is probability that exports will shift from ith country to jth country; ejt is error term which is statistically independent of Eit-1 and N is number of importing countries.
The transitional probabilities Pij, which can be arranged in a (c x n) matrix, have the following properties,

Thus, the expected export share of each country during period ‘t’ was obtained by multiplying the exports to these countries in the previous period (t - 1) with the transitional probability matrix. The probability matrix was estimated for the period 1987-88 to 2016-17. Thus, transitional probability matrix (T) was estimated using linear programming (LP) framework by a method referred to as minimization of Mean Absolute Deviation (MAD).

Subject to,
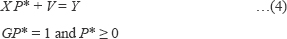
Where, P* is a vector of the probabilities Pij; O is the vector of zeros; I is an appropriately dimensional vectors of export quantity/ export value; E is the vector of absolute errors; Y is the proportion of exports to each country; X is a block diagonal matrix of lagged values of Y; V is the vector of errors and G is a grouping matrix to add the row elements of P arranged in P* to unity.
Prediction of quantity of fresh mango and mango export was made by using the Transitional Probability Matrix from year 2018-19 to 2022-23.


Where, B0 is quantity exported in base years; Bt+I is quantity exported in next year and T is transitional probability matrix.
To test whether the observed shares of exports to different countries and the predicted shares from the Markov chain model follow similar distributions, the chi square statistics of the following types was used.

Where, Yi (t) is observed proportions of ith country’s share at time t; yi (t) is predicted proportions of ith country’s share at time t; N(t) is total number of countries at time t; R is countries and T is Year.
The destination pattern of export of mango and mango pulp from India to different countries of world were analysed on the basis of percentage share of respective countries in terms of volume and value of exports.
RESULTS AND DISCUSSION
The Trade matrices were estimated using Markov chain approach and the primary impetus was to identify important relationships that exist among importing countries. These loyalty characteristics are long term phenomenon and Markov Transitional probability matrix facilitates a reasonable estimate of the same (Manjunath et al. 2017). The major Indian fresh mango importing countries were UAE, Kuwait, Bangladesh, Saudi Arabia, UK and all other importing countries grouped under the category of the “Other countries”. The row elements in the transitional probability matrix provide the information on the extent of loss in trade, on account of competing countries. The columns element indicates the probability of gains in volume of trade from other competing countries and the diagonal element indicates probability of retention of the previous year’s trade volume by the respective country.
It is evident that UAE was one of the most stable markets among the major importers of Indian mango as reflected by the probability of retention at 0.5667, i.e. the probability that UAE retains its export share over the study period was 56.67 per cent (Table 1). Fresh mango export to UAE was retained to the tune of 56.67 per cent of its previous year’s share in the current period; of the remaining 43.33 per cent of UAE market share, 3.33 per cent was directed to Saudi Arabia, 30.00 per cent to Bangladesh, and 10.00 per cent to other countries. These results are in line with findings of Tirlapur et al. (2014). Thus, UAE was the most reliable and loyal market for Indian mango because of the reason that Indian mango exports have been subjected to vapour heat treatment, which improved the quality of fruits by eradicating the maggots present in the fruits.
A high probability of retention of Kuwait (0.5000) implied that it had lost half of its share to other importing countries. Out of its remaining 50 per cent market share, 16.67 per cent was directed to Saudi Arabia, 20.00 per cent to UK and 13.33 per cent to Bangladesh. These results are in line with findings of Bisht et al. (2015). Moderate probability retention was observed in Bangladesh i.e. 0.3448, which means it retains its export share of 34.48 per cent. This implied that it had lost most of its share to other importing countries; of the remaining 65.52 per cent of Bangladesh market share, 27.59 per cent was lost to UAE, 3.45 per cent to Saudi Arabia, 10.34 per cent each to UK and Kuwait and remaining 13.79 per cent was diverted toward other countries.
The remaining countries such as UK and Saudi Arabia had the retention of 30.00 per cent and 33.33 per cent of its original share respectively. This indicates that they were also the stable importers of Indian mango, whereas those countries, which imported mango in less quantity from India, were pooled under the ‘Other’ countries which showed moderate stability, which retained 33.33 per cent of its original share.
Table 1: Transitional Probability Matrix for quantity of fresh mango export from India (1987-87 to 2016-17)
| Destination |
U.A.E. |
Saudi Arabia |
Kuwait |
U.K. |
Bangladesh |
Other countries |
| U.A.E. |
0.5667 |
0.0333 |
0.0000 |
0.0000 |
0.3000 |
0.1000 |
| Saudi Arabia |
0.0333 |
0.3333 |
0.0667 |
0.2333 |
0.0667 |
0.2667 |
| Kuwait |
0.0000 |
0.1667 |
0.5000 |
0.2000 |
0.1333 |
0.0000 |
| U.K. |
0.0000 |
0.2333 |
0.2667 |
0.3000 |
0.0333 |
0.1667 |
| Bangladesh |
0.2759 |
0.0345 |
0.1034 |
0.1034 |
0.3448 |
0.1379 |
| Other countries |
0.1333 |
0.2000 |
0.0667 |
0.1667 |
0.1000 |
0.3333 |
The major gainer among importers of Indian mango over a period of time has been UK, which has a transfer probability of 0.2333 from Saudi Arabia, 0.2000 from Kuwait, 0.1034 from Bangladesh and 0.1667 from other countries. The probability that Bangladesh would gain in the export share of Indian mango over the study period at the cost of Saudi Arabia, Kuwait, Bangladesh and other countries were 0.2333, 0.2000, 0.1034 and 0.1667 respectively. Therefore, UK loses about 70.00 per cent of its total imports. Saudi Arabia could retain its original share of 33.33 per cent and gained 3.33 per cent from UAE, 16.67 per cent from Kuwait, 23.33 per cent from UK, 3.45 per cent from Bangladesh and 20.00 per cent from other countries. Whereas, it lost its share to the tune of 56.67 per cent to UAE, 30.00 per cent to Bangladesh and 10.00 per cent to other countries. Bangladesh sustained its original share of 34.48 per cent and gained 30.00 per cent from UAE, 6.67 per cent from Saudi Arabia, 13.33 per cent from Kuwait, 3.33 per cent from UK and 10.00 per cent from other countries. Whereas 27.59 per cent was lost to UAE, 3.45 per cent to Saudi Arabia, 10.34 per cent each to UK and Kuwait and remaining 13.79 per cent was to other countries. Therefore, Bangladesh lost 65.52 per cent and retained the rest. UAE had retained its original share of 56.67 per cent and gained 3.33 per cent from Saudi Arabia, 27.59 per cent from Bangladesh and 13.33 per cent from other countries.
Kuwait sustained its original share of 50.00 per cent and gained 6.67 per cent from Saudi Arabia, 26.67 per cent from UK, 10.34 per cent from Bangladesh and 6.67 per cent from other countries. Whereas, 16.67 per cent was directed from Kuwait to Saudi Arabia, 20.00 per cent to UK and 13.33 per cent to Bangladesh. Therefore, Kuwait lost about half of its share and retained the rest. Other countries retained its original share of 33.33 per cent and gained 67.13 per cent from other nations, 10.00 per cent from UAE, 26.67 per cent from Saudi Arabia, 16.67 per cent from UK and 13.79 per cent from Bangladesh. Whereas it lost 13.33 per cent from UAE, 20.00 per cent from Saudi Arabia, 6.67 per cent from Kuwait, 16.67 per cent from UK and 10.00 per cent from Bangladesh. Therefore, the total loss of other countries was 66.67 per cent.
The transitional probabilities estimated through MAD method presented in Table 2 revealed that no single export market shows high probability of retention in mango pulp export. It was evident that UAE was one of the most stable countries among major importers of Indian mango pulp as reflected in the probability that UAE retains its export share from one period to another period was about 33.33 per cent. Remaining 66.67 per cent of UAE market share, 6.67 per cent was directed to Saudi Arabia, 16.67 per cent to UK, 20 per cent to Netherland, 3.33 per cent to other countries and 10 per cent to each YAR and USA. Saudi Arabia had the probability retention of 0.3103, which retains its export share of 31.03 per cent. This implied that it had lost 68.97 per cent of its share to other importing countries; of the remaining 68.97 per cent of Saudi Arabia market share, 3.45 per cent was directed to both Netherland and USA separately. Similarly, 13.79 per cent share was directed to both UK and YAR and remaining 34.48 per cent directed to other countries.
USA had moderate probability retention of 0.2667, which retains its export share of 26.67 per cent. This implied that it had lost most of its share to other importing countries; of the remaining 73.33 per cent of UAE market share, 3.33 per cent was lost to Saudi Arabia, 23.33 per cent to UK, 6.67 per cent to UAE, 16.67 per cent to Netherland and 23.33 per cent was to YAR.
Table 2: Transitional Probability Matrix for quantity of mango pulp export From India (1987-87 to 2016-17)
| Destination |
Saudi Arabia |
U.K. |
U.A.E. |
Netherlands |
YAR |
U.S.A. |
Other Countries |
| Saudi Arabia |
0.3103 |
0.1379 |
0.0000 |
0.0345 |
0.1379 |
0.0345 |
0.3448 |
| U.K. |
0.1333 |
0.2333 |
0.3000 |
0.1000 |
0.0000 |
0.1667 |
0.0667 |
| U.A.E. |
0.0667 |
0.1667 |
0.3333 |
0.2000 |
0.1000 |
0.1000 |
0.0333 |
| Netherlands |
0.1000 |
0.1000 |
0.1000 |
0.3000 |
0.1667 |
0.1667 |
0.0667 |
| YAR |
0.0667 |
0.0667 |
0.1000 |
0.1667 |
0.2000 |
0.2000 |
0.2000 |
| U.S.A. |
0.0333 |
0.2333 |
0.0667 |
0.1667 |
0.2333 |
0.2667 |
0.0000 |
| Other Countries |
0.3000 |
0.0667 |
0.1000 |
0.0333 |
0.1667 |
0.0333 |
0.3000 |
The remaining countries such as UK and YAR had the retention of 23.33 and 20.00 per cent of its original share, respectively. This implied that UK and YAR were not stable importers of mango pulp because they did not retain their share even though the quantity imported by UK and YAR was higher. However, countries which imported mango pulp in less quantity from India were pooled under the ‘Other’ countries showed moderate stability, which retained 30.00 per cent of its original share. These results are in line with the findings of Kumaresh and Sekar (2013).
The major gainer among importers of Indian mango pulp over a period of time has been YAR, which has a transfer probability of 0.1379 from Saudi Arabia, 0.1000 from UAE, 0.1667 from Netherland, 0.2333 from USA and 0.1667 from other countries. The probability that YAR would gain in the export share of Indian mango pulp over the study period at the cost of Saudi Arabia, UAE, Netherland, USA and other countries would be 0.1379, 0.1000, 0.1667, 0.2333 and 0.1667, respectively.
Netherland could retain its original share of 30.00 per cent and gained 3.45 per cent from Saudi Arabia, 10.00 per cent from UK, 20.00 per cent from UAE, 16.67 per cent each from YAR and USA and 3.33 per cent from other countries. United Kingdom sustained its original share of 23.33 per cent and gained 13.79 per cent from Saudi Arabia, 16.67 per cent from UAE, 10.00 per cent from Netherland, 10.00 per cent from YAR, 6.67 per cent from USA and 10.00 from other countries. Whereas it lost 13.33 per cent to Saudi Arabia, 30.00 per cent from UAE, 10.00 per cent from Netherland, 16.67 per cent from USA and 6.67 per cent to other countries. Therefore, UK lost about 76.67 per cent and retained the rest. UAE had retained its original share of 33.33 per cent and gained 30.00 per cent from UK, 10.00 per cent from Netherland, 10.00 per cent from YAR, 6.67 per cent from USA and 10.00 per cent from other countries. Whereas it lost 6.67 per cent from Saudi Arabia, 16.67 per cent from UK, 20.00 per cent from Netherland, 10.00 per cent from YAR, 10.00 per cent from USA and 3.33 per cent from other countries.
USA sustained its original share of 26.67 per cent and gained 3.45 per cent from Saudi Arabia, 16.67 per cent from UK, 10.00 per cent from UAE, 16.67 per cent from Netherland, 20.00 per cent from YAR and 3.33 per cent from other countries. On the other hand, it lost 73.34 per cent share from other export destinations. Therefore, USA lost totally about 73.34 per cent and retained the rest. Saudi Arabia has the highest retention among all importing destinations. It sustained 31.03 per cent of its original share and gained 13.33 per cent from UK, 6.67 per cent from UAE, 10.00 per cent from Netherland, 6.67 per cent from YAR, 3.33 per cent from USA and 30.00 per cent from other countries. Other countries retained its original share of 30.00 per cent and gained 34.48 per cent from Saudi Arabia, 6.67 per cent from UK, 3.33 per cent from UAE, 6.67 per cent from Netherland, 20.00 per cent from USA. Contrary to this, they lost 30.00, 6.67, 10.00, 3.33, 16.67 and 3.33 per cent to Saudi Arabia, UK, UAE, Netherland, YAR and USA, respectively. Therefore, the total loss of other countries was 70 per cent. Among importing countries, Saudi Arabia, UK and UAE were the major markets for Indian fresh mango and mango pulp. Though a larger proportion of Saudi Arabia, UK and UAE share was diverted to some other nations in both mango and mango pulp. This was indicative that both European and Gulf countries were the most potential markets of Indian fresh mango and mango pulp and India needs to hold its share intact for the recent competition from other countries. Similar results were also found by Prakash (2012) while analyzing export potential of grapes from northern Karnataka through Markov Chain Analysis.
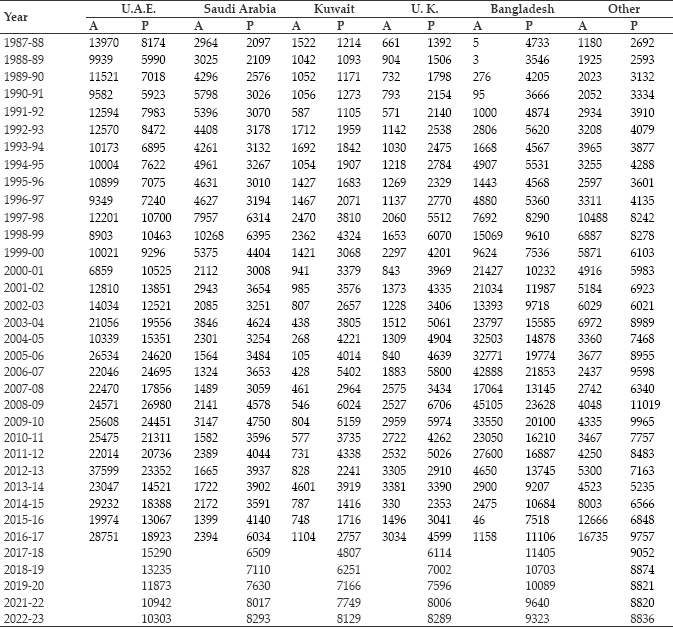
Using the one-step transitional probability, shares of major importers of Indian mango were estimated and same were compared with observed export shares (Table 3). A close look at the observed and expected shares in all the countries has revealed that the differences were by and large small. The calculated chi square (39.17) was less than the table value (174.10) at 145 degrees of freedom indicating that the observed and predicted proportions of exports of mango are identically distributed. That means, the observed proportions of export shares are consistent with the predicted shares of exports which are derived from the Markov process validating the use of Markov chain model for estimating the shares of different countries by using transitional probabilities. It was clear that UAE was the major importer of Indian fresh mango. UAE the major importer in 1987-88 with about 68.81 per cent share in the total Indian exports is maintaining its status as major importers of Indian mango. However, a sharp decline of UAE export share during trans-WTO phase was seen due to diversification of trade. The lost share of UAE was mostly absorbed by Bangladesh during trans-WTO phase but at present, again UAE maintained its status of being the major importer with 54.07 per cent share during 2016-17. The expected shares of UAE, estimate based on Markov model for different years was almost nearer to the observed values for most of the years indicating the validity of the fitted model. Regarding the quantum of exports of fresh mango from Table 4, the actual value increased from 13970 MT to 28751 MT. The estimate for 2022-23 is likely to decline by 10303 MT.
Table 3: Country wise observed and predicted share (%) of quantity of mango export from India
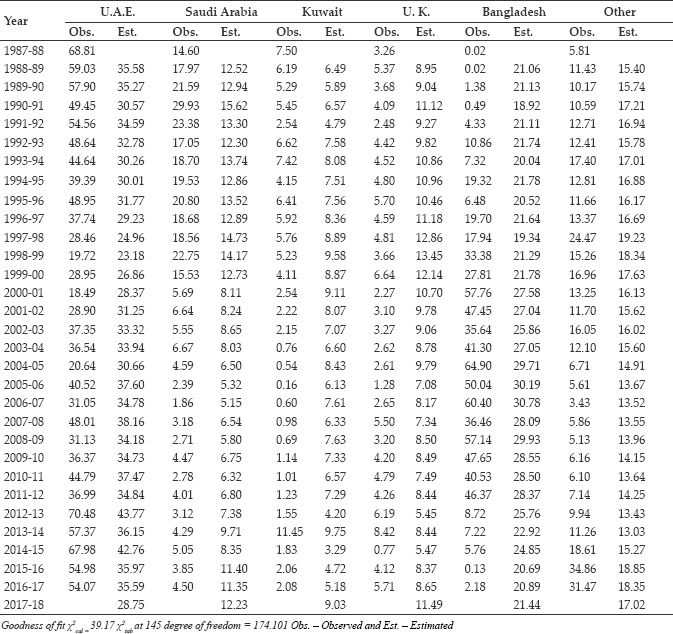
Regarding Saudi Arabia (Table 3) the actual and predicted export share showed a decreasing trend from 14.60 per cent to 11.35 per cent and 7.50 to 2.08 per cent respectively from 1987-88 to 2016-17. The actual quantum of exports (Table 4) shown an erratic trend during study period but predicted value was increasing. The estimation for 2022-23 is likely to increase from 6034 MT (2016-17) to 8293 MT (2022-23). The similar findings for Saudi Arabia and UAE were observed by Kusuma and Basavaraja (2014) and Tirlapur et al. (2014) for mango export from India.
The actual proportion of Kuwait market share of imports from India showed a declining trend from 7.50 to 2.08 per cent. The predicted export share is also decreasing from 6.49 per cent to 5.18 per cent over the study (Table 3). The actual quantum of exports also followed a similar trend while predicted quantum of exports showed the rising trends. The estimation for 2022-23 suggested an increase from 2757 MT in 2016-17 to 8129 MT (Table 4). With regard to UK, the actual market share of India’s fresh mango exports increased from 3.26 per cent to 5.71 per cent whereas the predicted share more or less remained the same from 8.95 to 8.65 per cent from 1987-88 to 2016-17 (Table 3). But regarding the export quantum, both actual and predicted exports observed an increase. The estimation is also likely to decrease from 4599 MT to 8289 MT during the study period (Table 4).
The quantum of mango export was very fluctuating in nature especially for country like Bangladesh.
Table 4: Actual and predicted quantity of mango export from India to its major trading partners (Qty. in metrictonnes)
Note: A- Actual exports. P- Predicted exports.
The actual proportion of exports share of India’s mango exports to Bangladesh (Table 3) showed an increasing trend of 0.02 to 2.18 per cent and the prediction from 21.06 per cent 20.89 per cent. But it was observed from Table 4 that the actual quantity of exports increased from 4.7 MT to 1158 MT and the prediction also increased from 4733 MT to 11106 MT during 1987-88 to 2016-17. But the estimation was likely to decrease from 11106 MT in 2016-17 to 9323 MT in 2022-23.
Considering the other imports, both the actual and predicted exports shares increased during the study period. The actual share increased from 5.81 per cent to 31.47 per cent and the predicted export share of India’s export share to others also increased from 15.40 per cent to 18.35 per cent (Table 3). The quantum of export witnessed a similar picture. The prediction for 2022-23 was expected to decrease slightly from 9757 MT in 2016-17 to 8836 MT (Table 4).
There are some differences in observed and expected exports shares in few years in countries like Bangladesh and ‘other countries’ which are mainly due to limitation of the model that the present estimates depend only on the previous year’s observation (Murthy and Subrahmanyam, 1999).
Export market projections for quantity of mango pulp export
As it could be seen from Table 5, the calculated chi-square (χ2) of 19.29 was less than the table value at 174 degrees of freedom (205.77) indicating identical distribution of the actual and estimated values. Thereby, the actual shares of exports are consistent with the predicted export shares. This validates the use of Markov chain approach for forecasting the future export volume of all the major importing countries from India. It is clear that the actual share of Saudi Arabia in mango pulp export has shown less fluctuation over the study period (1987-88 to 2016-17) but on the whole, it has increased from 19.00 to 23.95 per cent. Similar trend was in prediction of export share too, where the increase was from 20.06 to 21.51 per cent. The estimation for the year 2022-23 showed that there would be slight decline in quantum of exports in the upcoming five years. Regarding the quantum of exports (Table 6) of mango pulp, the actual value increased from 4547 MT to 32483. The estimate for 2022-23 is likely to decline by 20143 MT.
Regarding UK, the actual and predicted export share showed a decreasing trend from 17.43 to 8.19 per cent and 12.52 to 11.34 per cent, respectively from 1987-88 to 2016-17 (Table 5). From Table 6, it can be observed that the actual and predicted quantum of exports showed an increasing trend during study period. The estimation for 2021-22 also is likely to increase from 15376 MT (2016-17) to 19240 MT (2021-22).
With regard to UAE, the actual market share of India’s fresh mango exports decreased from 13.90 to 6.17 per cent whereas the predicted share decreased from 13.03 to 10.55 per cent from 1987-88 to 2016-17 (Table 5). But regarding the export quantum, both actual and predicted exports observed an increase. The projection is also likely to increase from 141313 MT to 19177 MT from year 2016-17 to 2021-22 as seen in Table 6.
Table 5 showed that the actual proportion of Netherland market share of imports from India showed a rising trend from 5.24 to 10.14 per cent. The predicted export share more or less remained same over the study. The actual and predicted quantum of exports followed the rising trend. The estimation for 2021-22 suggested a increase from 13285 MT in 2016-17 to 19007 MT (Table 6).
The actual and predicted proportion of exports to YAR more or less remained the same for the whole study period. The actual quantity of exports (Table 6) increased from 2946 to 16708 MT and the prediction also increased from 3111 to 20168 MT during 1987-88 to 2016-17. But the estimation is likely to decrease from 20168 MT in 2016-17 to 19418 MT in 2021-22.
The actual proportion of exports share of India’s mango exports to USA showed a decreasing trend of 4.44 per cent to 3.86 per cent and also the prediction from 9.81 per cent 9.17 per cent. But the actual quantity of exports increased from 1063.7 MT to 5233.2 MT and the prediction also increased from 2488 MT to 12436 MT during 1987-88 to 2016-17. The estimation is also likely to increase from 12436 MT in 2016-17 to 18342 MT in 2021-22. Considering the other imports, both the actual and predicted exports shares increased during the study period. The actual share rose from 27.68 to 35.37 per cent and the predicted export share of India’s export share to others also increased from 20.76 per cent to 22.76 per cent. The quantum of export witnessed a similar picture. The prediction for 2021-22 is expected to decline substantially from 30870 MT in 2016- 17 to 202910 MT.
Table 5: Observed and estimated shares (%) of mango pulp exports from India
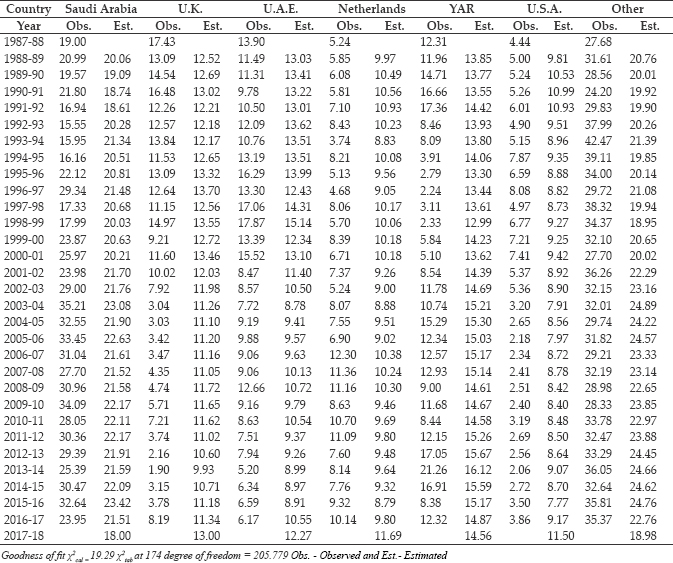
As discussed earlier, there are some differences in observed and expected exports shares in few years in countries which are mainly due to limitation of the model that the present estimates depend only on the previous year’s observation (Murthy and Subrahmanyam, 1999).
The analyses of Transitional Probability Matrix of fresh mango and mango pulp exports from India revealed that the country’s export share to UAE showed erratic trend i.e.it was 68.81 per cent during 1987-88 and decreased to 54.07 per cent by 2016-17 in case of mango. Similar trend was also noticed in mango pulp, its share declined from 13.90 to 6.17 per cent (from 1987-88 to 2016-17) although quantity of export was increasing (Table 3 & 4). This was due to the fact that though UAE is the potential growing market for India’s fresh mango, and mango pulp did not remain loyal importer, may be due to stiff competition by other countries like Thailand. Indian mango exports to Hong-Kong also faced similar problems by Pakistan and Sri Lanka as indicated by Mamale (2001) in his study of export potential of mangoes from northern Karnataka. The predictions in Table 4 and Table 6 revealed that UAE will be the largest importer of Indian mango and Saudi Arabia will be the largest importer of mango pulp from 2017- 18 up to 2021-12. The share of Saudi Arabia, Kuwait and UK in fresh mango and in mango pulp share of UK, UAE, Netherland and USA predicted to rise from existing level. It appears that India needs to strive to improve its export shares to these three major importers by improving upon the quality of mango exports and also by improving the yield levels (Kusuma and Basavaraja, 2014). Besides, in order to avoid dependency on a few markets, there is a need to identify the consumer’s preferences of the new markets where India’s export shares are likely to increase.
Table 6: Actual and Predicted quantity of mango pulp export from India to its major trading partners (Qty. in metric tonnes)
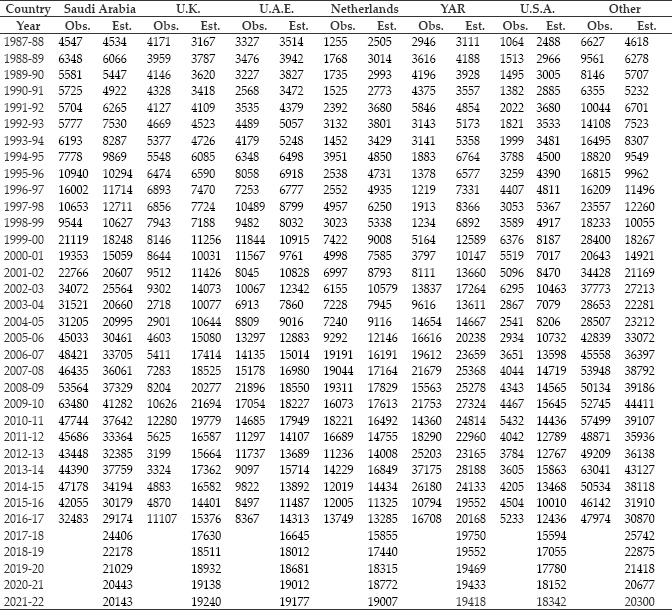
Note: Obs. — Observed and Est. — Estimated.
Destination pattern of fresh mango and mango pulp exports
Indian fresh mango is the most sought fresh agricultural commodity in overseas markets. The results revealed that (Table 7) during pre-WTO period, UAE (52.4 %) and Saudi Arabia (20.4% share), were India’s major trading partners in terms of export volume. In fact, UAE single-handedly accounted for 49.8 per cent of total export value of Indian mango, followed by Saudi Arabia (20.1 %), Kuwait (7.7 %), UK (6.5%) and Bangladesh (2.5%).
Table 7: Destination pattern of Indian mango exports during pre-WTO phase
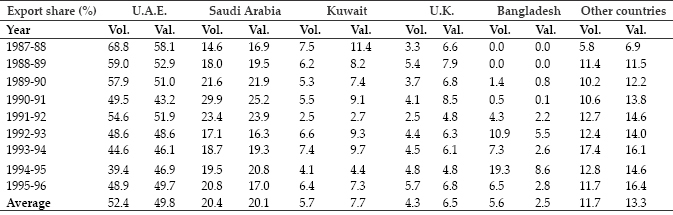
Note: ‘Vol.’ refers to volume of exports and ‘Val.’ refers to value of exports.
Table 8: Destination pattern of Indian mango exports during trans-WTO phase
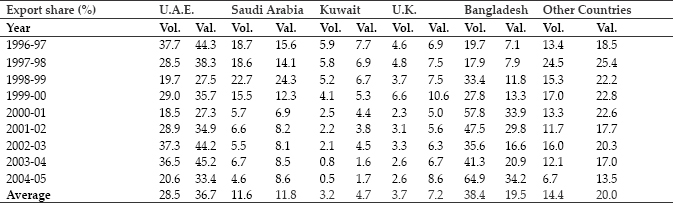
Note: ‘Vol.’ refers to volume of exports and ‘Val.’ refers to value of exports.
Despite visible expansion in India’s mango exports in the WTO transition phase, the share of UAE heavily decreased to around half (28.5% in export volume and 36.7 % in export value) of its pre-WTO imports as it could be seen in Table 8 The strict enforcement of quality standards along with competition from other exporters resulted in significant reduction of Indian mango exports to these countries in both quantity and value terms. With the alarming qualitative restrictions of the traditional importing countries, India’s exports started reaching new destinations like Bangladesh with 38.4 per cent (highest) volume share and 19.5 per cent value share and other countries with 14.4 per cent and 20.0 per cent share in volume and value, respectively (Table 8). During transition phase in mango export, share of UAE declined heavily and is more diverted to the markets like Bangladesh, UK and other countries.
In the post-WTO period, UAE again became the largest importer in terms of volume and value, followed by Bangladesh (Table 9). Even with Bangladesh, though the share of export volume shrunk to 30.2 per cent, the share of export volume improved to about 25 per cent, when compared to that of 5.6 per cent in the pre-WTO period. At the same time, the traditional market like Saudi Arabia was found to be unreliable for Indian mango exports in terms of both quantity and value. On the other hand, export volume and value shares of UK remained more or less the same in all the three periods. The share of Kuwait in terms of export volume and export value declined throughout the study period. Thakor (2019) also reported that around 15 per cent of mango exports in terms of value went to United Arab Emirates, while around 12 per cent shipped to the Saudi Arabia followed by Kuwait and UK during 2017.
Mango is consumed as fresh as well as in processed forms. In India, less than 5 per cent of the produced mangoes are processed and mango pulp is the main export product both in terms of volume and value. The demand for mango in the world market is increasing day by day. It is reported that the markets for mangoes have increased in temperate countries because of social change and promotion of fruit trade in developing countries Kumaresh and Seker (2013).
Table 9: Destination pattern of Indian mango exports during post-WTO phase
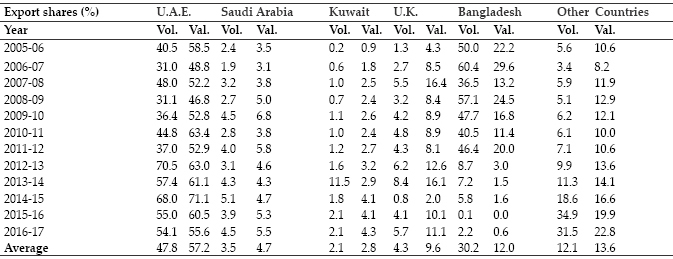
Note: ‘Vol.’ refers to volume of exports and ‘Val.’ refers to value of export.
Table 10: Destination pattern of Indian mango pulp exports during pre-WTO phase
Note: ‘Vol.’ refers to volume of exports and ‘Val.’ refers to value of exports.
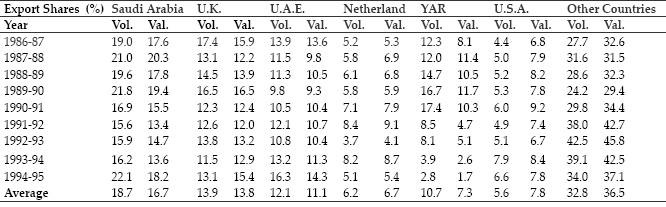
Export of mango pulp is more widely distributed when compared with fresh mango export. During pre-WTO phase, Saudi Arabia was the highest importer of mango pulp in terms of volume (18.7%) and value (16.7%), followed by UK, UAE, YAR and Netherland. On the other hand the share of other countries was 32.8 per cent in volume and 36.5 per cent in value of export (Table 10).
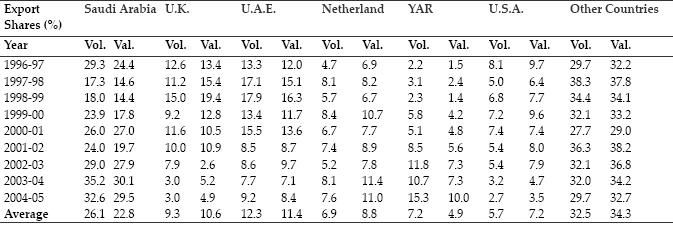
Demand for mango pulp widely changed during trans-WTO phase when compared with pre-WTO period. During trans-WTO, the share of Saudi Arabia and Netherland share increased and together they contributed about 30 per cent in total import in both volume and value term. On the other hand, countries like United Kingdom and Yaman Arab Republic showed a declining trend in percentage share. Per cent share of UAE, USA and other countries more or less remained same during trans-WTO phase (Table 11).
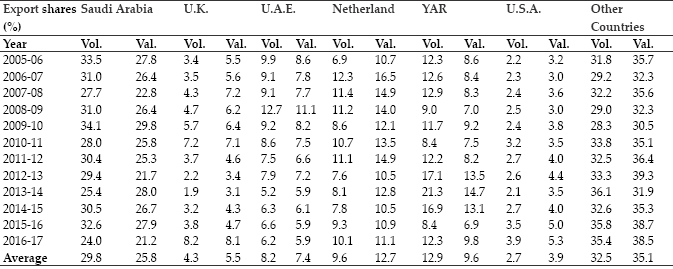
After WTO, the share of YAR, Saudi Arabia and Netherland increased and was the highest in both volume and value among all the three periods. On the other hand UK, UAE and USA share declined in this period. During all the three periods, the share of other countries remained the same and also it could be seen from Table 12 that other countries alone contributes about 30 per cent in total import during all three periods in terms of both volume and value.
Table 11: Destination pattern of Indian mango pulp exports during trans-WTO phase
Note: ‘Vol.’ refers to volume of exports and ‘Val.’ refers to value of exports.
Table 12: Destination pattern of Indian mango pulp exports during post-WTO phase
Note: ‘Vol.’ refers to volume of exports and ‘Val.’ refers to value of exports.
CONCLUSION AND POLICY IMPLICATIONS
UAE and Kuwait were the most stable markets for Indian fresh mango export while most of the export markets are moderately stable; however, UAE was one of the most stable countries among major importers of Indian mango pulp. The UK was major looser among countries and lost about 76.67 per cent and retained the rest. The major gainer among importers of Indian mango pulp has been YAR gained from Saudi Arabia, UAE, Netherland, USA and from other countries. It was predicted that quantum of mango export for countries like Saudi Arabia, Kuwait and UK are expected to increase while quantity exported to UAE, Bangladesh and other countries are expected to decline from the year 2016-17. On the other hand, for mango pulp, forecasting revealed that in terms of quantity of pulps export to UK, UAE, Netherland and USA would rise and quantity exported to Saudi Arabia, YAR and other countries would decline. UAE and Kuwait for fresh mango and Saudi Arabia, UAE and Netherland for mango pulp were important markets, need more concentration on export promotion to tap the potential. The existing processing units should be strengthened by providing access to information on modern technology, packaging, markets, food laws and hygiene requirements of different markets. Keeping in view the role of export in raising the producers’ income, there is also a need to give free export consultation to these enterprises.
REFERENCES
Anonymous. 2011. Agricultural & Processed Food Products Export Development Authority database. Available at: www.apeda.gov.in. Accessed on: 28th August, 2017.
Anonymous. 2015. Agricultural & Processed Food Products Export Development Authority database. Available at: www.apeda.gov.in. Accessed on: 22nd August, 2017.
Anonymous. 2019. Agricultural & Processed Food Products Export Development Authority database. Available at: www.apeda.gov.in. Accessed on: 28th July, 2019.
Bisht, A. Singh, R. Gangwar, A. and Singh, O.P. 2015. Export of Fruits from India: Growth, Pattern and SPS Issues. Economic Affairs, 60: 339-346.
Kumaresh, K. and Sekar, C. 2013. Export performance and competitiveness of fresh mangoes and mango pulp in India. International Journal of Commerce and Business Management, 6: 154-159.
Kusuma, D.K. and Basavaraja, H. 2014. Stability analysis of mango export markets of India: Markov chain approach. Karnataka Journal of Agricultural Sciences, 27: 36-39.
Mamale, D. 2001. Export potential of mango in Northern Karnataka-An econometric analysis. An unpublished Ph.D. Thesis, submitted to University of Agricultural Sciences, Bangalore (India).
Manjunath, N. Lokesha, H. and Jagrati D.B. 2017. Direction of trade and changing pattern of Indian marine products exports. Indian Journal of Agriculture Research, 51: 463-467.
Murthy, D.S. and Subrahmanyam, K.V. 1999. Onion exports markets and their Stability for increasing India’s exports: Markov chain approach. Agricultural Economics Research Review, 12.
Padmanaban, K. Mishra, P. Sahu, P.K. and Havaldar, Y.N. 2014. Export of cashew kernel from India: its direction and prediction. Economic Affairs, 59: 521-527.
Prakash, M. 2012. An economic analysis of export potential of grapes from Northern Karnataka. An unpublished Ph.D. Thesis, submitted to UAS, Dharwad, Karnataka (India).
Thakor, N.J. 2019. Special Indian mango production and export Scenario, Advanced Agricultural Research & Technology, 8: 80-88.
Tirlapur, L.N., Navalpur, N.P. and Patil, B.O. 2014. Status of Indian mangoes: A trend analysis. International Journal of Commerce and Business Management, 7: 396-399.