
Economic Affairs, Vol. 65, No. 2, pp. 137-150, June 2020
DOI: 10.46852/0424-2513.2.2020.2
Agrarian Change in Telangana: A Discussion on Policy Options
ABSTRACT
The paper examined the inclusiveness of strategies for increasing farmers' incomes in Telangana from the last two decades by using various government reports and statistical abstracts of the Telangana state. Telangana agricultural sector is in a transition from cereal based cropping systems to commercial crops based cropping systems with larger contribution from fruits and vegetables and commercial crops like cotton and soybean. The commercialization of agriculture resulted in high input-high output-high risk agriculture, where in small and marginal farmers are not able to cope with and ultimately end up in huge debt with higher cost of production. Further, faster farm mechanization in the recent years, resulted in increased scale economies with small farmers getting less profit compared to large farmers per unit area. The tenant farmers are especially at risk in the event of yield loss or output price reduction, as they have to pay tenancy fee of about 30% of the average farm returns, even though their yields are lower than average. Remedy is livestock sector, now its contribution is equal to crop sector to gross state domestic product. If an average agricultural household to cross poverty line, he has to have 4.41 hectare of land in Telanagana.
Highlights
 Farm mechanization increased across farm size groups.
Large farms are more profitable than small farmers per unit area.
Farmer's producer companies/cooperatives need to be encouraged.
Crop insurance needs to be encouraged.
Keywords: Agrarian change, agrarian policies, farmer's income, India
The Telangana state is a newly formed state and majority of the rural population depends on agriculture in the state. Telangana economy is largely dependent on big conglomerate city Hyderabad which is a hub for not only information technology, but also real estate, construction, manufacturing and pharmaceutical companies, although majority of the population dependent on agriculture and allied activities for their employment, income and livelihoods. There was growing disparity of people living in urban centres and rural areas which was reflected in increased farm distress and large number of farmers suicides by farmers (Reddy and Bantilan, 2013; Reddy et al. 2014). About 86% of the farmers are small and marginal with very limited asset base, their costs are increased but the increase in returns are much below the increase in costs, resulted in reduction in the net returns, increase in indebtedness and farm distress (Chand and Srivastava, 2016; Joshi et al. 2004). The cost structure ofcrops is in a transition stage from the subsistence to commercial agricultural with rapid mechanisation, more dependent on casual labourer and hired services in most of the agricultural operations staring from land preparation to harvest (Radhakrishna Report on Andhra Pradesh; Reddy and Singh, 2015). Although paddy is a major crop, diversification towards cotton and horticultural crops (now horticulture contributes to 40% of the total agricultural value of production) and livestock is playing a significant role in agricultural growth of the state. The recent structural changes with high demand push to high value crops like horticultural crops, meat, milk and other animal products is the driving force behind the rapid changes in Telangana agriculture. Growing regional disparities within states with more farmer distress in backward districts were observed by many studies (Reddy, 2011; Reddy and Kumar, 2006; Reddy, 2015). Keeping this, the paper examined changes in the farmers situation not only in crop sector but also in horticulture and livestock sector to understand the impact of changes in the agrarian economy on farmers' incomes and livelihoods in Telangana. The specific objectives of the paper are:
How to cite this article: Reddy, AA. (2020). Agrarian change in Telangana: A discussion on policy options. Economic Affairs, 65(2): 137-150.
Source of Support: None; Conflict of Interest: None
MATERIALS AND METHODS
The data was collected from various government statistical publications. Mainly season and crop reports of Directorate of Economics and Statistics, and Statistical Abstract of Government of Andhra Pradesh and Situation Assessment Survey of National Sample Survey Organisation have been used (NSSO, 2013). The data for the study mainly covers from 1990 to 2015-16 depending on the availability on the various parameters. This study covers changes in land use pattern, farmer's situation in terms of sources of incomes, crop returns and indebtedness. All the ten districts were considered while analysing major indicators of development and agrarian change including land use pattern, area, production and yield and gross value of output. The data pertaining to the districts of Rangareddy and Hyderabad were pooled and presented under Ranga Reddy district for some variable wherever the data was a time series spanning from 1970s.
RESULTS AND DISCUSSION
Telangana state is predominantly rural with 61.12% of the population lives in rural areas and mostly depends on agriculture. In the state, share of agricultural sector in State Gross Domestic Product (SGDP) was 13%, while share of services was 61% and the remaining 22.5% was contributed by industry. The crop sector and livestock contribution is equal at 5.9% of SGDP each. Within crop sector horticulture contributes to 40%. Small and marginal farmers share was 86% in total cultivators, their incomes are meagre from crop sector, hence there was a proletarianization of small farmers in the last decade in addition to feminization of agriculture.
Telangana macro-economic trends
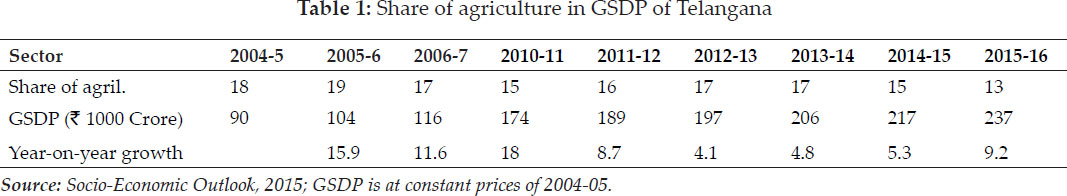
The gross state domestic product increased significantly over the last ten years from 2004-05 to 2015-16 from 90 thousand crores to 237 crores in constant prices. The share of agriculture in Gross State Domestic Product (GSDP) of Telangana was reduced to 13% in 2015-16 (Table 1). Year-to-year growth in GSDP is erratic. The declining share of agriculture is a good sign, if the growth in employment intensive secondary sector absorbs surplus labour. But the growth in employment in the rural non-farm sector is subdued to absorb the labour released from agricultural sector.
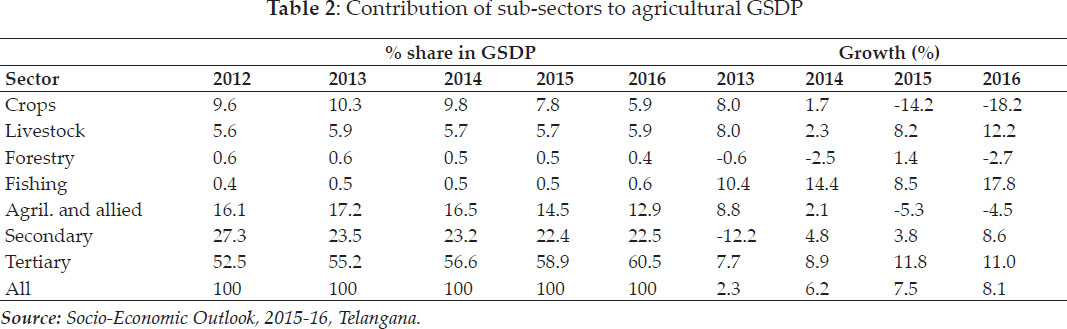
The declining share of agriculture is also accompanied by a structural shift within agricultural sector. Share of crop sector was decreased from 9.6% of GSDP in 2011-12 to 5.9% of GSDP in 2015-16 mainly driven by the declining area under food crops with simultaneous increase in area under horticultural and commercial crops like cotton. Now horticulture contributes to about 40% of the crop sector (Table 2). In year 2015-16 livestock sector contribution is equal to that of crop sector (5.9% of the GSDP) mostly driven by the increase in demand for goat and sheep meat, poultry and milk products. During the drought year's (2014-15 and 2015-16) crop sectors contribution is drastically reduced, but livestock and fisheries sector contribution is stable or increased. Given that the Telangana agriculture is mostly dependent on monsoons, it is advisable to encourage livestock farming by the farmers not only to adopt and mitigate the impact of the bad monsoons but also to create employment among small and marginal farmers and also agricultural labourer. Performance of tertiary sector is much better and stable with year-on-year growth never below seven percent from 2012-13. Now the tertiary sector contributing to about 60.5% of GSDP, but it is not a major employment provider for the persons who are withdrawing from agricultural sector as it is more skill intensive with less number of jobs. The secondary sector growth is subdued, but better than the agricultural sector and now it contributing to about 22.5 % of the GSDP. Within secondary sector construction sector contributed higher share followed by manufacturing.
Cropping pattern change
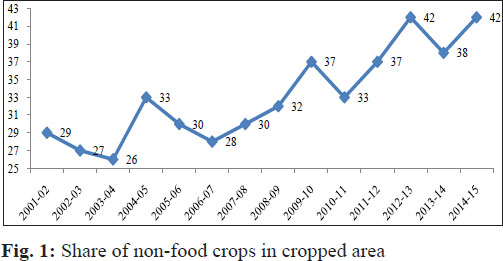
In the past decade there was an increase in share of area under non-food crops in total cropped area across all districts. The area under non-food crops increased from 26% in 2003-04 to 42% in 2014-15 (Fig. 1). It is mainly driven by the expansion of area under cotton due to the introduction of Bt cotton varieties and red chillies in some districts.
The cotton area increased even in dry lands, farmers attracted for the huge returns due to cotton cultivation and expanded cotton area under irrigation by digging new bore wells to reap higher productivity. However, expanding area under Bt cotton and chillies also increased risk infarming to most of the small and marginal farmers. Cotton and chillies are high cost-high return-high risk crops, which brings in disaster for small and marginal farmers who did not have risk bearing ability.
Most of the irrigated-dry lands were converted to non-food crops (cotton, red chillies) during the past decade, mostly in districts like Adilabad, Nalgonda, Warangal and Mahabubnagar. However, farmers prefer to grow paddy wherever secured water source is available from ponds and canals.
Cotton (33% of cropped area), paddy (28%) and maize(14%) are major crops in Telangana. Pulses occupy about 8.4% of the gross cropped area, predominant pulse crop is redgram with 4.4% of GCA. Food grains (cereals plus pulses) occupy about 52.4% of GCA. Oilseeds occupy 9.6% of GCA, mainly contributed by newly introduced soybean(5.4%) and traditional groundnut (2.4%). Cotton is a major single crop occupying largest area in Telangana with 32.7% of GCA. Among spices, red chillies are prominent which occupy about 1.5% of GCA.
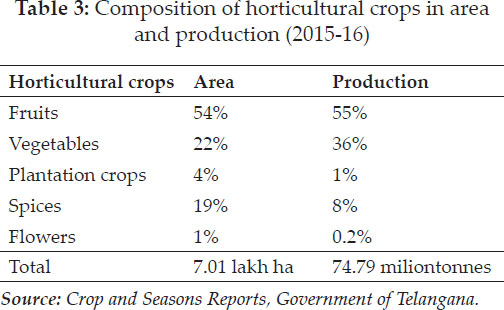
Although share of horticulture area in gross cropped area was only 14%, it contributed to 40% of the crop value added in Telangana in 2015-16. As per the 1st Advanced Estimates, horticulture crops are grown in an area of 7.01 lakh hectares in 2015-16 producing about 74.79 MTs output (table 3). Of the total horticulture cultivated area, fruits constitute around 54.5%, followed by vegetables and spices with 22.2% and 19.1% respectively. Floriculture constitute about 0.4% of area under horticulture. Out of the total production of horticulture in 2015-16, fruits constitute around 55% followed by vegetables, spices and flowers with 36%, 8% and 0.2% respectively. Out of the total horticulture area, highest area is covered by mango 29%, followed by mosambi 19%. Among vegetable crops, tomato and onion cover around 33% and 15% of the area respectively and 39 % and 16%of production under vegetable. Among spices, the turmeric and red chilli cover around 41% and 31% of the area and 55% and 20% of production respectively. Among flowers, marigold covers around 50% of the area and 65% of production.
Livestock
Livestock contributes to 5.9% of GSDP and its contribution is increasing year after year. Now contribution of livestock to GSDP is almost equal that of the crop sector(including agriculture and horticulture) in terms of value addition Except cattle population, population of all other species increased from 1987 to 2012 (Table 4). There was a much higher growth in buffaloe compared to cattle population especially among female buffalo. When compared to even female buffaloe, growth rate in sheep, goat and poultry are much higher. This is mainly due to increased demand for consumption of meat and milk as consumers income increased over the years.
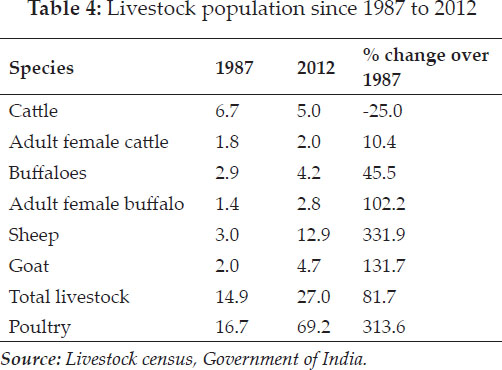
Production of milk increased from 1.9 million tonnes in 2002 to 4.4 million tonnes by 2016, eggs also doubled from 6.1 billions to 11.2 billions, meat increased from 1.9 lakh tonnes to 5.4 lakh tonnes and wool increased from 3.0 million kg to 4.6 million kg during the same period. Now Telangana has become hub for poultry activities in south India. Given the high potential of increasing demand for livestock products in the coming decades, there was a good potential to expand livestock production with semi-intensive production systems in the areas adjacent to urban centres and even in faraway rural areas with sufficient market and road infrastructure.
Increased agricultural labourer and tenant farmers
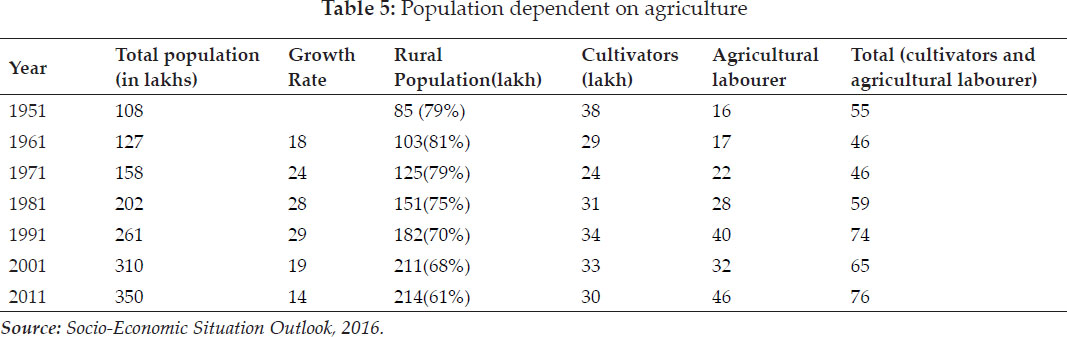
Until 2001, the decadal growth rate of cultivators increased. But between 2001 and 2011 the growth rate was negative, and absolute number of cultivators declined from 33 lakh in 2001 to 30 lakh in 2011, while agricultural labourer increased significantly from 32 lakh to 46 lakh a largest increase in agricultural labourer (Table 5). Most of the agricultural labourer are engaged in tenant farming by leasing-in land from absentee land lards.
Development concentrated around Hyderabad
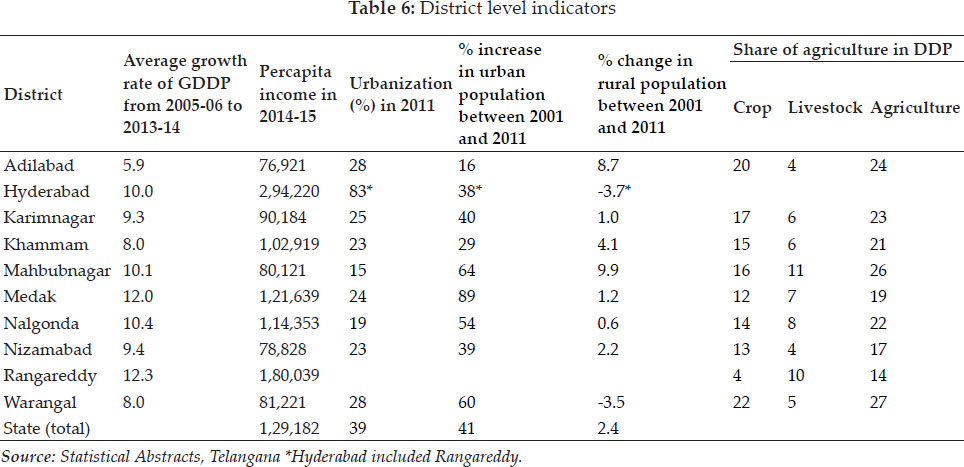
The percapita DDP was much higher in urban centres like Hyderabad (₹ 2,94,220/-) and Rangareddy (₹ 1,80,039/-) compared to state average of ₹ 1,29,182 in year 2014-15 (Table 6). The lowest percapita income was in Adilabad (₹ 76,921/-), Nizamabad (₹ 78,828/), Mahbubnagar (₹ 80,121/-), Warangal (₹ 81,221/-) and Karimnagar (₹ 90,184/-). During the last decade growth rate in GDDP was highest in districts around Hyderabad like Rangareddy,Madak, Nalgonda, with growth rates were less in faraway districts from Hyderabad like Adilabad,Khammam and Warangal. It shows that there was a some backwash effect with the development of hyderabad, which is absorbing skilled manpower and capital from distant districts which is also visible from the migration from the distant rural centres to urban centres mainly to Hyderabad. DDP growth rates were also lower in the districts with larger share of agriculture and less urbanization like xMahabubnagar in spite of nearness to Hyderabad.
Between 2001 and 2011, rural population increased by just 2.4%, where as urban population increased by 41%. This trend is similar in all districts, with Warangal recorded a negative growth which indicating the attractiveness of urban migration and distress situations in rural areas across all districts.
Historically, in Telangana agriculture played a significant role, however its share in GSDP is gradually reduced to just 12-13% in the recent years. Now service sector contributing to up to 61% of GSDP. Within agricultural sector share of livestock was increased and now contributes to about 44% of agricultural and allied sectors.
Proletarianization and Feminization of agricultural labour
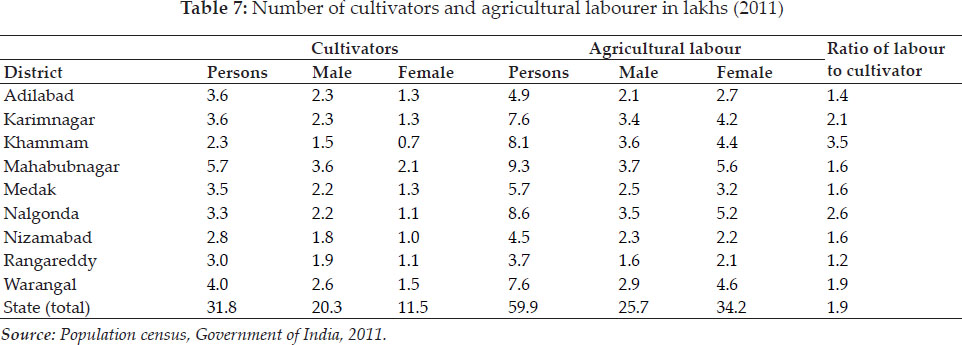
Table 7 presents district wise composition of cultivators and agricultural labourers. As per the population census 2011, there were 91.7 lakh main workers dependent on agriculture in the state, out of which 45.9 workers are male and another 45.7 were female workers (Table 7). There were 31.8 lakh cultivators and 59.9 lakh agricultural labourer. Number of male cultivators (20.3 lakh) was higher than female cultivators (11.5 lakh). But number of agricultural labourer were higher among females (34.2 lakh) compared to men (only 25.7 lakh).
There was reduction in cultivators (9% reduction), but increase in agricultural labourer (27% increase) between 2001 and 2011, indicating proletarianization of cultivators in Telangana. Overall, there was increase in persons dependent on agriculture between 2001 and 2011, but there was significant structural change towards feminization and casualization of agricultural sector. Persons dependent on agriculture increased by 12%, the increase was higher among women (13%) then among men (only 10%). The above figures indicate that there was a clear trend of proleterianization of cultivators during the past decade and also feminization of agricultural labourer.
Increased number of small and marginal farmers
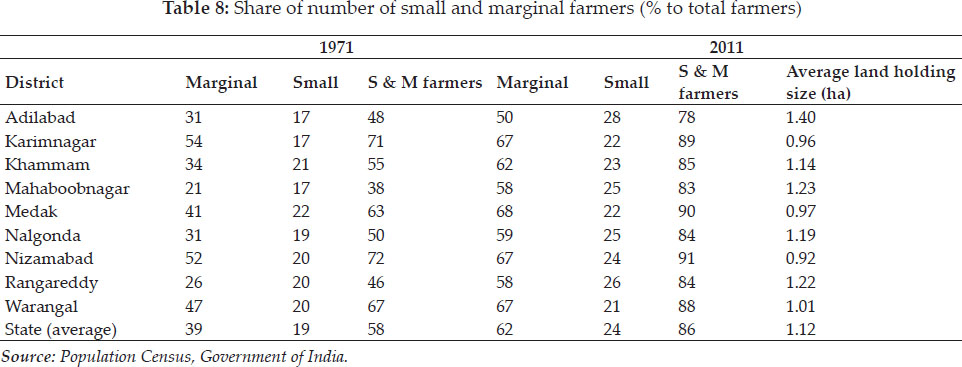
Since 1970s, the share of small and marginal farmers was increased in the total cultivators (Table 8). Now, in Telangana 86% of the farmers are small and marginal based on 2011 census data. Share of marginal farmers was increased from 39% from 1970 to 62% in 2011. And the average land holding is just 1.12 hectares. This also explains the above argument of shifting from cultivation to agricultural labourer.
Changing relationship between Farm size and profitability
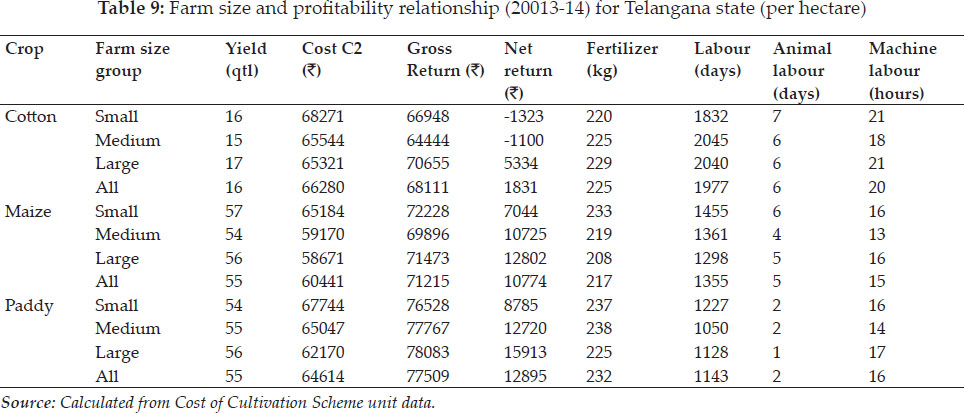
Given that 86% of the farmers are small and marginal farmers, it is important to see the profitability of small farmers in the recent years. We have presented the cost of cultivation and returns in table 9 for the year 2013-14. The results show that there was a tendency of increasing profitability with the increase in farm size among all crops in Telangana. This is mainly due to rapid adoption of cheaper farm machinery in the large farms to replace the human and bullock labour which is becoming costly and scarce in the recent years. Although there was no systematic relationship between farm size and productivity, there was a significant inverse relationship between farm size and cost of cultivation, resulted in increased profitability on large farms. This is a disturbing trend and reason for increased distress among small and marginal farmers. From the above analysis it is clear that small and marginal farmer₹s income are too minuscule from their crops, so they have to depend on non-farm sources of income to sustain their livelihoods. Especially it is very hard for tenant farmers who have to give at least 30% of the produce to landowner.
Income from other sources
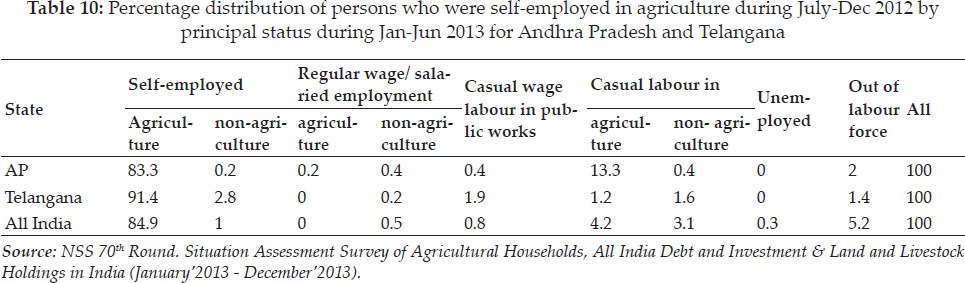
An examination of the employment status of persons of agricultural households shows that other sources of employment and income are meager in Telangana compared to Andhra Pradesh and All-India (Table 10). Self-employed in non-agriculture (2.8%), casual labourer in public works (1.9%), casual labourer in non-agriculture (1.6%) and agriculture (1.2%) are some of the few activities in which persons of self-employed in agriculture engaged during the off-season.
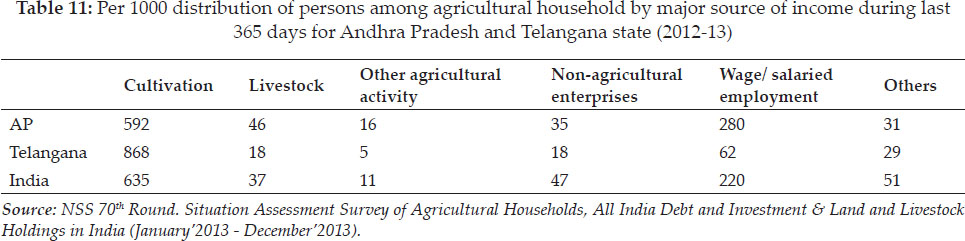
In Telangana, agricultural households engaged in multiple occupations, with majority in cultivation followed by livestock, wage/salaried employment (table 11). However, they are not getting significant income from these multiple sources as they may be engaged in these activities only for a few days or on temporary basis.
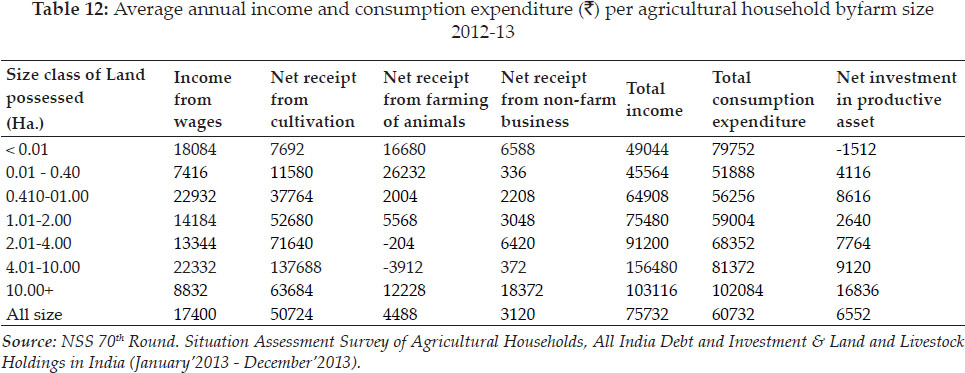
Agricultural households get ₹ 6311 from all sources, of which major income share is from crop cultivation (₹ 4227), followed by wages (₹ 1450), rearing animals (₹ 374) and non-farm business (₹ 260) (table 12). However, income from labour and animal rearing was much higher among marginal farmers, while income from cultivation increased with farm size. Non-farm business income was higher among large farmers. However, even large farmers with more than 10 hectare area were getting average income of just ₹ 13,040.
CROSSING POVERTY MARK
To cross the international poverty line of $1.9 per capita per day, a five-member farm household should get an annual net income of ₹ 2, 25,000, whereas Telangana farmers are getting only ₹ 75,732 as annual income and they spend only ₹ 60, 732 as consumption expenditure. Given that average farmer is getting ₹ 25008 from other sources, his family has to get ₹ 1,99,992 from agriculture, but he is getting only ₹ 50,724 from his average holding of 1.12 ha. If he has to get ₹ 1,99,992 from agriculture, his farm size should be increased to 4.41 ha. It indicates that not only small farmers, even majority of the medium farmers will be below the poverty line, if they don₹t lease-in land with the existing productivity levels.
TRENDS IN INPUT USE (LABOUR, IRRIGATION AND
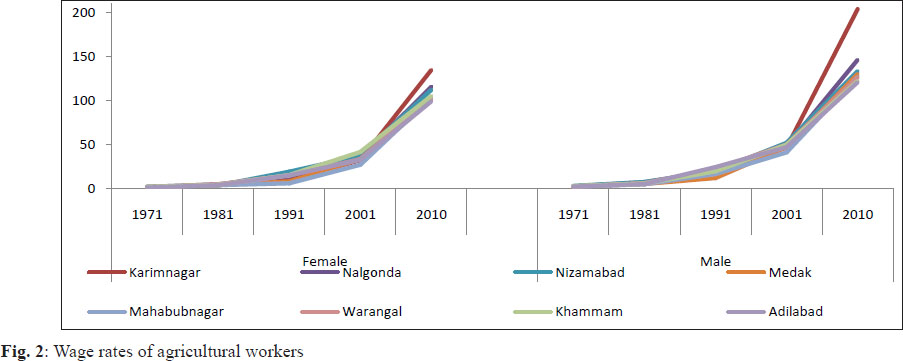
In this section we have examined the labour, irrigation and credit markets. Labour is one of the very important input in agriculture contributing to 20 to 30% of total cost of cultivation. Labour has become scarce in rural Telangana, multiple factors like growing migration to urban centres, MGNREGA, increasing opportunities in construction works as contract labourers within and outside villages, resulted in significant increase in wage rates and scarcity of labour since 2006. To some extent it was leading to the farm mechanization, increased use of tractors and other farm machinery even by small farmers for timely completion of farm operations and also to reduce costs (Fig. 2).
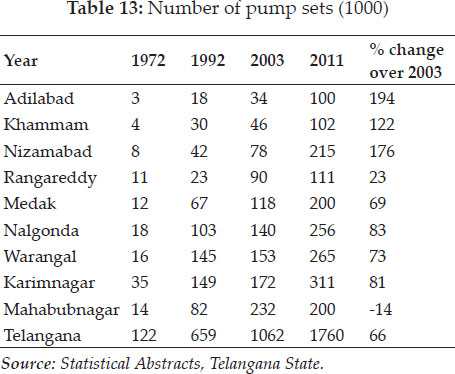
In Telangana, ground water is a major source of irrigation contributing to about 82% of net irrigated area. Number of pump sets is an indication of private investment in agriculture. Number of pump sets increased from 122 thousand in 1972 to 659 thousand by 1992 and further increased to 1062 thousand by 2003 and to 1750 thousand by 2011 (Table 13). The number of pump sets were higher in Karimnagar, Warangal and Nalgonda. But in the recent years growth was higher in Adilabad, Nizamabad and Khammam. After the introduction of Bt cotton in 2002, farmers in backward district like Adilabad also digging bore wells to reap benefits from the Bt cotton cultivation. Alarming increase in pump sets in districts with deep water table is posing a challenge for sustainable water use in Telangana.
Credit and indebtedness
70th Round of the National Sample Survey (NSS) on “All India Debt and Investment Survey” (data collected during January 2013 to December 2013) gives a picture of the credit structure, asset holding, liabilities, capital formation of the households etc.
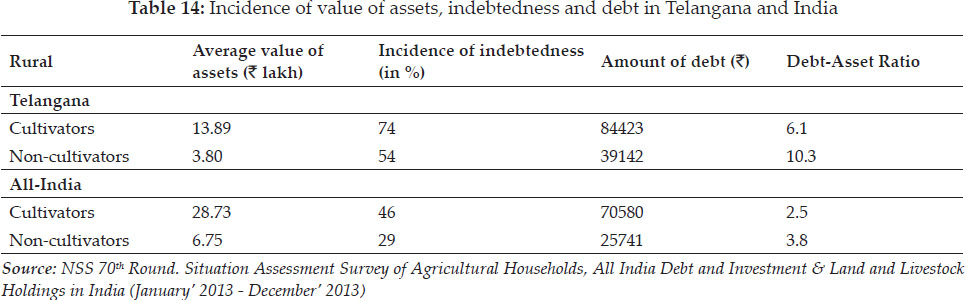
The average value of the asset for cultivator and non-cultivator in the rural Telangana household is ₹ 13.9 lakh and ₹ 3.8 lakh respectively while at all -India level it is ₹ 28.7 lakh and ₹ 6.7 lakh respectively. The average asset value for rural household of Telangana is ₹ 6.38 lakh and that of urban Telangana is ₹ 18.45 lakh, which is 2.9 times higher indicating high inequality between rural and urban population in the State. The Incidence of Indebtedness (IOI) among the households in rural areas of Telangana is twice higher than the IOI of rural All-India. Around 59% of rural household are indebted in Telangana state as against 31% in All-India. Indebtedness is higher among the cultivators as compared to other occupational category; about 74% of cultivators in Telangana are indebted. While the debt asset ratio among the rural and urban areas of Telangana is around 7.95 % and 8.58% respectively, in case of India it is as low as 3.23% and 3.7 % respectively (table 14).
Indebtedness is one of the major problems that farmers face in the State. As per the “All India Debt and Investment Survey” by National Sample Survey (NSS), 74 percent of the total cultivators in the State are indebtedness. The Government of Telangana has announced a one-time crop loan waiver to end the perpetual indebtedness of farmers through the Crop Loan Waiver Scheme. Under the scheme, short term crops loans (including crop loans against gold) taken by farmers from scheduled commercial banks, cooperative credit institutions and regional rural banks and outstanding as on 31.03.2014 are eligible for waiver. The eligible amount for debt waiver is up to ₹ 1 lakh, including loan amount and interest up to 31.08.2014. However, the benefits of the scheme are only realized if there were some efforts to reduce cost of cultivation to farmers through input subsidy etc.
>
Analysis of recent policies
The Ministry of Agriculture and Farmers Welfare recently released the first four volumes of the Report of the Committee on Doubling Farmers' Income (DFI). It answered some key questions such as doubling of real income rather than nominal income, doubling incomes across regions uniformly may not be possible, and the approach should be region-specific with higher growth in less developed States and lower growth in more developed States to reduce regional inequalities (Reddy, 2017 and 2018).
Current farmer's income
An average agricultural household earns income from cultivation, livestock, non-farm business, and wages and salaries. At the national level, this average income is targeted to be doubled in seven years by 2022-23. The aggregate base year₹s (201516) all-India average income of an agricultural household is estimated at ₹ 96,703 at constant (2015-16) prices. The doubling would imply that the average farmer's household income would go up to ₹ 1,93,406 measured at 2015-16 prices. In line with this goal, the government has initiated and strengthened various development programmes such as interest subvention on crop loans, National Food Security Mission, Rashtriya Krishi Vikas Yojana, Accelerated Pulses Production Programme, Soil Health Card Scheme, Pradhan Mantri Krishi Sinchai Yojana, National Agricultural Market for Electronic Trading, National Livestock Mission, and Pradhan Mantri Fasal Bima Yojana (Reddy, 2017, 2017a; 2017b; 2018). All these provide greater flexibility to States to use the funds as per the local requirements, unlike the earlier pan-India uniform programmes. Though these centrally-sponsored programmes are important, Telangana government's programmes including Mission Kakatiya and the proposed financial aid of ₹ 8,000 per acre per year for farmers are also equally important to achieve the goal.
De-risk Diversification
Studies show that diversification to high-value crops such as fruits and vegetables and output prices are main sources of income growth. However, they are also major causes of distress due to high fluctuations in prices. Farmers can gain from diversification only if risk-mitigating strategies are popularised among them. They also need non-exploitative markets for various inputs to facilitate diversification to commercial and horticultural crops. Right seed at the right time at a reasonable cost, availability of fertilizers, micronutrients including bio-fertilizers at cheap rate, custom-hiring centres and farm machinery — all these will lead to increased incomes.
Better management of post-harvest transport, processing, storage, packaging, marketing and price realisation is also required. Minimum support price is now a key policy instrument to support farmers (Darekar and Reddy, 2017). Cotton price forecasting in major producing states. But most of the developed countries and even a few developing ones have already moved to income support policies. India too needs to move to income support policy to meet its national objective of doubling farmers' income by 2022. Without income support policies, this goal cannot be achieved in rainfed and backward districts where the scope for increasing farmers' income is limited.
Tenant and Small Farmers
There is a growing number of tenant farmers, who hardly get any support from the government. About 67% of the farmland is held by small and marginal farmers with holdings below one hectare, while their share in total private agricultural investment is less than 10%.
Even for these small investments, small and tenant farmers depend on informal sources of credit at exorbitant interest rates, which reduces their economic viability. This indicates that there is a need for encouraging private investment among these farmers either through easy credit or through innovative community-PPP mode.
Crossing Poverty Mark
To cross the international poverty line of $1.9 per capita per day, a five-member farm household should get an annual net income of ₹ 2,25,000. Assuming that the farm household gets 40% of income from non-farm sources, still his net returns should be ₹ 1,35,000 from farm sources.
If we consider ₹ 20,000 net income per hectare per season, with two crops per year, the farm household needs to have a minimum of three hectares to cross the poverty line. It indicates that not only small farmers, even majority of the medium farmers will be below the poverty line, if they don't lease-in land with the existing productivity levels.
Non-farm Opportunities
The report states that on average 60% of farmers' income is from the agricultural output (including livestock) and the remaining from non-farm sources. It advises that the ratio of farm to non-farm income should be raised from the existing 60:40 to 70:30 by 2022. This is unrealistic because as the economy develops there would be more opportunities in the non-farm sector rather than in the agricultural sector. Moreover, the assumption of increasing the ratio from 60:40 to 70:30 may not be the right target, given the past experience of Punjab, Haryana, Tamil Nadu and Kerala as with the development of agricultural sector, the ratio of farm to non-farm incomes has decreased significantly rather than increasing. Hence, there should be a strategy to increase non-farm incomes while doubling farmers' income as well.
Public Investment
The DFI report estimated that an additional Rs 6,39,900crore investment is needed for doubling farmers' income. The size of public spending on agriculture and irrigation as a percentage of the GDP should be raised from the existing 2% to 4% as public investment bears a strong relationship with private investment and income. For a targeted 10.41% annual increase in farmers' income, the estimated increase in weighted public investment (together in agriculture, irrigation, rural roads and transport and rural energy) would be 14.17% per year and the private investment has to grow at 8% per year, it said. India can save huge postharvest losses (₹ 35,000 crore per annum assuming a conservative estimate of 15% loss of the total production) by investing about ₹ 1 lakh crore in cold chains among others. This investment can be recovered within three years. Farmers should be made partners in the cold-chain/agri-logistics to enable them to benefit from access to bigger markets and realisation of remunerative prices. Overall, effective implementation of government programmes, farm diversification towards high- value crops, competitive price, enhanced investments and income support should be the strategies for doubling farmers' income.
Policies adopted by Telangana state government
During the past four years, many innovative schemes have been introduced both by Central and State governments with varied rates of success. It is now time to look back and identify schemes, which have the potential to increase farmers' income, to replicate and scale them up nationwide. It is also important to see not just financial allocation, but also design and innovativeness to ensure the desired impact. Below are the some of the important state government schemes for enhancing farmer₹s income.
Rejuvenating Tanks
Minor irrigation sources like tanks were developed, maintained and used for both irrigation and drinking water in India. However, due to lack of maintenance most of them vanished. In Telangana itself of the about 80,000 tanks, only some 46,000 exist now. The Telangana government is implementing Mission Kakatiya to rejuvenate these 46,000 minor irrigation tanks since the last four years. Its impact is visible in improved water table, expanding cultivated area, increasing area under multiple crops and area under remunerative crops like paddy. While rejuvenation works pertaining to 15,649 tanks were completed in three phases, rejuvenation of 5,650 tanks is going on in Phase IV. Many socio-economic impact studies show that not only farmers' income increased significantly, but livelihoods of fishermen and washerman improved as well. The scheme received the appreciation of Central government and Niti Aayog for its effective implementation in terms of reducing costs and farm distress, increasing yields, incomes and profits. It also increased water table in surrounding villages, thereby ensuring water availability in borewells. Now 24-hour free electricity is helping farmers to reap the benefits of this increased water table by expanding the irrigated area under borewells.
Sanitising Land Records
The land records updation and ‘purification₹ (rectification) programme was praised by the chief economic adviser as “heart of good governance”.
The Telangana government conducted an extensive land survey from September 15 to December 15 last year, cleaned land records and uploaded details on the website called Dharani. This facilitates entry of buying and selling of agricultural land in real time, similar to core banking. A total of 71,75,096 farm holdings with a cultivable area of 1,42,12,826 acre was recorded. Based on this land records, fictitious land transactions will be eliminated and the exact land for investment support would be decided.
Farm Investment Subsidy Scheme
Under the Farmers Investment Subsidy Scheme (FISS), money is directly transferred — ₹ 4,000 per acre per season into farmers' hands based on the land records updation programme. The unique feature of the scheme is its universal coverage of each acre of cultivated land. Land records will be seeded with Aadhaar and bank account and geotagged to satellite data to estimate the cropped area of each farmer. It is easy to administer and based on readily verifiable land records data, which is linked to Aadhaar, there is no scope for leakage and corruption. Low profitability of agriculture, rising input costs, low market prices, inadequate and untimely institutional credit and exorbitant interest rates charged by private moneylenders necessitated this investment support. To cover 72 lakh farmers with ₹ 4,000 per acre per season, the government has to spend ₹ 5,685 crore in kharif season. This will save farmers from falling into a debt trap and facilitate purchase of improved seed and fertilizers for higher yields.
Subsidised Sheep
Under this scheme, the State government distributed 45 lakh to over two lakh members of backward communities. Each beneficiary got 20 sheep and a ram. The sheep were also insured, with a separate allocation of ₹ 6 crore. The government also started 100 mobile veterinary clinics with a toll-free number to advise farmers on animal health. Special efforts were also taken to ensure fodder availability, construction of sheds and water tubs by linking the scheme to the Employment Guarantee Scheme. Apart from increasing farmers' income, this scheme will also provide a regular income from the sale of meat and milk.
Coordination Committees
The Telangana Rashtra Rythu Samanvaya Samithi (TRRSS) will be registered as a not-for-profit corporation to support farmers' collective action. It will have village, mandal, district and State-level committees with adequate representation of weaker sections, including women. This is intended to increase collective action by the farmers for better understanding, implementation and better utilisation of government schemes by the farmers and to increase their bargaining power. These committees also promote crop colonies, under which different places are split into crop colonies and federated into State-level to increase the scale of operations. This will enable collaboration and competition with large multinational companies in different agricultural operations like input purchase, contract farming, branding, setting up and maintenance of cold chains and marketing of output.
CONCLUSIONS
Telangana agricultural sector is in a transition from cereal based cropping systems to commercial crops based cropping systems with larger contribution from fruits and vegetables and commercial crops like cotton and soybean. The commercialization of agriculture resulted in high input-high output-high risk for which many small and marginal farmers are not able to cope with and ultimately end up in huge debt with higher cost of production in agricultural sector. Livestock sector growth is also significant, now its contribution is equal to crop sector to gross state domestic product. Telangana agriculture is dominated by small and marginal farmers, whose income from agriculture and allied activities is meager, resulted in most of them shifted to agricultural labourer during the past decade. The number of cultivator₹s decreased and agricultural labourer increased during the past and this change is more among women (Siddeswari, et al. 2020). Farm mechanization increased in the recent years, resulted in increased scale economies with small farmers getting less profit compared to large farmers per unit area. The real problem is as the farm incomes reduced, there was no increase in alternative income sources in rural areas for the farming community. Although many agricultural households engaged in multiple activities like casual labourer, non-farm incomes, but the actual income share from these sources is very limited in Telangana compared to Andhra Pradesh and All-India.
Small and marginal farmers profitability was adversely effected by the rapid spread of farm mechanization, hence there was a need for special programmes to support small farmers' incomes on a long term basis. The input costs are increasing more than gross returns, resulted in decrease in profitability. There was a need for strengthening custom hiring centres in all the villages for easy availability of modern tools and farm equipment to the farmers. The tenant farmers are especially at risk in the event of yield loss or output price reduction, as they have to pay tenancy fee of about 30% of the average farm returns, even though their yields are lower than average. Hence there was an urgent need for addressing the tenancy farmer₹s problems through institutional innovations and subsidy programmes.
In policy front to facilitate this diversification of agricultural sector, state government should focus on increasing irrigation facilities, providing veterinary services through livestock service centres and rural service centres for promoting overall development of the rural economy to create employment in not only agriculture, but also in off-farm and non-farm activities. However, in this transition period farmers income may fluctuate widely, hence there was a need for price support and crop and livestock insurance for every farmer in Telangana irrespective of the farm size.
References
Agricultural Commission Report. 2016. Government of Andhra Pradesh by Prof. Radhakrishna Committee.
Chand, R. and Srivastava, S.K. 2016. Disadvantaged agricultural regions: Is there a way forward? Indian Journal of Agricultural Economics, 71(1): 36.
Cost of cultivation scheme data, Government of India for various years.
Darekar, A. and Reddy, A.A. 2017. Cotton price forecasting in major producing states. Economic Affairs, 62(3), 373-378.
Joshi, P.K., Gulati, A., Birthal, P.S. and Tewari, L. 2004. Agriculture diversification in South Asia: patterns, determinants and policy implications. Economic and Political Weekly, pp. 2457-2467.
NSSO. 2013. Situation Assessment Survey of Agricultural Households, January - December 2013, NSS 70th Round.
Reddy, A.A. and Kumar, P. 2006. Occupational structure of workers in rural Andhra Pradesh, Journal of Indian School of Political Economy, 18(1 & 2): 77-91.
Reddy, A.A. 2011. Disparities in Employment and Income in Rural Andhra Pradesh, India, Bangladesh Development Studies, XXXIV(3): 73-97.
Reddy, A.A. 2017. Doubling Farmers income, Telangana Today https://telanganatoday.com/doubling-farmers-income
Reddy, A.A. 2017a. Agrarian Economy of Telangana, National Conference Revisiting Agricultural Extension Strategies for Enhancing Food and Nutritional Security, Sustainable Livelihoods and Resilience to Climate Change - Towards Transforming Agriculture, 22nd -24th, April 2017, pp. 334362. http://www.prdis.org/pdfs/extncon_2017_ebook.pdf
Reddy, A.A. 2018. https://telanganatoday.com/six-steps-to-double-farmers-income
Reddy, A.A. 2015. Growth, structural change and wage rates in rural India. Economic & Political Weekly, 50(2): 56-65.
Reddy, A.A. 2017b. Challenge of Inclusiveness of Doubling Famers₹ Incomes: A Case of Telangana. Agricultural Economics Research Review, Conference issue.
Reddy, A.A. and Bantilan, M.C.S. 2013. Regional disparities in Andhra Pradesh, India. Local Economy, 28(1): 123-135.
Reddy, A. and Singh, V. 2015. Financial Inclusion and Actual Use of Financial Services by the Poor in India. Economic Affairs, 60(4): 679-686.
Reddy, D.N., Reddy, A.A. and Bantilan, M.C.S. 2014. The impact of Mahatma Gandhi National Rural Employment Guarantee Act (MGNREGA) on rural labor markets and agriculture. India Review, 13(3): 251-273.
Siddeswari, G.K., Sathya Gopal, P.V, Sailaja, V. and Ravindra Reddy. 2020. Types and Scales of Enterprises Being Run by the Women Entrepreneurs of Self-help Groups in Andhra Pradesh, Economic Affairs, 65(1): 57-62.
Various Telangana state government reports including statistical abstracts, season and crop reports, socioeconomic outlook, 2015 and 2016.