
Economic Affairs, Vol. 65, No. 2, pp. 197-205, June 2020
DOI: 10.46852/0424-2513.2.2020.10
An Economic Analysis of Redgram Seed Production in Chikkaballapura District of Karnataka, India
ABSTRACT
The present study is based on primary data collected from 30 each of redgram seed producing farmers of BRG-1 variety and BRG-2 varieties taken up by KSSC, in Chikkaballapura district of Karnataka, during the agricultural year 2016-2017. The per hectare cost of cultivation (₹ 58,989), gross return (₹ 92,935), and net return (₹ 33,946) with yield of 15.4 quintals in BRG-1 variety seed production was higher than BRG-2 variety in which the cost of cultivation, gross returns and net returns were ₹ 51,768, ₹ 80,890 and ₹ 29,122, respectively, with a yield of 13.7 quintals . Hence, production of BRG-1 variety certified seed has resulted in a win-win situation for the farmers with higher yield and increased returns. The decision of the farmer on adoption of seed production technology was positively influenced by factors like assured market, seed subsidy, and technical guidance. The constraints faced by farmers in seed production were non-availability of labour, lack of pure and quality seeds. Higher yield and profitability associated with seed production can be effectively popularized among farmers, resulting in increased certified seed production to meet the demand.
Highlights
 Main problems in redgram seed production were non-availability of labour and lack of pure and quality seeds, being assured market as a main reason to take upon the seed production. BRG-1 varietal seed production is more profitable than BRG-2 variety.
Keywords: Seed production, BRG-2 variety, certified seed production
Redgram (Cajanus cajan L.) is one of the protein rich pulse crops in India which is also called as Pigeon pea or Arhar or Tur. According to FAO statistics, the total area under redgram is 6.9 million hectares producing 5.9 million tonnes in the year 2018, Asia contributing the most (3.2 million tonnes) followed by Africa (0.49 million tonnes) and America (0.074 million tonnes). India being the major producer contributing around 71.6 percent followed by Myanmar. In India, Redgram takes the second position in total pulse production with 4.25 million tonnes of production in an area of 4.43 million hectares in the year 2017-18 at a productivity level of 960 kg/ha. Among the states Maharashtra is the major producer with 1.07 million tonnes of production followed by Madhya Pradesh (0.84 million tonnes) and Karnataka (0.77 million tonnes) (B. Rajendrer et al. 2018). Nutritionally, 100 g of redgram contains 22.40 g of protein, 48.19 g of carbohydrates 2.74 g of fat and around 1.39 mg of Calcium 2.3 mg of Zinc (Taalari et al. 2018). Northern parts of Karnataka accounts nearly 90 percent of total red gram area in the state. During 2010-11 the red gram was grown over 8.91 lakh hectares with a production of 5.29 lakh tonnes and a productivity of 625 kg/ha (Suresh K. et al. 2016). Redgram is used as both the food crop (dried peas, flour, or green vegetable peas) and forage/cover crop. In combination with cereals, pigeon peas make a well-balanced meal and hence are favoured by nutritionists as an essential ingredient for balanced diets. The dried peas may be sprouted briefly, then cooked, for a flavour different from the green or dried peas. Sprouting also enhances the digestibility of dried pigeon peas via the reduction of indigestible sugars that would otherwise remain in the cooked dried peas.
How to cite this article: Thejashree, H.N. and Umesh, K.B. (2020). An economic analysis of Redgram seed production in Chikkaballapura district of Karnataka, India. Economic Affairs, 65(2): 197-205.
Source of Support: None; Conflict of Interest: None 
MATERIALS AND METHODS
The study is carried out in Gowribidnur and Bagepalli taluks of Chikkaballapura district on BRG- 1 and BRG-2 varietal seed production of redgram, as these taluks are one among the major seed producing taluks, as per the list given by Karnataka State Seeds Corporation Limited. Thirty farmers cultivating each variety viz; BRG-1 and BRG-2 varieties were selected randomly in the study area.
Cost Concepts: The costs were classified into variable and fixed costs. The measurement and definition of various cost components are as follows:
Variable cost: Those costs which vary with the level of production are included in this category. The costs included are cost of inputs, labour cost, interest on working capital and miscellaneous costs.
Labour cost: The cost on human labour was calculated by multiplying the man-days with prevailing wage rate. Women days were converted into man days by multiplying it with the ratio of wages given to women labour to that of men labour. The cost on family labour was imputed by multiplying man days with the prevailing wage rate. The bullock labour was taken in pair days and the cost towards it was estimated by multiplying pair days with wage rate. Machine labour was measured in hours and valued at prevailing hourly rates in the area. Whereas, combine harvester and thresher chargers were considered only in monetary terms.
Cost of Inputs: Cost of various inputs like fertilisers, plant protection chemicals, FYM and others are included in this category. Non-farm inputs were valued at prevailing prices while owned farm inputs were imputed at current prices. The prevailing charge for canal water per crop per season was taken as irrigation cost (It is reported by the farmers that, they do not pay irrigation charges, however it is collected in different forms).
Interest on Working Capital: The prevailing bank rate of seven per cent (Commercial bank lending rate for crop loan in study area) is taken to work out the interest on working capital for the duration of the crop.
Miscellaneous: This item includes the cost incurred for miscellaneous purpose during farming operations.
Fixed Cost: This consists of those cost items which do not vary with the level of production. The items included under this section are;
Land Revenue and taxes: Land revenue was charged at the rates levied by the Government.
Depreciation: Depreciation on each farm asset used in the cultivation of crop was worked out by straight line method of computing depreciation.

The average life of the asset as indicated by each farmer was used in computation of the depreciation. Rental Value of Owned Land: The prevailing rental value of the land for the crop depending on the duration was considered.
Interest on fixed capital: It was computed at the rate of ten per cent per annum. The interest was worked out on the values of fixed assets, after deducting depreciation for the year and land revenue.
Returns Concept
Gross Returns: It includes the gross value of main product and by product imputed on the basis of post-harvest prices prevailing in the selected study area was considered in the present study.
Net Returns: It is computed by subtracting the gross returns from total cost of cultivation. Returns over variable cost were calculated by dividing gross returns by total variable cost. Similarly, returns per rupee of expenditure were calculated by dividing gross returns by total cost of cultivation.
Returns per rupee of expenditure: It was calculated by dividing the gross return by total cost of production of certified seeds.
Cost of Production: Cost of production was calculated by dividing total cost of cultivation by total crop output (Main product).
Resource use efficiency: Cobb-Douglas type of production function was used to analyse the resource use efficiency.
Specification of the equation for seed production is given in equation 1.
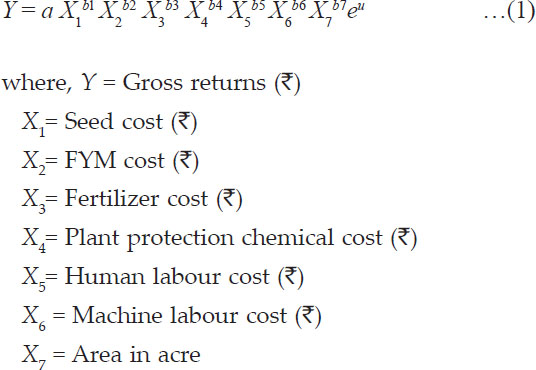
a and u represented constant and random variable, respectively, and b1 to b7 indicate regression coefficients of respective inputs and implicitly represents the elasticity of production of respective inputs.
Allocative efficiency: The estimated coefficients were used to compute the MVP. Marginal Value Product of Xi, i.e., for the ith input, is estimated by the following formula,
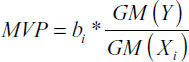
GM (Y) and GM (Xi) represent the geometric means of output and input respectively and bi is the regression co-efficient of ith input. The model was estimated as follows,
r = MVP/MFC
where, r = efficiency ratio
MVP = Marginal value product of variable input
MFC = Marginal factor cost (price per unit input)
The values are interpreted thus, If r is <1; resource is excessively used, r > 1; resource is under used and if r = 1; it shows the resource is efficiently used.
Technical efficiency
Technical efficiency (TE) defined as the ability of a farm to produce the maximum feasible output from a given level of inputs, or with the minimum feasible levels of inputs to produce the maximum level of output. The DEA method is the non-parametric mathematical programming approach for frontier estimation (Coelli, 1996) method that does not require specification of a functional form or a distributional form and can accommodate scale issues. DEA was applied by using VRS (variable returns to scale) with input orientation as constant returns to scale are only appropriate when the farms are operating at an optimal scale (Murthy et al. 2009).
Estimation of technical efficiency
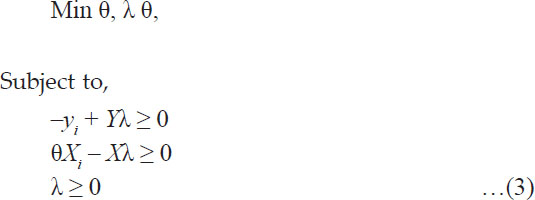
where,
yi is a vector (m×1) of output of the ith Producing Farms (TPF)
xi is a vector (k x 1) of inputs of the ith TPF
Y is an output matrix (n*m) for n TPFs
X is an input matrix (n × k) for n TPFs
θ is the efficiency score, a scalar whose value will be the efficiency measure for the ith TPF. If θ =1, TFP (Total factor productivity) will be efficient; otherwise, it will be inefficient. λ is a vector (n * 1) whose values are calculated to obtain the optimum solution.
The DEAP version 2.1 software developed by Coelli (1996), Centre for Efficiency and Productivity Analysis, University of Queensland, Australia, was used in this study to compute the efficiency levels of red gram farms separately by taking input oriented method. The main product per hectare considered as outputs in the present study and seeds (kgs), farm yard manure (tons), human labour (Man days), bullock labour (pair days), machine labour (hours), chemical fertilisers (kgs), plant protection chemicals (in red gram) were taken as inputs. The prices of inputs used for cost minimization problem to estimate the economic efficiency (K. Suresh et al. 2016).
Estimation of Allocative and Cost Efficiency (Economic Efficiency)
One would run the following DEA formula for estimation of efficiencies as follows:
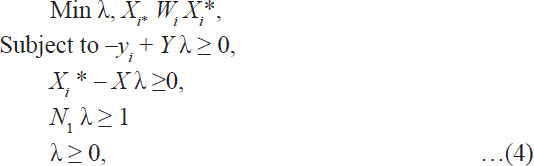
where, Wi is a vector of input prices for the ith Total Productivity Factor (TPF), Xi is the cost minimizing vector of input quantities for the ith RPF.
Given the input prices Wi and the output levels Yi. The total Cost efficiency (CE) or Economic efficiency (EE) of the ith TPF would be calculated as,

i.e., the ratio of minimum cost to observed cost. One can then use following formula to calculate the allocative efficiency residually,

Garrett ranking technique: Garrett₹s ranking technique was used to rank the benefits and constraints in seed production. In this analysis, rank one meant most important factor and higher the rank meant least important factor. In the next stage, rank assigned to each factor by each individual was converted into per cent position using the following formula,
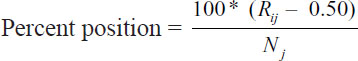
where, Rij stands for rank given for the ith factor (i = 1, 2........9) by the jth individual (j = 1, 2........50) and Nj stands for number of factors ranked by jth individual.
Once the per cent positions were found, the per cent position of each rank was converted to scores by referring to table given in Garrett and Woodsworth (1969). Then the scores for each factor were summed over the number of sample farmers who ranked that factor. In this way, total scores were arrived at for each of the benefits and constraints and mean scores were calculated by dividing the total score by the number of respondents, who gave ranks.
RESULTS AND DISCUSSION
Cost and returns in Red gram seed production
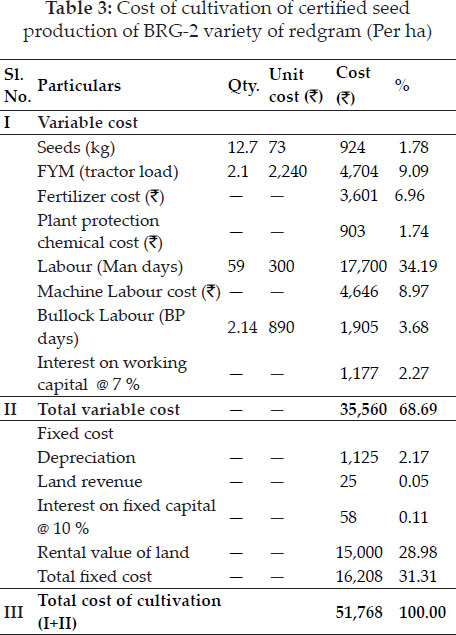
It can be observed from the Table 1 and Table 3 that the average working expenses incurred in BRG-1 and BRG-2 varieties was ₹ 42,671 per ha and ₹ 35,560 per ha, respectively. In BRG-1 varietal seed production, the major expenditure was incurred on human labour (32.55 %) followed by cost on machine labour (12.59 %) whereas in BRG-2 variety, expenditure on human labour (34.19 %) was highest followed by cost on FYM (9.09 %).
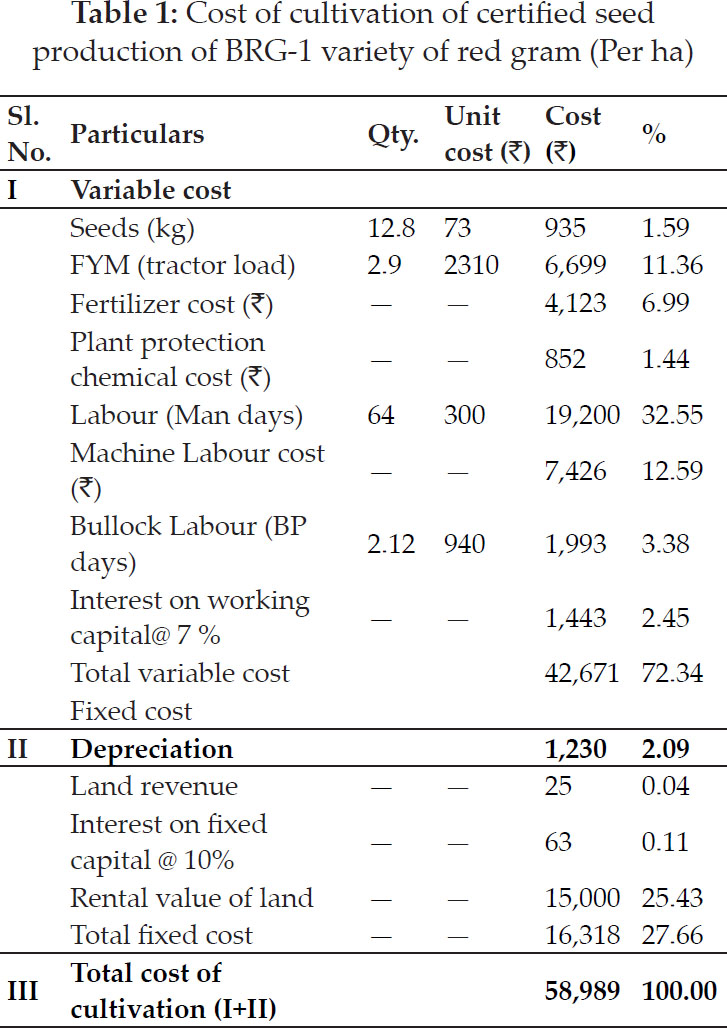
Fixed costs accounted for 27.66 per cent and 31.31 per cent of the total cost of cultivation in BRG-1 and BRG-2 varieties. Among fixed cost, rental value of land was major cost in both BRG-1 (25.43 %) and BRG-2 (28.98 %).
Cost of cultivation: The average cost of cultivation of BRG-1 and BRG-2 varieties of red gram seed production was ₹ 58,989 and ₹ 51,768 per hectare, respectively.
The gross return includes returns from accepted seeds and rejected seeds (Table 2 and Table 4). The per hectare average seed yield obtained of BRG-1 and BRG-2 varieties was 13.2 q and 11.3 q, respectively which was accepted by KSSC whereas the average yield rejected by KSSC was 2.2 q and 2.4 q, respectively.
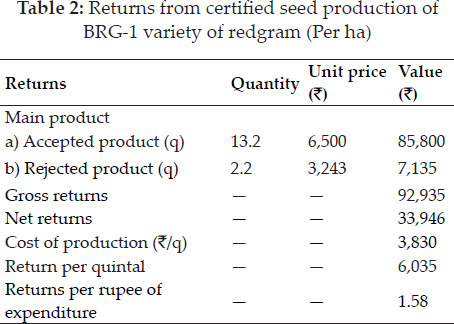
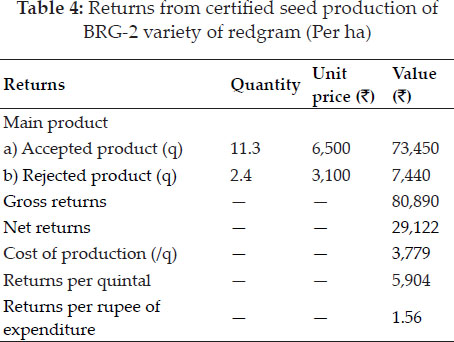
The net returns per hectare of BRG-1 and BRG-2 was ₹ 33,946 and ₹ 29,122, respectively.
The rate of return per rupee of expenditure was higher in case of BRG-1 variety (₹ 1.58) than in BRG-2 variety (₹ 1.56).
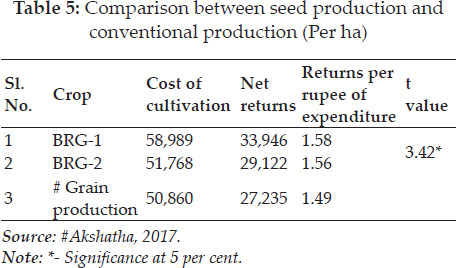
Seed and grain production: The comparison of seed production to grain production (Table 5) indicated higher returns in seed production in both the varieties. The returns per rupee of expenditure was ₹ 1.49 in conventional production (Akshatha, 2017) which was lower when compared to return per rupee of expenditure in BRG-1 (₹ 1.58) and BRG-2 (&rs; 1.56) seed production. The results revealed that the seed production is profitable than grain production.
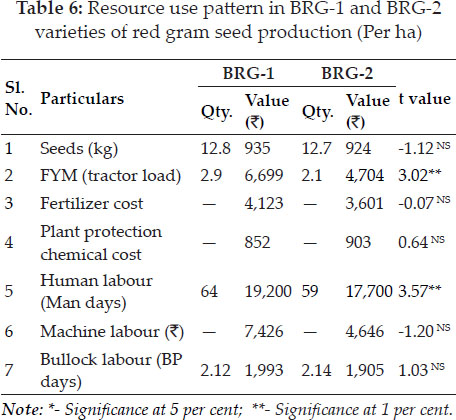
Resource use: The cost of fertilizers applied in BRG-1 (&rs; 4,123) and in BRG-2 (&rs; 3,601) variety was non-significant. The difference in cost of FYM, plant protection chemical cost, machine labour cost, seeds and bullock labour costs were significant (Table 6). The co-efficient of multiple determination (R2) was 0.94 and 0.91 for BRG-1 variety and BRG-2 variety, respectively, indicating that independent variables included in the production function explained 94 per cent and 91 per cent of the variation in the production of BRG-1 and BRG-2 varieties of redgram seed production (Table 7).
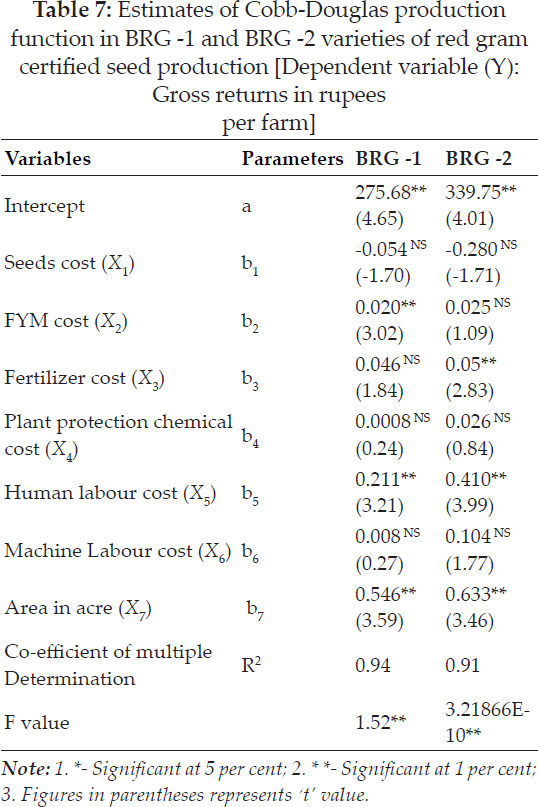
Resource use efficiency: In case of BRG-1 variety regression co-efficient of FYM (0.020), human labour (0.0008) and area (0.546) were statistically significant at one per cent. The regression co-efficient of other variables seeds (-0.054), fertilizer (0.046) and machine labour (0.008) were statistically non-significant. One unit increase in the input use of FYM, human labour and area above its geometric mean level will lead to 0.020, 0.0008 and 0.546 increase in gross returns (₹) from its geometric mean level, respectively. The overall regression model was found to be significant at one per cent. In case of BRG-2 variety regression coefficient of fertilizer (0.05), human labour (0.410) and area (0.63) were statistically significant at one per cent. If the significant variables fertilizer, human labour and area were increase by one unit above its geometric mean level, the gross returns (₹) will increases by 0.05, 0.410 and 0.63 from its geometric mean level. The overall regression model was found significant at one per cent.
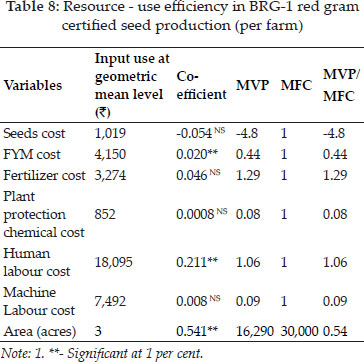
In BRG-1 variety, the ratio of MVP to MFC in case of FYM, human labour and area were 0.44, 1.06 and 0.54, indicating that the FYM and area were over utilised and human labour is underutilised, hence there is still scope to increase the human labour in production to get more returns (Table 8). In case of BRG-2 variety, the ratio of MVP to MFC of fertilizer and human labour were 1.49 and 1.58, respectively indicating on invest of one rupee on fertilizer and human labour would give additional gross returns of ₹ 1.49 and ₹ 1.58.
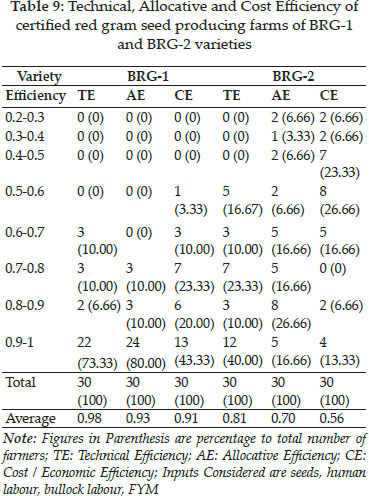
It is observed from Table 9 that under the assumption of variable returns to scale, in case of BGR-1 variety majority firms (73%) performed with technical efficiency level equal to score 0.9-1. In BRG-2 variety number of firms with technical efficiency equal to score 0.9-1 are 40 percent, which BRG-2 firms are technically less efficient than BRG-1 firms. With regard to allocative efficiency and cost efficiency in BRG-1 variety 24 firms and 13 firms have score equal to 0.9-1 respectively. BRG-2 firms again shown lesser allocative and cost efficiency by having only 5 and 4 firms in each efficiencies with range score 0.9-1 respectively. By the data it is evident that there is scope to reallocate the resources in BRG-2 varietal seed production firms.
Garrett ranking results
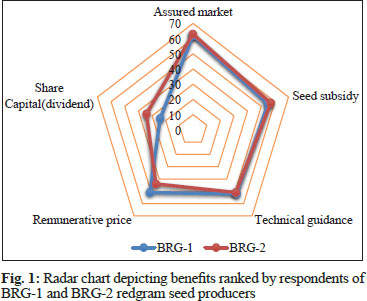
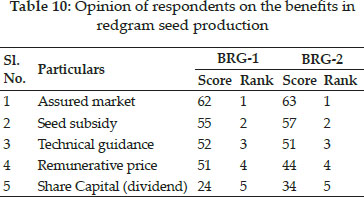
Benefits: When farmers are requested to rank the factors due to which they take seed production over grain production,both BRG-1 and BRG-2 varietal seed producing firms awarded first rank to assured market by giving score 62 and 63 respectively, which shows farmers take seed production majorly because of assurance of market they get from Karnataka State Seeds Corporation Limited. Next factor due to which farmers take seed production under Karnataka State Seeds Corporation Limited is Seed Subsidy, farmers opined that they get seeds at subsidised rate which is another favourable factor to take seed production. Third rank is awarded to technical guidance, KSSC officials₹ regular visits at different stages of crop and guidance regarding transplanting, crop protection, harvesting and storage made a impact on them to continue the seed production. Remunerative price was ranked third followed by dividend as all seed growing farmers are not the members or shareholders of KSSC not everyone get the dividend every year hence it is ranked as last factor due to which they take seed production over grain production.
Fig. 1, shows that share capital that they get is not the major factor which favours the decision of taking seed production and both varietal seed producing farmers opined the assured market they get is the main reason to take up the seed production.
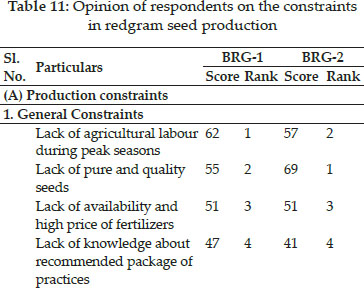
Constraints: Constraints in seed production are grouped into four major categories naming General constraints, plant protection, credit, agro climatic factors, economic factors and institutional constraints. Farmers were asked to rank the constraints they face in each category one being the major constraint they face and 5 being the less problematic factors.
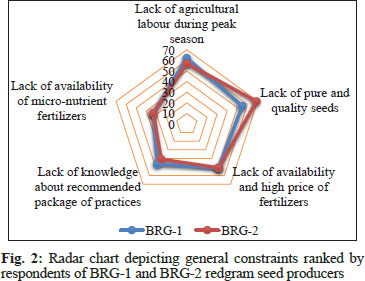
General Constraints: BRG-1 varietal seed producing farmers felt lack of agricultural labour during peak season is the major constraint whereas BRG-2 varietal seed producing farmers felt lack of pure and quality seeds is the major constraint, farmers feel BRG-2 seeds they get from KSSC are low quality seeds. Both the varietal seed producers opined availability of micro-nutrient fertilizers is not much a constraint to take seed production (Fig. 2).
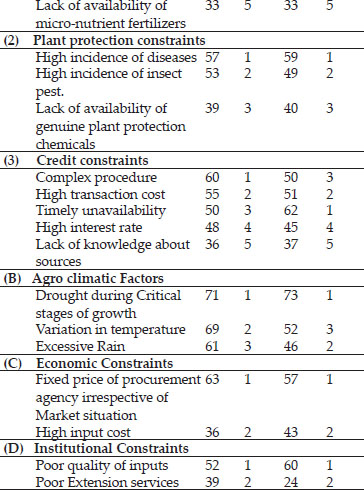
Plant protection constrains: Incidence of diseases in both the varieties is awarded first rank followed by pest incidence, noted that the availability of plant protection chemicals is not a major problem in the study area.
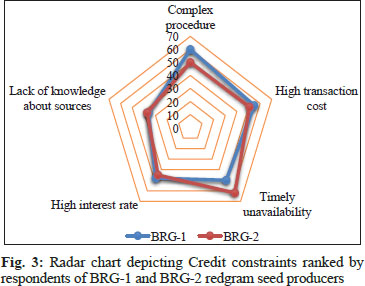
Credit Constraints: BRG-1 seed producing farmers felt complicated procedure of applying for credit from bank is the major constraint by giving a score of 60, while the BRG-2 seed producing farmers felt timely unavailability of credit is the major problem by awarding score of 62. Both the varietal seed growing farmers ranked second to the high transaction cost since they have to travel many times to banks which are not near to their residential areas. Farmers opined that they do not lack the knowledge about sources of capital around them including cooperative and commercial banks, hence gave less score (Fig. 3).
Agro-climatic factors: The major problem faced by farmers is drought during critical stages of growth, farmers who are not having bore wells are hiring water tankers to water the plants in critical stages. Excessive rain is felt as not a major problem by BRG- 1 varietal seed producing farmers and variation of temperature is felt as not a major problem by BRG-2 varietal seed producing farmers.
Economic constraints: This category included two factors namely fixed price by procuring agency i.e., KSSC irrespective of market situation and high input cost. Among them both the varietal seed producing farmers awarded first rank to fixed price by giving high scores.
Institutional Constraints: BRG-1 and BRG-2 seed producing farmers gave scores of 52 and 60 respectively for poor quality of inputs, saying they get poor quality of inputs by KSSC is the major constraint in seed production in the study area. Both the varietal seed growing farmers opined that they get enough guidance and extension services like information regarding availability of seeds in agriculture office and updates about new technologies available in seed production.
RESULTS
Results have amply indicated the superiority of seed production over grain production in both the varieties. The human labour in BRG-1, fertilizers and human labour in case of BRG-2 varieties had ratio MVP/MFC of more than one, indicating their underutilization and hence the profitability can be increased by using more of these resources. The technical efficiency (0.98), allocative (0.93) and economic efficiency (0.91) of BRG-1 farms were more than in BRG-2, which showed 0.81, 0.70 and 0.56 technical, allocative and economic efficiencies, respectively, indicating the scope to reallocate the resources, so efforts are needed to educate farmers about seed production and package of practices which also leads to increase in yield and profitability in seed production. Constraints analysis indicated that labour scarcity at peak season was the major constraint as seed production is labour intensive, hence farm mechanization must be encouraged, particularly during the peak seasons to ward off labour supply demand gap, further extending custom hiring services would help in addressing labour problem. This study reveals that adoption of certified seed production of redgram in farmers₹ fields is helpful in providing a profitable enterprise for increasing the net farm income.
REFERENCES
Akshatha, B.A. 2017. A comparative economic analysis of vegetable and grain redgram production in Karnataka. Thesis M Sc (Ag). University of Agricultural Sciences Bengaluru, Karnataka, India.
Aruna Talari and Shekappa Devindra. 2018. Role of pigeon pea in human nutrition and health: A review. Journal of Dairy & Food Res., 37(3): 212-220.
Coelli, T.J. 1996. Recent development in frontier modelling and efficiency measurement. Australian Journal of Agricultural Economics, 39(3): 219-245.
Garrett, E.H. and Woodworth, R.S. 1969. Statistics in psychology and education, Bombay, India, pp. 329.
Jamadar, M.I., Sajjan, A.S. and Kumar, S. 2013. Economic analysis of seed production in transplanted pigeonpea. International Journal of Commerce and Business Management, 7(1): 63-66.
Kashikar, R. 2012. Economics of production and marketing of hybrid rice seed in Madhya Pradesh Ph.D. Thesis, Jawaharlal Nehru Krishi Vishwa Vidyalaya, Jabalpur, Madhya Pradesh.
Mulimani, S.T. 2015. Analysis of contract farming in selected seed production crops in Haveri district, Karnataka M. Sc. (Agri.) Thesis (Unpub.), Univ. Agric. Sci., Bangalore.
Murthy, D.S. Sudha, M. Hegde, M.R. and Dakshinamoorthy, V. 2009. Technical Efficiency and its Determinants in Tomato Production in Karnataka, India: Data Envelopment Analysis (DEA) Approach. Agricultural Economics Research Review, 22(2): 215-224.
Pal, G., Channanamchery, R., Singh, R.K., Kethineni, U.B., Ram, H. and Prasad, R.S. 2016. An economic analysis of pigeonpea seed production technology and its adoption behaviour: Indian context article. Scientific World Journal, doi: 10.1155/2016/7973638.
Radha, Y. and Chowdry, K.R. 2005. Comparative economics of seed production vis-a-vis commercial production of cotton in Andhra Pradesh. Ind. J. of Agri. Econ., 60(1): 94-102.
Rajendrer, B., Tiwari, A.K., Bhopal and Tomar, S.S. 2018. Pulse Revolution from food to nutritional security, pp. 115, Ministry of Agriculture and Farmers Welfare, New Delhi, India.
Suresh, K., Chandrakanth, M.G. 2016.Economic efficiency of improved red gram variety (BRG-2) in Karnataka: a DEA analysis. doi: 10.5958/0976-4666.2016.00012.7
Suresh, K. and Chandrakanth, M.G. 2016. Economic efficiency of improved red gram variety (BRG-2) in Karnataka: a DEA analysis. Eco. Affairs, 61(1): 81-88.
Veerabhadrappa Bellundagi, Suresh S. Patil, Vilas Jadhav, Joycy R. Dasari. 2017. Bt Cotton seed production: Intercompany economic analysis in Karnataka. Eco. Affairs, 61(2): 251-258.