
Economic Affairs, Vol. 65, No. 2, pp. 225-232, June 2020
DOI: 10.46852/0424-2513.2.2020.14
Analysis of Demand Supply and Production Constraints in Major Fruits & Vegetables in Bihar
ABSTRACT
The paper is an attempted to analyzed the trend in area, production and productivity and change in consumption pattern of fruits and vegetables across different socio-economic groups. Further, the future needs of vegetables and fruits as well as constraints faced by the farmer in production and marketing in the selected districts of state were also assessed. Trend analysis of area and, production of major fruits in Bihar indicated that area under major fruits shown an increasing trend. Production and productivity of litchi and banana also showed an increasing trend. Except mango whose production and productivity over period i.e. 2005-2012 had been declined. Whereas growth in area under major vegetable had been stagnated except for potato whose area had been declined over 2005-2012. Data of five major round i.e. 38th, 43t, 50th, 95th and 66th pertaining to the periods of 1983-84, 1988, 1993-94, 1999-2000, 2005-06 and 2009-10 respectively, shown a positive growth in annual per capita expenditure on fruits and vegetables and found to be more in urban areas than in rural areas.. Results of the study revealed that vegetables have emerged as an essential commodity recording income elasticity of demand lower than most of non-cereal commodities, while fruits continued to be more elastic. The demand of vegetable would be increase from 12.12 million tonnes in the year 2011 to 17.46 million tonnes in the year 2031, whereas the demand for fruits will be increased from 4.55 million tonnes (2011) to 6.55 million tones in the year 2031. This demand could be met by increasing the productivity of vegetables and fruits alone given the limitation of area expansion. The projected supply of major vegetables indicated that Bihar shall be surplus state in vegetable production and remained to be a surplus state in 2031. Study also revealed that 90 per cent of farmers were facing the problems of inadequate knowledge of market information system, and dis-satisfaction from price of fruits and & major constraints identified for vegetable were unavailability of cold storage facility; lack of processing plant in the state etc. Whereas senile orchard, lack of adequate knowledge of maintenance, unavailability of fund and input were highly significant constraints for production of these crops in the state.
Highlights
 The demand and supply projection of major fruits indicated that Bihar as a whole being a deficit state. m Efficient vegetable co-operative with credit and marketing linkages is required to enhance the bargaining power of producers.
Major constraints of Fruits & Vegetables marketing are low price spread, low bargaining power, and lack of market information.
Keywords: Demand and supply, exponential function, fruits and vegetables, Kendall's test
Production of fruits and vegetables is being viewed as ‘Sunrise' enterprise meaning thereby that potentials of major fruits and vegetables in large. During 2012-13, Bihar produced 4.25 million tonnes of fruits and 16.32 million tonnes of vegetables, accounting to 5.23 per cent and 10 per cent of the country's production, respectively. Bihar ranked ninth in area under fruits (4.32%) and 3rd in area under vegetables (9.36%) as compared to all India's situation. The productivity of fruits (14.09 tonnes/ha) and vegetables (18.94 tonnes/ha) of the state is quite higher than the average productivity of the country's situation with 11.64 tonnes/ha and 17.62 tonnes/ha, respectively (Government of India, 2015).
How to cite this article: Kumari, M. and Panda, C.K. (2020). Analysis of demand supply and production constraints in major fruits & vegetables in Bihar. Economic Affairs, 65(2): 225-232.
Source of Support: None; Conflict of Interest: None 
Among different fruits grown in the state mango is the most important fruit crop accounting more than 50 per cent total area under fruits. Bihar rank third with respect to area and production of mango in the country. Next to mango, litchi has immense production and export potentiality in Bihar. Bihar holds a monopoly position in litchi production in terms of both quantity as well as quality. Amongst different litchi growing states, Bihar ranks first with respect to area production and productivity. Banana is another important fruit grown in the state. Bihar ranks 6th in production (1.70 million tonnes) and 7th in area and productivity of Banana in the country (NHM, 2014). Among vegetables potato, tomato, cauliflower, okra and brinjal is being grown on commercial level in the state. Trend in area, production and productivity over the period i.e. 1991-1992 to 2011-12 indicated that the area under vegetables has increased by 0.93 lakh hectares only however productivity has been increased from 10.2 tonnes/ ha. to 18.1 tonnes/ha. With increase in availability, a shift in consumption pattern in favour of fruits and vegetables was observed for all the socio-economic groups living in rural and urban area (Kumar and Mathur 1996; Kumar, 1998). It is hypothesized that urbanization, economic and population growth made shift in dietary pattern and enhanced the future demand of fruits and vegetables. With trade liberalization and increase in investment in horticultural development the prospects of export as well as for the processing industries of fruits have brightened (Kumar, 1998). But due to absence of practice of grading, poor quality, low yield level, lack of market integration, lack of infrastructure etc., the state has not been able to make significant contribution in the export as compared to other states of the country. Therefore future strategy for development would require a remarkable change in supply and demand scenario in fruits and vegetables of Bihar.
This paper seeks to examine the demand supply gap and identify the constraints and prospects in production and marketing of fruits and vegetable in Bihar. It is necessary because Bihar is the third largest producer of vegetables and these are becoming increasingly important in the state economy owing to its vast growth potential and assurance of livelihood to a large number of farm families. The genesis of the study further lies in fact that there is hardly any comprehensive survey based study related to consumption pattern conducted in Bihar which could help in improvement in the pattern of production, consumption and marketing prospects of this economically most backward state of India.
METHODOLOGY
Type of data and sampling methods
The present study was conducted during the year 2010 to 2013 based on both primary and secondary data. The time series data on the area, production, and productivity of major fruits (mango, litchi and Banana) and vegetables (okra, Cauliflower, Tomato and Potato) was collected from 11 districts having highest area under fruits and vegetables from Directorate of Horticulture, Bihar, Directorate of Economics and Statistics, Govt. of Bihar/or Census office, Govt. of India, different published sources and authentic online sources to study the trend in area, production and productivity, and to project the demand and supply of fruits and vegetables in Bihar.
Primary data, to identify the production and marketing constraints, sum total of 440 farmers of 44 village consisting of 10 farmers from each villages of 22 blocks of11 districts were collected through structured, pretested interview schedule employing multistage sampling technique. In the first stage, eleven districts having highest area under fruits and vegetables were selected purposively. At the second stage, two blocks from each district were selected randomly. At the next stage, two villages from each block i.e., a total of 44 villages consisting of 10 farmers from each village's i.e., 440 farmers were selected purposively for the same.
Tools and techniques employed for analysis of data
The trend in demand and supply of fruits and vegetables was estimated by employing the exponential function in the form of y = abt. The equation thus fitted to examine the trend in growth rate is converted to semi-logarithmic form represented as follows:

Where, Y denotes area/production/yield, T indicates year (time), A and B are the coefficients, r = [Antilog (B) -1] × 100.
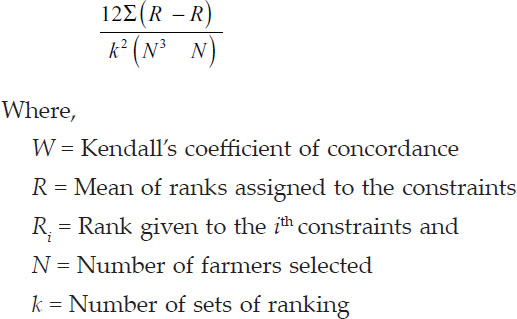
Demand requirement of fruits and vegetables was estimated on the basis of estimated trend by taking into considerations of per day/ capita consumption of fruit and vegetables respectively which has been taken in to account for fruit is about 120 gm/day and for vegetable 320 gm/day for all groups (ICMR). To determine supply wastage allowance at the rate of 30% for mango and litchi while 20 per cent for banana of gross production and 19 to 22 per cent for rest of vegetable was taken into account however for tomato it was estimated at 39 per cent of gross production (Chaddha, 1995). Expenditure elasticity of fruit for rural and urban sector were estimated on the basis of collected NSS data by fitting logarithmic function of the type log yi = log a + b log xi.. Lastly Kendall's rank coefficient of concordance test was used to find out the significant constraints faced by the farmers in production and marketing of fruits and vegetables (Siegel, 1966).
The identified constraints were ranked accordingly and were weighted according to preference given by a group of farmers consisting of 24 farmers in each group irrespective of level of income, and size of holding having 10 groups,.
RESULTS AND DISCUSSION
It may be observed from the table that the area, production and productivity of major fruits in Bihar like mango showed compound growth rate of 1.05, -3.85 and -2.43 per cent respectively during the period which were significant at 1 per cent level of probability. This clearly indicated that though there was decline in production and productivity of mango but area under mango was registered positive and significant in the state of Bihar.
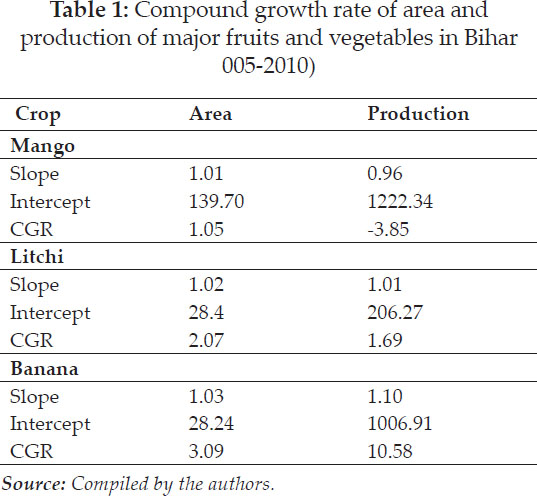
However, other selected fruits such as litchi and banana shown positive and significant growth in its area, production and productivity over same mentioned period. The C.G.R. of area production and productivity of litchi and banana showed its growth of 2.07, 1.69 and 0.49 per cent for litchi and 3.09, 10.58 and 9.06 per cent respectively for banana. It may further be observed that area, production and productivity growth for both fruits (litchi and banana) were positive and significant during the period. District wise analysis indicated that the growth rate of area, production and productivity of mango in all most all selected districts i.e. 11 districts shown same trend as shown in the appendix-1 except for the district Rohtas, in which area and production both were positive (i.e. 0.55, 0.42 and -0.13) but productivity growth of mango was negative unlike other selected districts and state as a whole too (Table 1). It may further be observed that the highest growth in area under mango was observed in Vaishali (0.80 per cent) followed by Madhubani (0.72) and Siwan (0.70) and lowest growth in area was observed in Darbhanga (0.31) followed by Banka 0.42) and East Champaran (0.44%) respectively but production and productivity growth in all most all districts selected so far were shown negative trend during same period under study. In case of litchi, highest increase in area was observed in West-Champaran (10.16 %) followed by Samastipur (4.24 %) and Katihar (2.79 %), Purnea (1.95 per cent), Siwan (1.87 per cent) and was estimated lowest in Muzaffarpur i.e. 0.% followed by Vaishali (0.86 %) and East-Champaran (0.99 %). It clearly indicates that those districts which has highest immense production potential for litchi had further no scope for expansion in area. It was mainly due to fact that production and productivity was declined over the period due to old plantation of this crop.
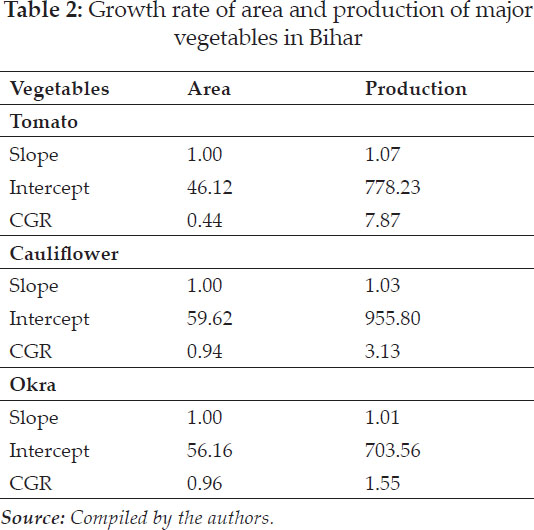
The area, production and productivity of major vegetables in Bihar shown a positive growth in area, production and productivity except potato, whose area, production and productivity was declined over period. District-wise trend analysis indicated that except Nalanda district in which the trend in area shown positive growth for potato i.e. about 0.06 per cent, in all other selected districts the area, production and productivity was declined. It was mainly due to unavailability of disease free high yielding varieties of seed, lack of storage facility (cold storage facility not available near by the villages) having low market price, post-harvest losses etc. However, other selected vegetable like tomato, cauliflower and okra shown positive and significant growth in production and productivity but area under vegetables was stagnated over the same period. For tomato it was estimated about 0.44 per cent and for cabbage (1.37 per cent), cauliflower (0.94 per cent) respectively in the state.
District-wise analysis indicated that area under tomato in almost all selected district shown an increasing trend except in E. Champaran where growth in area shown declining trend. The highest growth of area was registered in Samastipur district i.e. about 0.87 per cent followed by Begusarai (0.51 per cent) and East Champaran (about 0.45 per cent) respectively. However highest growth in area under cauliflower and okra was observed in Nalanda (3.03 per cent) and E. Champaran (5.63 per cent) for okra respectively. The lowest growth in area of these were observed in Madhubani i.e. about only 0.74 per cent and Begusarai (-1.99%) for cauliflower and okra respectively. Data pertaining to production and productivity of tomato, cauliflower and okra indicated that among selected district Patna shown highest growth rate of production i.e. about 10.59 per cent followed by West Champaran (10.36 per cent) and Nalanda (9.72) but lowest growth in production of tomato was estimated in Vaishali (8.27 per cent) followed by Aurangabad (8.29 per cent), Begusarai (8.41 per cent) and Muzaffarpur (8.78) respectively. For cauliflower, Nalanda districts were identified one of the important district, which shown highest growth in area, production and productivity and it was estimated to be 3.03, 6.41 per cent and 3.18 per cent respectively.
However, lowest growth in area, production and productivity was found in Madhubani i.e. about only 0.74 per cent and for production and productivity it was estimated to be 2.77 and 1.63 per cent respectively in Muzaffarpur district (D.R. 2013). It may further be observed from the table that trend in area and production of Okra was estimated to be 0.96 and 1.55 per cent respectively for state as a whole. This was found positive and significant at 1% level of probability. However data pertaining to each selected district indicated that highest percentage of growth in area under Okra was found in West Champaran i.e. 6.45 per cent followed by East-Champaran (5.63%) and Goharganj i.e. about 4.88 per cent. However lowest was estimated in Begusarai (-1.97 per cent) followed by Siwan (-1.38 per cent) and Vaishali (-0.01%) in which negative trend in area was observed but growth in production and productivity were found to be positive and significant in almost all district except for Begusarai (-1.55 per cent) and Siwan (-0.51) in which area was also declined.
However percentage growth in productivity was estimated to be highest in Siwan (2.70%) followed by Patna (2.57 per cent) and Nalanda (2.40 per cent) but lowest growth in productivity was estimated in Gopalganj (-0.40 per cent) in which productivity was declined over period in comparison to other selected district. This clearly indicates that decline in area was mainly due to area shift to kharif season cauliflower. It may further be concluded that increase or decrease in area, production and productivity of major vegetable in Bihar over period was mainly due to introduction of new hybrids with good shelf-life having lesser juice of tomato i.e. competitive crops of cauliflower by the seed company and potato growers were shifted towards cultivation of cauliflower due to long range of production season available.
Demand supply gap
The per capita demand projection of fruits and vegetable in this study was based on per capita income as a proxy for per capita disposable income due to lack of knowledge on the domestic saving tax structures in the economy in future and various other related factors. Per capita income projection depends on the rate of growth in population and the overall growth in the state. The state income was estimated on the basis of compound growth rate at constant price (1993-94 bases) for the period from 1993 to 2000 and from 2000 to 2010. It was estimated as 3.4 per cent. The value C(0.54 for fruit and 0.90 for vegetable) was estimated on the basis of 66th round of data on consumer expenditure based on information for the period from July 2009-10. It may be observed that the state income of Bihar at constant prices (1993-94) was expected to increase from 5449.65 crores in the year 2001-02 to ' 9785.48 crores in the year 2015-20. The per capita rural income for vegetable is expected to increase from 833.65 thousand to 1004.59 thousand rupees (D.R. BAU sabour 2013). On the basis of average per capita consumption of fruit and vegetable in rural and urban sector per capita /day demand of fruits and vegetables was projected for forth coming year i.e. upto 2020 in table 3.
Table 3 depicts the data on per day per capita consumption of fruits and vegetables whatever the rural and urban people of Bihar was actually consuming in 2001-2 and was expected to be increased with same rate.
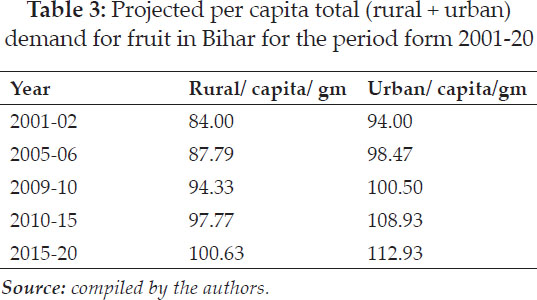
In the 2001 it was estimated as 84.00 gm/ capita/ day for fruit (rural area) and for urban areas it was found to be 94.90 gm which was estimated to be increased from 84 gm to 100 gm for rural area and from 94 gm to 112 gm for urban area respectively upto 2020. However, requirement of vegetable and fruit was recommended by the ICMR were about 320 gm and 120 gm respectively. On the basis of recommended requirements of consumption demand for fruits was estimated for the reference period i.e. up to 2031 in table 4.
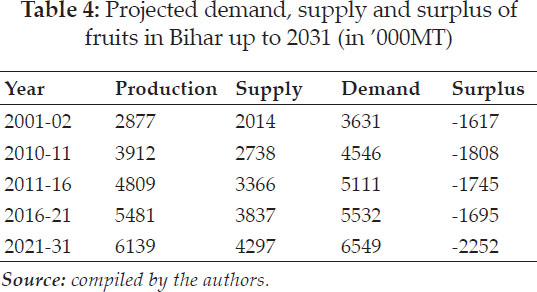
The demand and supply projection of major fruits indicated that Bihar as a whole being a deficit state. However, in some selected districts of state has surplus production (D.R. 2013). The demand for fruits in Bihar was 3631 thousand MT in the year 2001 which is expected to increase from 4546 ('000 MT) in 2011 to 6549 ('000 MT) up to 2031. Whereas estimated supply over the period were observed as 2738 ('000 MT) and 4297 ('000 MT) respectively. It clearly indicated the huge gap between supply and demand for fruits over the period mainly because of post-harvest losses (30 per cent of gross production was taken into account). Therefore greater emphasis is needed on postharvest management to consolidate the benefits of large potential of fruits in Bihar economy as whole and to nurture a healthy, competitive and vibrant horticulture.
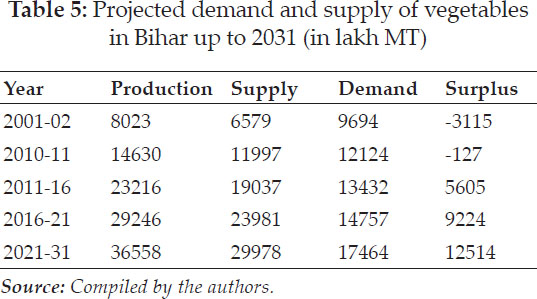
The gap between supply and demand of vegetable indicated that Bihar shall continue to be surplus state over 2031 as shown in the table that difference between demand and supply would likely to be increase in favour of supply i.e., supply was more than demand over the period. Demand of vegetable during the base year was estimated as 9694 lakh metric tones which would likely to increase with decadal growth of population at the rate of 25 per cent along with daily requirement recommended by the ICMR @320 gm/day upto 2031 was estimated as 17464 lakh metric tones where as supply during the same would likely to increased from 6579 to 29978 lakh metric tones respectively.
Consumption pattern of fruits and vegetable in Bihar
The expenditure elasticity of vegetable was very high for bottom group consumers of both urban (1.44) and rural areas (1.10). For fruits similar pattern was observed and it was estimated about 1.38 for rural and 1.52 for urban consumers respectively.
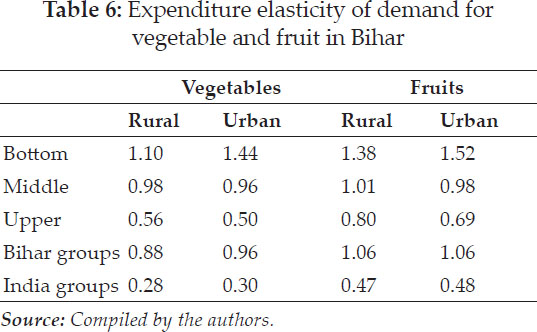
For upper class the expenditure elasticity on fruit and vegetable was comparatively low for both rural and urban areas. Over all the elasticity of fruit in rural area and urban area was estimated to be 1.06. It indicates that in urban area price of fruit does not make any significant difference on demand of fruit for people.
Constraints in Production and Marketing of Major Fruits and Vegetables
The growers of selected villages were confronted with a number of problems related to production and marketing of fruits and vegetables. However, an attempt was made to identify 10 specific marketing and production problems perceived by the growers on the basis of weighted mean average by assigning to each constraint according to preference given by the individual groups of farmers. It revealed that, despite of having strong base of production of vegetable due to high cost of marketing, packaging materials, excessive deduction by trader, problems of transportation means, discomfort in Mandy, low bargaining power, lack of information about price and shortage of cooling facility, improper weighing practices, lack of market information, delay in sale , delay in payment and one of the outmost important i.e. lack of effective market regulation in our state, they were not able to export the produce to other state or the country.
However, major constraints identified for production were, lack of fund, lack of suitable variety of fruits and vegetable. Lack of knowledge about agronomical practices. Slow adoption of improved & commercially accepted cultivars & Varieties, insufficient no of plant in orchard, old age orchard, least interference of Govt. towards increasing productivity, i.e. inadequate and untimely subsidy, problems of fruit drop, size of fruit,Poor management. Pest infestation etc. causes declined in the production of major fruit (mango) and vegetables in Bihar. It may further revealed that according to ranking assigned to each constraints low price spread, low bargaining power, lack of market information were identified as the top three constraints in marketing however for production it was given first rank to lack of fund followed by lack of suitable variety of fruits and vegetables adopted by the farmers and poor management at farm level causes decline in area, under fruits in Bihar. Later on it was tested to check the extent of influence of these assigned constraints in decision on production and marketing of these crops in the study area by using Kendall's coefficient of concordance test.
The identified constraints were ranked accordingly and were weighted according to preference given by a group of farmers consisting of 24 farmers in each group irrespective of level of income, and size of holding i.e., total of 10 groups. The Chisquare at n-1 d.f - was estimated as 60.918 and calculated value was 64.38 observed to be greater than Chi-square table value at 1% and 5% level of significance. Indicated major problem of farmers were inadequate knowledge of market information system, and dis-satisfaction from market price of fruits and vegetables & major constraints identified for vegetable marketing were unavailability of cold storage facility; lack of processing plant in the state etc. Where as senile orchard, lack of adequate knowledge of maintenance, unavailability of fund and input were highly significant constraints for production of these crops in the state.
CONCLUSIONS
The compound growth rate of fruits in Bihar indicated that all selected fruit has shown an increasing trend in area, production and productivity except mango. The demand supply projection of major vegetable was estimated to be about 12.12 million tones in 2011 which would be expected to increase about 17.46 million tones by the year of 2031 which is sufficient to meet out the expected population growth by the year of 2031. If this would likely to continue in future, Bihar would be surplus state and would have large potential of such crop to export in other State/Country. The demand and supply projection of major fruits indicated that Bihar as a whole being a deficit state. However, in some selected districts of state has surplus production and supply but it needs greater emphasis on postharvest management to consolidate the benefits of large potential of fruits and vegetables in Bihar economy as whole and to nurture a healthy, competitive and vibrant horticultures. Data of five major round i.e. 38th, 43t, 50th, 95th and 66th pertaining to the periods of 1983-84, 1988, 1993-94, 1999-2000, 2005-06 and 2009-10 respectively, shown a positive growth in annual per capita expenditure on fruits and vegetables and found to be more in urban areas than in rural areas. Results of the study revealed that vegetables have emerged as an essential commodity recording income elasticity of demand lower than most of non-cereal commodities, while fruits continued to be more elastic. It may further revealed that according to ranking assigned to each constraints low price spread, low bargaining power, lack of market information were identified as the top three constraints in marketing however for production it was given first rank to lack of fund followed by lack of suitable variety of fruits and vegetables adopted by the farmers and poor management at farm level causes decline in area, under fruits in Bihar.
POLICY IMPLICATION
A wide spread increase in consumption of vegetables and fruits was observed across different income groups in both rural and urban area. The relationship between supply and price of major fruits and vegetable indicated that during the peak period price of vegetable fruit was low and during off season the price of any fruits and vegetable was comparatively higher but due to lack of processing plant, storage facility of fruit and vegetable, prospects of trade of these product has been declining in the state. Despite of such strong area, production and productivity base of fruits and vegetables be still not reach up to satisfactory level where we can export it to other state or Country. The study suggested that, vegetable and fruit are now being viewed at market of national importance owing to the fact that these have large export potential, thus, it can be said that efficient domestic marketing system can only promote the export of these crop. In this regard, it is suggested that the importance of post-harvest management for fruit and vegetable trade should not be ignored. New strategies need to be decided to promote adoption of post-harvest technology by the fruit and vegetable growers while preparing them for marketing. The creation of market infrastructure from export point of view such as creation of pre-cooling, cold storage, air cargo, packinghouse etc. may be taken up by the concerted efforts of the Central and State Govt. This calls for greater role on the part of researcher to develop high yielding varieties and to involve better management practices. Efficient post-harvest management through promotion of infrastructure development is another way to increase availability of vegetables and fruits. It was estimated that the state would have a trade surplus in both fruits (Mango and litchi) and vegetables. The policy makers could promote processing of these vegetables and fruits for value addition and also explore export avenues. However, in the long run the emphasis would be on increasing the productivity of vegetable and fruits in the state.
REFERENCES
Agricultural Statistics at a Glance, 2011, Ministry of Agriculture, Government of India.
Anonymous, 2008. Bihar's agriculture development: Opportunities & challenges. Government of India, New Delhi.
Bouis, H. 1996. A Food Demand System Based on Demand for characteristics. If there is curvature in Slutsky Matrix. What do the curves look like and why? Journal of Development Economics, 51(2): 239-66.
Cuddy and Della, V. 1978. Measuring the Instability of the Time Series Data, Oxford Bulletin of Economics &Statistics, February, 1978.
Government of India, 2015. Statistical Year Book, India 2015. http://mospi.nic.in/Mospi_New/upload/SYB2015/index1.html (Accessed on 10th May, 2015)
Kumar, P. 1998. Food Demand and supply projection for India. Agricultural Economics policy paper 98-01, New Delhi Indian Agricultural Research Institute.
Kumar, P. and Kumar, P. 2003. Demand, supply and trade prospective of vegetables and fruits in India, Indian journal of Agricultural Marketing, 17(conf.): 121-30.
Kumar, P. and Mathur, V.C. 1996. Structural changes in the Demand for Food in India. Indian Journal of Agricultural Economics, 51(4): 664-773.
Nadkarni, M.V. 1971. Yield uncertainty in Maharashtra Agriculture, Indian Journal of Agricultural Economics, 26(3): 327 -33.
National Horticulture Mission, 2014. Department of Agriculture & Cooperation, Ministry of Agriculture, Government of India. http://nhm.nic.in/Archive/Banana. pdf (Accessed on 10th May, 2015).
Ranjan, K. Indian Agriculture: Challenges ahead, Yojana, 37: 46.
Siegel, S. 1966. Nonparametric statistics for the behavioural sciences. McGraw-Hill series in psychology, McGraw-Hill, New York, pp. 312.
Subramanian, K.U. 1986. Post harvest losses in horticultural crop- An appraisal, Agricultural Situation India, 41: 339-43.
Waheed, A., Iqbal, M.Z. and Shah, F.H. 1986. Post harvest losses in vegetables, Pakistan Journal of Scientific and Industrial Research, 29(4): 268-73.
Yadav, S.S. 1995. Problems and prospects of export of fruits and vegetables. Indian Journal of Agricultural Marketing, 9(2): 127-36