International Journal of Agriculture, Environment and Biotechnology
Citation:
DOI: 10.30954/0974-1712.03.2020.1
![]()
AGRICULTURAL ENGINEERING
Assessment of Groundwater Potential Zones of Tons Basin Using Spatial Data
ABSTRACT
The Tons basin is the subbasin of the river Ganga having its geographical extent of 80°18’ to 83°20’ east longitude and 23°58’ to 25°17’ north latitudes of the country. The major river in this sub-basin. Tons is the longest tributary of Yamuna river. Total basin area in Madhya Pradesh is 11974 km2. Total land put to use for agriculture purpose in Tons basin is 8460 kirf. State of Madhya Pradesh has varied hydrogeological characteristics due to which ground water potential differs from place to place. An attempt has been made to delineate the groundwater potential zone of the Tons basin using spatial data. For delineation of groundwater potential zones, thematic maps of different governing themes of groundwater potential zone such as geology, drainage, drainage density, Land use/Land cover, slope, soil texture have been created to their relative importance. A multicriteria decision analysis technique i.e., Analytical Hierarchy process (AHP) technique have been used for the probable weightage of different governing themes. Weighted index overlay analysis tool in ArcGIS 10.3 have been used for the creation for groundwater potential zone. The resultant map demonstrates possible groundwater potential zone of the Tons basin under three categories such as Good groundwater potential, moderate groundwater potential and poor groundwater potential. From the study it was concluded that, delineation of groundwater potential zones helpful for the information of groundwater prospective zone, extraction and development of groundwater and better planning and management.
Highlights
 This study conducted in Tons basin of Madhya Pradesh state, India to delineate the groundwater prospect zones using spatial data.
Overexploitation and further declination of groundwater in Tons basin causes need to delineation of groundwater potential zone.
In this study, we employed maximum five paraments governing the groundwater potential zone.
Keywords: Groundwater potential zone, Thematic maps, Weighted index overlay analysis, ArcGIS, Analytical Hierarchy process (AHP)
Water is an important requirement for survival of living beings and it plays an important role as economy also. Groundwater is one of the most valuable natural resource on the earth surface, which supports human health, ecological diversity and economic development. A proper planning of ground water exploitation by using modern techniques is helpful for controlling of the exploitation of groundwater. In India many villages, Town, Cities facing the problem of limited ground water availability. Day by day due to excessive and wastage of groundwater use the water table depth is also goes on decreasing, which results the well and tube wells become dry. The ground water mapping is essential for the exploration of ground water potential zones with appropriate limitations. The ground water existence, its quality and the possibility to explore it, depends on aquifer properties. In increasing demand of water for various purposes like agricultural usage, domestic usage and, industrial usage, a greater focus is being for a planned and optimal utilization of water resources.
How to cite this article: Nigam, A., Awasthi, M.K. and Bunkar, N. (2020). Assessment of Groundwater Potential Zones of Tons Basin Using Spatial Data. IJAEB, 13(3): 261–268.
Source of Support: None; Conflict of Interest: None ![]()
The Remote Sensing and Geographical Information System (GIS) techniques are being effectively used to delineate groundwater potential zones of any watershed region. This tool is helpful to collect the large information of accessible and inaccessible areas by quick and accurate processing of the data available. Moreover, GIS can be used to effectively utilize remotely sensed data and extract useful information. Integration of data using remote sensing technology and GIS techniques provides a reliable and accurate data base for the land and water resources management and development. The available remote sensed data can be effectively manipulated in the GIS for the preparation of various thematic maps of any area, such as, geology, soil texture, land use/ cover, drainage etc. combining these maps more cumulative information can be obtained which is helpful for the decision making. AHP technique proposed by the Saaty TL as a method of solving the decision-making problems has been used for the identification of groundwater potential zones. The groundwater occurrence is highly variable depending on the nature and availability of secondary porosity of the rocks S.G. Dev et al. (2015). In the Tons basin major problems of some regions are declining of water table specially during summer season. In the summer season bore well and the wells are dried which cause the problem of drinking water and agriculture practices. In this context, an attempt has been made to delineate groundwater potential zones of study area.
MATERIALS AND METHODS
Study area
The tons basin was selected for the research work. Tons basin is the sub basin of the Ganga river. Total land put to use for agriculture purpose in Tons basin is 8460 km2. The major river in this sub-basin the Tons is the longest tributary of Yamuna river. The geographical extent of the Tons sub-basin lies between 80°18’ to 83°20’ east longitude and 23°58’ to 25°17’ north latitudes of the country. The total geographical area of the Tons basin is 12570 km2. Location map of Tons basin shown in Fig. 1.
Data product used in the study
Shuttle Radar Topography Mission (SRTM) 30-m resolution data were used for identification of slope, drainage and drainage density of the study area. The Sentinel-2B data were used for the land use/ land cover analysis of the Tons basin. Soil texture map was prepared by using National bureau of soil survey and land use planning (NBSS & LUP), Nagpur. Net groundwater availability data were collected from Water resource department Madhya Pradesh for the validation of groundwater potential zone.
Methodology
Previously we have decided outlet of the basin and with the help of Snap pour point method base map of the basin was prepared in ArcGIS 10.3. In ArcGIS software different thematic map of governing theme such as, slope map, geology map, drainage map, and soil map were prepared using data were collected. Sentinel-2B satellite imagery was used for the Land use/Land cover map preparation in ERDAS IMAGINE software. From the drainage map we calculated and created drainage density map. Using Shuttle Radar Topography Mission (SRTM) data slope map has been created. Then by using Multicriteria decision technique (MCDM) i.e. Analytic Hierarchy process (AHP) was used for deciding the probable weightage of governing theme. Then all created maps were reclassified and by using Weighted overlay analysis tool in ArcGIS software groundwater potential zone of Tons basin were classified. After classification we classified the groundwater potential zone into three categories such as good groundwater potential zone, moderate groundwater potential zone and low groundwater potential zone. After the map preparation groundwater potential map was verified using net groundwater availability data from Water resource department Madhya Pradesh.
RESULT AND DISCUSSION
For the identification of groundwater potential zone there are five parameters were used and map of all parameters were prepared in ArcGIS. Each of parameter has been assigned their weight and ranked based on the basis of their influence to groundwater potential zone using Satty’s analytical hierarchical process.
Slope
Slope can be defined as the horizontal spacing between contour lines. In raster data every pixel size has its own value of slope, and the difference between them give slope value. Topographic data is very useful in terms of groundwater potential, if the slope is flatter then there will be more water accumulation and more chances of good groundwater potential than the steeper slope. The slope of the Tons basin has its maximum value in the range of 49–84%, and minimum value of the slope is 12%. Basin was classified into five slope categories and the minimum slope range was assigned as rank one, while the maximum slope range was assigned as rank five shown in table 3. Slope map of the basins is shown below in fig. 3.
Geology
Geology is the study of earth of which it is made, the structure of those materials, and the process acting upon then. It is the study of how earth’s materials, structure, processes and changed over time. Geology tells about the formation characteristics, if formation is porous it contains more water and good permeability. Geology of the study area was comprised of mainly Upper Vindhyan (Rewa gp), Lower Vindhyan (Semri gp) and Deccan trap. The Semri Group is the oldest group of the Vindhyan Supergroup. Vindhyans Comprise of sand stone, shale and limestone. Sand Stone and Shale are hard and compact forming poor aquifers, Limestone has secondary permeability. Deccan Traps comprises weathered, fractured, jointed and vesicular units of Basalts form moderate to good aquifers, this type of units form the most important aquifers in the region. Geology of the Tons basin is shown on fig. 4.
Drainage Density
Drainage pattern shows the characteristics of surface and sub-surface formation. Drainage density is an important factor for evaluating groundwater potential zone. Drainage density is the closeness of spacing of stream channels as well as nature of surface material. More the drainage density, higher would be runoff and less will be the recharge. Basin was classified into three drainage density classes i.e. low drainage density, moderate drainage density and high drainage density. Due to less runoff low drainage density has assigned rank one, while high drainage density as rank three shown on table 3. Drainage density map of the basin is shown on fig. 5.
Soil Texture
Soils are the resultant product of weathering of parent rocks caused by difference in temperature and hydration effect, Kumar et al. (2017). The Tons basin were classified into six soil classes, such as calcareous clay, calcareous loamy, clayey, loamy, loamy skeletral and sandy soil. The soil which having fine soil particles like clay has low water transmitting capacity, and soil which are coarser in nature have greater capacity to transmit the water and hence this soil is more useful for recharging the groundwater. The ranks of different classes are given in table 2. Soil texture map of the Tons basin is shown on fig 6.
Land use/Land cover
Land use land cover is an important factor related to ground water potential zoning. Land use Land cover provides information about the kind of surface cover in the land, because infiltration of the water is much depending on the kind of surface cover. Land use land cover of the study area was classified into six categories, such as Water bodies, Agriculture and other vegetation, Forest, Open land, Waste land and Habitations. Land covered with vegetation will more helpful for recharging the ground water, by losing the soil and rocks by biological decomposition of roots and by reducing evaporation directly from the soil. Land with habitation is covered with more impervious concrete surfaces and more will be the runoff and less water recharge will take place. Due to more contribution to groundwater water body has assigned rank one while habitation due to poor recharge assigned lower rank shown in table 3. Accuracy assessment of land use land cover is shown on table 1. Land use/Land cover shown on fig. 7.
Overall Classification accuracy (%) 87.36; Overall Kappa statistics 0.82.
Multi criteria decision analysis
Multiple-criteria decision-making (MCDM) or multiple-criteria decision analysis (MCDA) is a sub-discipline of operation research that is useful for the decision making. In this various theme were assigned weightage as per their influence on groundwater potential zone. Satty’s Analytic Hierarchy process was used for the decision analysis. In this process, pairwise matrix was created based on relative importance of parameter to groundwater potential zone. Satty’s provide consistency check of the weight assigned. In order to check consistency, satty’s suggested consistency ratio.
Where, n = number of factors and λmax = average value of the consistency vector.
Value of random index can be obtained from the table available by Satty’s given below on table 2. Consistency ratio is less than 0.1 is acceptable for specified judgments.
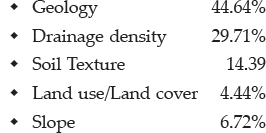
The percentage weight given to each parameter using Satty’s Analytic Hierarchy process are as follows:
Identifification of Groundwater Potential Zone
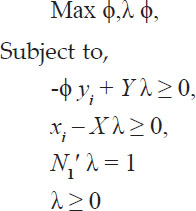
By using weighted overlay analysis different thematic map such as geology, slope, land use/land cover, soil and drainage density were integrated as per their importance with one another. Equation was used to calculate groundwater potential index (Benjmel et al. 2020).

where, GWPI = Groundwater potential index, GG = Geology, DD = Drainage density, SL = Slope, LC = Land use/land cover, SD= Soil texture
subscripts ‘w’ = normalized weight of a theme and ‘wi’ = normalized weight of the individual features of a theme, respectively.
The Groundwater potential zone of the basin were classified into three categories as good groundwater potential, moderate groundwater potential and poor groundwater potential. In Satna district groundwater potential is good, which accounts 43.24% of total area of tons basin. Groundwater potential of Rewa district is moderate to good, which accounts 50.93% of total area of Tons basin. In Northern Part of Rewa district groundwater potential is moderate. Groundwater potential of the Sidhi district area is low to moderate, which accounts 3% of total basin area. Identifiction of groundwater potential zones help for the extraction, development and management of groundwater. It also provides better location for water harvesting and groundwater recharge structure for recharge of groundwater. Groundwater potential zone of the study area is shown below in the Fig. 8.
Validation on the basis of Net groundwater availability in ha-m-
As per data available district wise groundwater availability, Satna district have 61419.25 ha-m net ground water availibility, and potential map which was prepared also showing good groundwater potential. In Sidhi district net groundwater availability is 32259.48 ha-m, and in the map Sidhi district classified as low to moderate groundwater potemtial. Rewa district showing good groundwater potential, and the net groundwater data available is 59043.19 ha-m. District wise Net Groundwater availability of Tons basin is shown on fig. 10.
Validation on the basis of Depth of Groundwater below ground level in meter
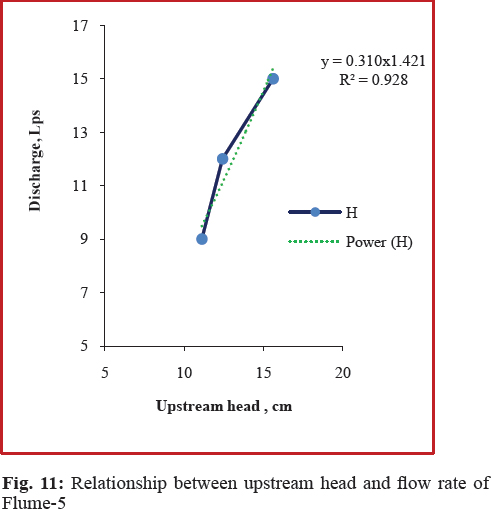
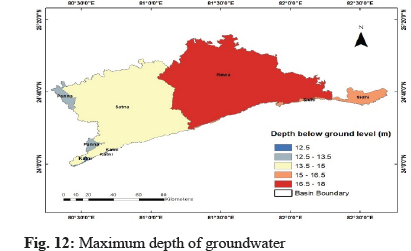
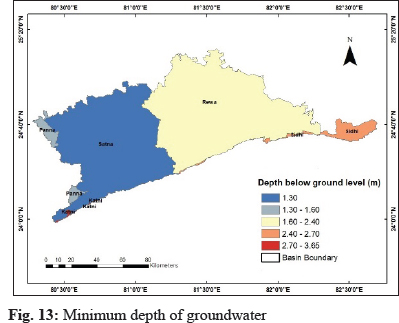
As per data available on the depth of groundwater below ground level, average minimum depth of ground groundwater below ground level is minimum in Satna district, which is 1.29 meter. And the depth of groundwater below ground level (m) are 1.55, 2.392, 2.675, 3.625 of Panna, Rewa, Sidhi and Kami district respectively. Average minimum and maximum groundwater depth below ground level in shown below with the help of graph and map representation below in Fig. 11, Fig. 12 and Fig. 13 respectively.
CONCLUSION
Groundwater potential zone helps for the development and proper utilisation of the groundwater. It may provide proper site selection for dug wells, borewells etc. and also helpful for the planning of recharge structures and harvesting structures. By qualitative analysis of the groundwater we can obtain the infromation about the groundwater quality. Multi critria decision analysis, AHP technique is very helpful and efective technique for decision making. Remote sensing is very helpful for collecting the information about any objects, area or phenomenon without making any physical contact and collects information of inassesible areas where we can not collect information and it is very efective and less time consuming and whereas GIS, provides a platform for mainipulation, analysis to extract the required informations.
ACKNOWLEDGEMENTS
I would like to express my great appreciation to my research guide Dr. M.K. Awasthi and all members of my advisory committee. I would also like to thanks to my seniors and friends for their kind cooperation.
REFERENCES
Rajat Agarwal, Garg P and Garg, R. 2013. “Remote Sensing and GIS Based Approach for Identification of Artificial Recharge Sites,” Water Resources Management: An International Journal, Published for the European Water Resources Association (EWRA), Springer; European Water Resources Association (EWRA), 27(7): 2671–2689.
Ahmad, Imran, Sankar, Kiruba and Dar, Imran. 2010. Remote sensing technology and geographic information system modeling: An integrated approach towards the mapping of groundwater potential zones in Hardrock terrain, Mamundiyar basin. Journal of Hydrology, 394: 285–295.
Arkoprovo, B., Adarsa, J. and Prakash, S.S. 2012. Delineation of Groundwater Potential Zones using Satellite Remote Sensing and Geographic Information System Techniques: A Case study from Ganjam district, Orissa, India.
Benjmel, K., Amraoui, F., Boutaleb, S., Ouchchen, M., Tahiri, A. and Touab, A. 2020. Mapping of Groundwater Potential Zones in Crystalline Terrain Using Remote Sensing, GIS Techniques, and Multicriteria Data Analysis (Case of the Ighrem Region, Western Anti-Atlas, Morocco). Water 2020, 12, 471
Bera, Kartic and Bandyopadhyay, Jatisankar. 2013. Ground Water Potential Mapping in Dulung Watershed using Remote Sensing & GIS techniques, West Bengal, India. International Journal of Scientific Research, 12: 1–2250.
Etishree Agarwal, Rajat Agarwal, Gargand, R.D. and Garg, P.K. 2013. Delineation of groundwater potential zone: An AHP/ANP approach. J. Earth Syst. Sci, 122(3): 887–898.
Ganapuram, Sreedhar, Kumar, G.T., Krishna, I.V., Kahya, Ercan and Demirel, Mehmet. 2009. Mapping of groundwater potential zones in the Musi basin using remote sensing data and GIS. Advances in Engineering Software, 40: 506–518.
Ghosh, P., Bandyopadhyay, S. and Jana, N. 2015. Mapping of groundwater potential zones in hard rock terrain using geoinformatics: a case of Kumari watershed in western part of West Bengal. Modeling Earth Systems and Environment, 2: 1–12.
Hussein, Abdul-Aziz, Govindu, Vanum, Nigusse, Amare Gebre Medhin. 2016. Evaluation of groundwater potential using geospatial techniques. Applied Water Science, pp. 1–16.
Jagannathan, K., Kumar, N.V., Jayaraman, V. and Manivel, M. 1996. An approach to demarcate Ground water potential zones through Remote Sensing and Geographic Information System. International Journal of Remote Sensing, 17(10): 1867–1884.
Kara, Y. 2019. Measuring the Sustainability of Cities in Turkey with the Analytic Hierarchy Process. Open Journal of Social Sciences, 07(04): 322–334.
Ketan, S.K. and Sanyal, A.J. 2017. Assigning rank and weightage to landscape parameter to work on ground water potential-case of MIDIC Butibori Nagpur. International Journal of Advance Reseerch, 5(2): 1122–1125.
Lee, C.H. 2008. GIS for assessment of Groundwater Potential zone, Sustainable Environment Research, 58: 18–195.
Machiwal, D., Jha, M.K. and Mal, B.C. 2011. Assessment of groundwater potential in a semi-arid region of India using remote sensing, GIS and MCDM techniques. Water Resources Management, 25(5): 1359–1386.
Mukherjee, P., Singh, C.K. and Mukherjee, S. 2012. Delineation of groundwater potential zones in arid region of India—a remote sensing and GIS approach. Water Resources Management, 26(9): 2643–2672.
Nag, S.K. and Ghosh, P. 2013. Delineation of groundwater potential zone in Chhatna Block, Bankura District, West Bengal, India using remote sensing and GIS techniques. Environmental Earth Sciences, 70(5): 2115–2127.
Nigam, G.K. and Tripathi, M.P. 2020. Generation of Groundwater Zones for Selection of Prospective Suitable Water Harvesting Structure Sites for Sustainable Water Supply Towards the Agricultural Development. Agric. Res., 9: 148–160.
Preeja, R., Joseph, S., Thomas, J. and Vijith, H. 2011. Identification of Groundwater Potential Zones of a Tropical River Basin (Kerala, India) Using Remote Sensing and GIS Techniques. Journal of the Indian Society of Remote Sensing, 39(1): 83–94.
Ram Avtar, C.K. Singh, Satyanarayan Shashtri, Amit Singh and Saumitra Mukherjee. 2010. Identification and analysis of groundwater potential zones in Ken-Betwa river linking area using remote sensing and geographic information system, Geocarto International, 25(5): 379–396.
Rao, Y. and Jugran, D. 2003. Delineation of groundwater potential zones and zones of groundwater quality suitable for domestic purposes using remote sensing and GIS. Hydrological Sciences Journal, 48(5): 821–833.
Sahoo, P.C., Panda, P., Sahu, K.C. and Pattainak, D.S. 2018. Hydro Geomorphological Characteristics and Delineation of Ground Water Potential Zone - A Case Study of Rushikulya and Bahuda Basin, Ganjam Odisha. International Journal of Advanced Remote Sensing and GIS, 7: 2540–2550.
Sapna Pandey, 2013. Remote Sensing and GIS Based Assessment of Ground Water Potential Zones of Narsinghpur District in Upper Narmada Basin.
Savita, R.S., Mittal, H.K., Satishkumar, U., Singh, P.K., Yadav, K.K., Jain, H.K., Mathur, S.M. and Sham Davand. 2018. Demarcation of the groundwater potential zones in Kanakanala Reservoir Subwatershed, Karnataka by using RS and GIS approach.
Shashikumar M.C., Selvam, S., Lenin Kalyanasundaram, V. and Colins, J. 2017. GIS based Groundwater modeling study to assess the effect of artificial recharge: a case study from Kodaganar river basin, Dindigul district, Tamil Nadu. Journal Geological Society of India, 89(1): 57–64.
Thomas L Satty. 2008. Decision making with the analytic hierarchy process. International Journal Services Sciences, 1(1): 83–97.