International Journal of Agriculture, Environment and Biotechnology
Citation: IJAEB: 13(4): 423-430, December 2020
DOI: 10.30954/0974-1712.04.2020.6
![]()
SOIL SCIENCE
Characterization of Biochars from Various Agricultural ByProducts Using FTIR Spectroscopy, SEM focused with image Processing
ABSTRACT
Biochar is a charred final product by the pyrolysis of biomass. In this work, Fourier transform infrared (FTIR) spectra of various agricultural by-products (Pine needles, Rice husk, and grinded wheat straw, Bamboo leaves) derived carbonaceous biochars were investigated. The efficacy of FTIR spectra as a simple and rapid method for bio-physical characterization had been explored. The FTIR information was also discussed for explaining the biochar formation process. Results indicated the feasibility of FTIR in rapid and non-destructive biochar measurements for quality and production. Digital image processing has been used to identify the cell walls of the SEM images by using several filters and image histograms of all the SEM images are also generated. All the algorithms are used after careful consideration of noise removal using wiener filter to each of the images.
Highlights
 Agricultural by-products can be used as feedstock materials to produce biochar.
With pyrolysis, significant changes in chemical, physical, and structural can easily be revealed by FTIR spectra and SEM of biomass and biochar samples.
The proposed image processing method can detect the cell walls of SEM images after efficiently removing the noise from the original gray-scale images.
Keywords: biochar, agricultural by-products, fourier transform infrared spectroscopy, scanning electron microscopy, image processing
Universal mass availability and cheap cost make lignocellulosic biomass a substantial research component for renewable liquid biofuels (Singh et al. 2008). Fast pyrolysis is one of the ideal processes for single-step conversion of solid biomass to liquid fuels (Beall et al. 1974). Biochar is a carbon-enhanced final product of pyrolysis, and its biochemical understanding is essential for appropriate optimized application as soil additive (Guo et al. 2008).
Infrared analysis is not affected by fluorescence and can be regarded as a powerful technique for investigating molecular chemistry aspects in biochar (Socrates et al. 2001). Fourier transforms infrared (FTIR) spectroscopy was an analytical tool to determine the surface chemical properties qualitatively. A range of different methods for performing infrared analysis have been utilized to characterize biochars; FTIR-PAS (Fourier transform mid-infrared photoacoustic) spectroscopy, diffuse reflectance infrared Fourier transform (DRIFT) attenuated total reflectance Fourier transform infrared (ATR-FTIR) spectroscopy, synchrotron-based Fourier transform infrared (FTIR) spectroscopy and the most widely used method, transmission mode FTIR, where the samples are mixed with KBr to form a pellet. FTIR has been used principally to acquire point spectra when applied to a biochar surface (Chia et al. 2012).
How to cite this article: Ray, A., Banerjee, A. and Dubey, A. 2020. Characterization of Biochars from Various Agricultural By-Products Using FTIR Spectroscopy, SEM focused with image Processing. IJAEB, 13(4): 423–430.
Source of Support: None; Conflict of Interest: None ![]()
Scanning electron microscopy (SEM) has been established to be a powerful tool for monitoring the surface of plant cell wall modification (Yao et al. 2008). The challenging aspect of studying the change of cell distribution during pyrolysis is edge detection of the cell. MATLAB image processing is a promising tool for SEM image processing with the repertoire of various filters and transformations. To provide a more precise characterization of the cell wall morphology and structure, we developed a measuring process for cell walls using an image processing method for cells by separating the desirable layer from the image. In the present study, scanning electron microscopy (SEM) and Fourier transform infrared (FTIR) spectroscopy investigations of the effects of pyrolysis treatment on cell wall disruption, composition, ultrastructure, and surface properties were carried out in order to better understand the pyrolytic changes.
EXPERIMENTAL
Preparation of materials
Four different biomasses (Pine needles, Rice husk, and grinded wheat straw, Bamboo leaves) ha been used in this study. The biomass samples were ven-dried (70°C) and grounded into 2–2.5 mm pieces as feedstocks for biochar production. A tube fu nace was used to convert them into biochar samp es in an N2 environment at different temperatures for 45 mins.
Sample a: Pine needles (Pinusrox burghii) pyro yzed at 420 °C for 45 min in an oxygen-free environent.
Sample b: Rice husk (Oryza sativa) pyrolyzed at 430 ?C min in an oxygen-devoid environment.
Sample c: Grinded wheat straw(Triticm aestivum) pyrolyzed at 410 °C in oxygen-free codition.
Sample d: Bamboo leaves (Dendrocalamus hamiltonii) pyrolyzed at 390 °C in anoxygenic codition.
FTIR analysis
Biochar Infrared Spectroscopic Analysis Infrared spectra were recorded on a Bruker FTIR spectrometer, collected in transmittance, resolution of 4 cm-1, 225 scans using OPUS software. Samples were prepared in KBr, 10 wt %, and pressed into a pellet. Spectra shown are normalized at ca. 850 cm-1 (Guo et al. 1998).
SEM of samples
Scanning electron microscope (SEM) imaging analysis was carried out by using a JEOL JSM-6400 Scanning Microscope. Different ranges of magnifications (x400, x300, x550, x600, x800) were used to evaluate the surface structure characteristics of the biochar samples.
Image processing of SEM images
Fig. 1 shows a flow chart of the image analysis process developed in the study. The analysis was carried out in two phases. In the first phase, the boundaries of each cell on the image were detected. The boundary can easily be detected from a high pass filter, which was obtained from the SEM images. However, the cell boundaries at the crossover area are difficult to be identified from the image.
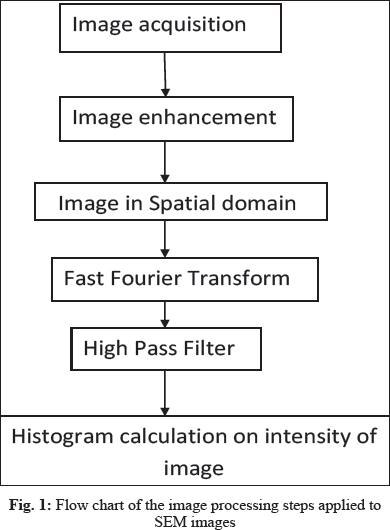
Image Enhancement
It is necessary for the frequency domain Wiener filter to estimate the original image and noise power spectra from the observed noisy image in most of the cases. Wiener low passes filter filters a grayscale image posed at constant power additive noise degradation. Wiener method uses pixel-wise adaptive manner, statistical estimation for each pixel of the local neighborhood of size m-by-n (Maini et al. 2010).
In the frequency domain, the Wiener filter is given by,
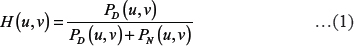
Where PD (u, v) and PN (u, v) represent the power spectra of d (i, j) and n (i, j), respectively
Spatial Filtering Technique
Spatial filtering has been moving the filter mask from another point on the image pixels. At every single point of (x,y), the filter response can be tracked.
Spatial filters can be either linear or nonlinear. In linear filter, every pixel value is a weighted pixel sum of the corresponding neighborhood pixel in the input image. Noise reduction is more efficient in a nonlinear filter than linear. Nonlinear filtering operation is based on the pixel values in the neighborhood (Weeks et al. 1996).
Fast Fourier Transform (FFT)
Fourier Transform decomposes an image signal into its real and imaginary components, which is a representation of any image signal in the frequency domain. If the input signal is an image, then the number of frequencies in the frequency domain is equal to the number of pixels in the spatial domain. The inverse transform re-transforms the image frequencies in the spatial domain. The FFT and its inverse of a 2D image are given by the following equations:
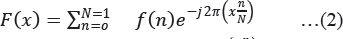
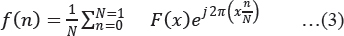
Where f (m, n) is the pixel at coordinates (m, n), F(x, y) is the value of the image in the frequency domain corresponding to the coordinates x and y, M and N are the dimensions of the image (Welch et al. 1967).
Dynamic Range Compression (Log transformation)
The display device is not always capable of the dynamic range of the image. Compressed dynamic range thus easily makes the lucid transformation of the insignificance of the image. Log operator is an outstanding function for compression. Thus, Dynamic range compression is attained using the log operator (Rahman et al. 1996).
Formula used:

Where, C = normalization constant; r = input intensity
High pass filter
5A high pass filter basically sharpens the image in the frequency domain. Emphasizing fine detail in the image is the major objective of sharpening. A high-pass filter passes high frequencies but attuned lower than cut-off frequencies (Wu et al. 2003).
Histogram equalization
Let the two-dimensional image W (i,j) composed of V discrete gray levels, denoted by {W0,W1,…,Wk,…, WV1}. The probability density function (PDF) of Wk is defined as,

Where k = 0; 1; … ; V-1, nk = number of pixels that have the value of k, and n is the total number of samples. Note that PDF (Wk) is associated with the histogram of an input image that represents the number of pixels that have a specific input intensity Wk. A plot of nk versus Wk is known as the histogram of image W (i,j) (Sim et al. 2007).
RESULTS
FTIR results of Biochar
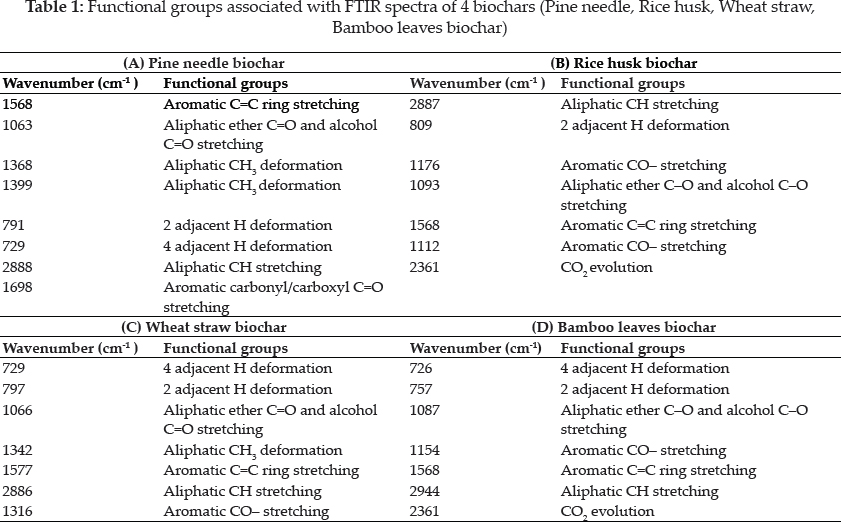
The FTIR spectra were recorded in the transmission mode between 4000 and 650 cm-1 for all 4 samples (Chia et al. 2012) (Fig. 2 & Table 1). As can be seen from the FTIR results given in Table 1, all original biochar samples have similar aromatic and aliphatic functional groups. The table presents that all biochar samples also has similar chemical groups. However, there is an alteration in the aromatic structure of biochar samples in comparison with biomass samples. The peaks between 700 and 900 cm-1 corresponding to an aromatic C-H stretching vibration, indicates the presence of adjacent aromatic hydrogen in biochar samples. CO2 formation is evident from the strong peak at 2361.
FTIR spectra with major peaks at 3405- 3443 cm-1 and 2360–2362 cm-1, 1539–1620 cm-1, 1568–1584 cm-1, 1400–1440 cm-1, 1180–1230 cm-1, and 10601080 cm-1, which correspond to v(-OH), v(-C(O) NH-), v(C=C), S(-OH) and 6 (CH), p(-CH2), and v(C-OH), respectively (Yang et al. 2007; You et al. 2019). When biomasses were pyrolyzed at above 400 °C, the peak intensities were largely reduced or shifted, especially the peaks representing v(-OH), vas(-CH2), v(-C(O)NH-), 6(-OH). Therefore, the phenol and amide groups were destructed by elimination such that the cellulose components were transformed into carbonaceous structures of biochar. Some non-condensable gaseous components with low molecular weight were easily identified by their prominent characteristic bands, such as CO (at ~ 726 cm), CH4 (at ~ 2925 cm), and H2O (at ~ 3394 cm). The peaks with the bands of 4000 to 3500 cm-1 indicated the releases of H2O from the pyrolysis process (Chen et al. 2018). Subsequent bands around 1650–1550 cm-1 represent C=C stretching vibrations caused by aliphatic or aromatic structures. Lots of organic compounds were identified from 1900 to 1000 cm-1 including the fingerprint region (14751000 cm). They were aromatics, phenols, alcohols, aldehydes, ketones, and acids releases mainly between 180 and 500 °C. The bending vibration at 1400–1300 cm-1 and the stretching vibration at 1200–1000 cm-1 were due to the hydroxyl group (C-O (H)) compounds. The spectral region of 1488–1400 cm-1 contains bands in the O-H bending region, which were most probably associated with alcohols and carboxylic acids. The peak around 1276 cm-1 indicated a C-O stretching peak (in acids, esters, ethers, and alcohols), and the peaks around 1034.17 cm-1 were associated with aromatic C-H in-plane bending.
SEM results
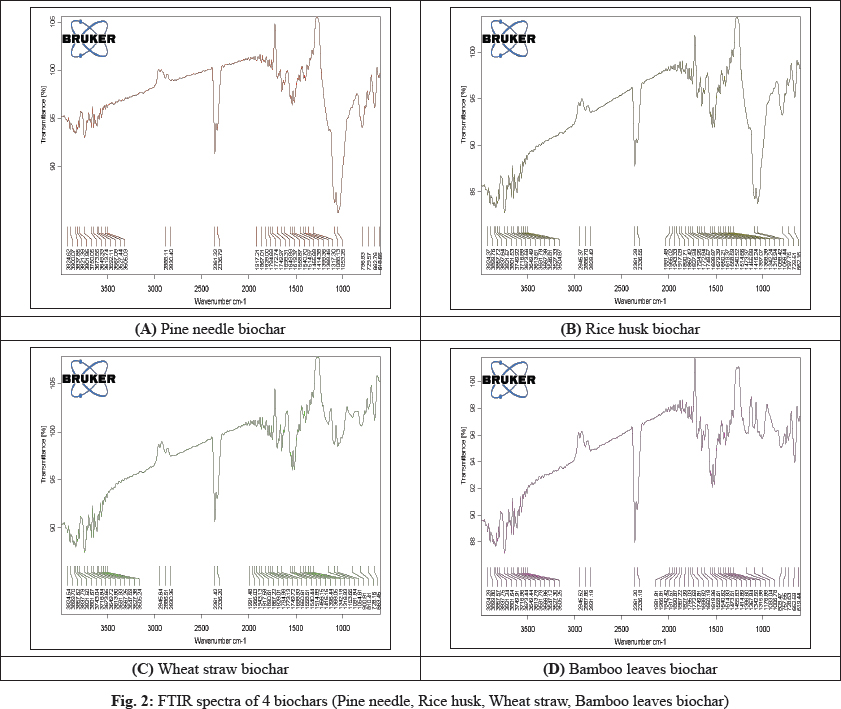
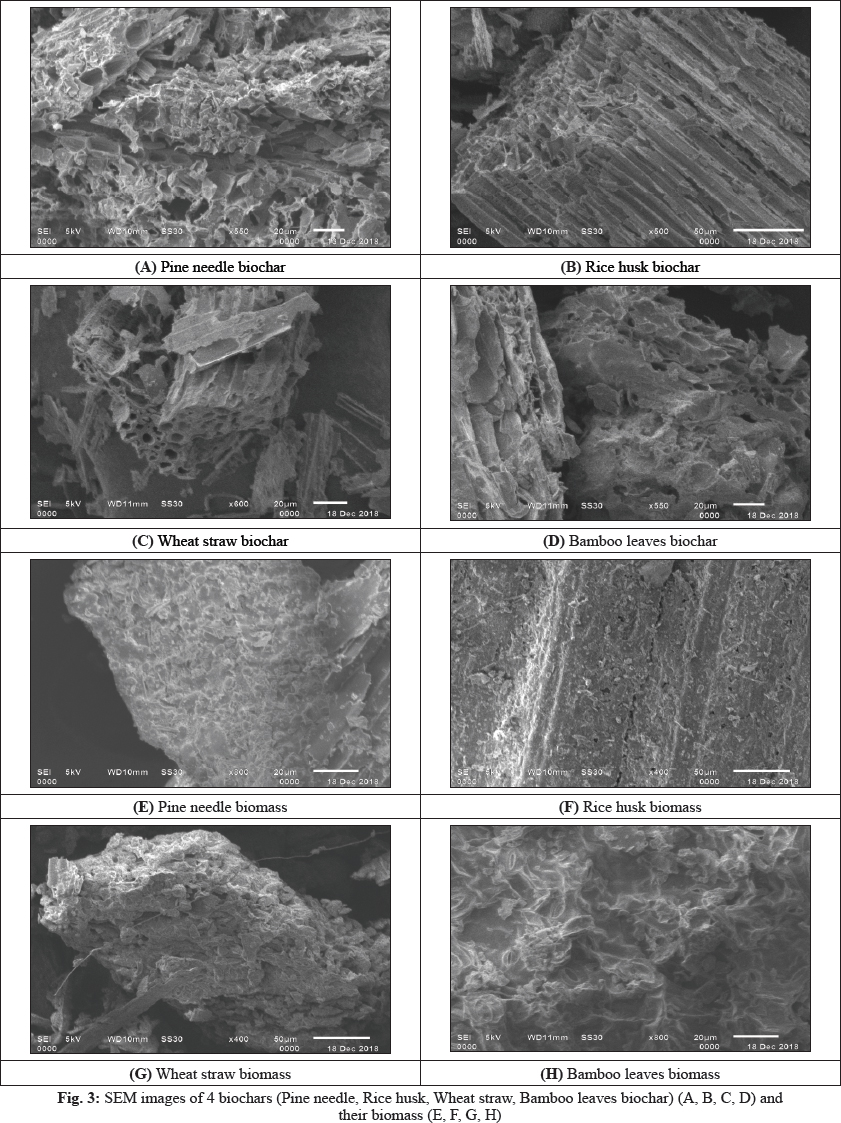
SEM micrographs of biomass were given in Fig. 3 (E, F, G, H). Scanning electron microscopy (SEM) is a potential method for examining the physical morphology of biochar. SEM images are very practical to acquire minute details about the porous structure of biochars, and the comparison between biochars and their raw materials would then allow us to draw conclusions on morphological changes during the pyrolysis.
It is obvious from the SEM micrographs that the surface morphology of biomass samples changed after pyrolysis. Biochar samples containing carbonaceous materials with several cracks and holes due to the evolution of volatile matter during pyrolysis. The level of devolatilization has a considerable effect on the characteristics of the biochar. As known, as high the volatile matter releases, biochars produced with lower densities, higher porosities (Lee et al. 2010). SEM images Fig. 3 (A, B, C, D) of biochar samples, biochars have inside porous structure and tubes, whereas the porous framework of biomass samples is not typically found. Thus, it is promising to employ the biochar samples as carbon biomass for producing different carbon materials such as carbon nanotubes, activated carbon, etc.
Image Processing
Image enhancement and histogram equalization
The results obtained by each implementation of the Wiener filter on the degraded images are shown in Fig. 4. HE can introduce a significant change in image brightness.
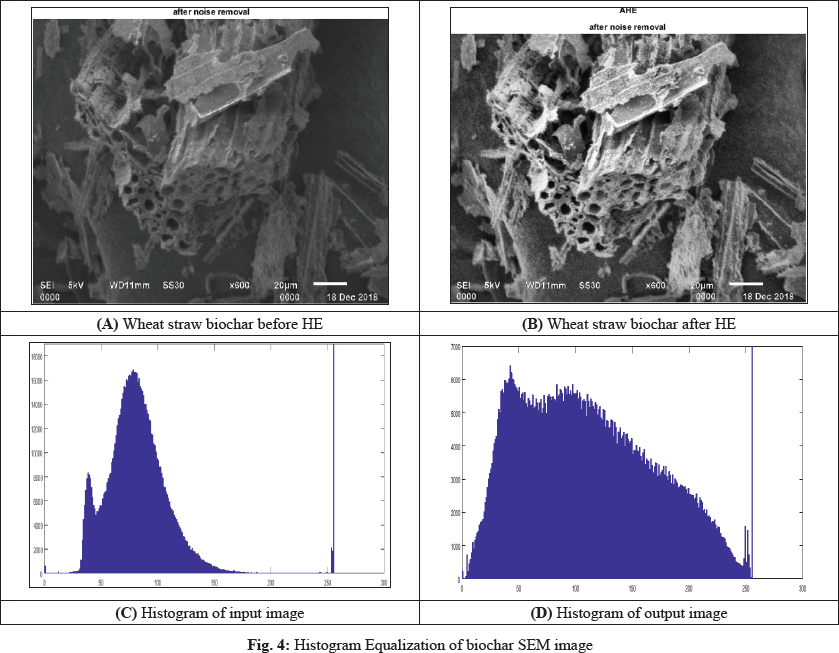
For instance, after applying the HE method, the intensity level of the output image is much superior o the original input image. Usually, the HE maps its input to a gray level that is proportional to the cumulative density. The fundamental reason behind this limitation is that it does not take the image mean brightness into account. In the next subsection, we will show that the mean brightness of the HE method output image is the middle gray level instead of the input image mean (Maini et al. 2010).
Filter Processing
Fourier Transform decomposes an image into its real and imaginary components, which is a representation of the image in the frequency domain. Once the image is transformed into the frequency domain, filters can be applied to the image by convolutions. FFT turns the complicated convolution operations into simple multiplications. An inverse transform is then applied in the frequency domain to get the result of the convolution. Thus dynamic range needs to be compressed. Log operator is an excellent compression function. Thus, Dynamic range compression is achieved using a log operator. A high-pass filter is a filter that passes high frequencies well but attenuates frequencies lower than the cut-off frequency. Sharpening is fundamentally a high pass operation in the frequency domain.
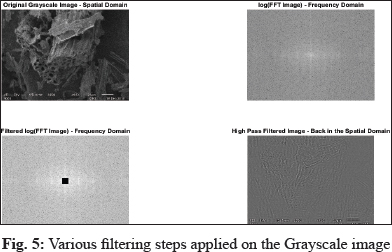
Now the cell wall structure and shape are very prominent in the image (Weeks et al. 1996). Fig. 5 shows the original input gray-scale image and its transformation after applying log transformation, filtered log transformation, and high pass filter. Each of the below images characterizes the cell wall in both the spatial domain and frequency domain.
DISCUSSION AND CONCLUSION FOR THIS STUDY
This study demonstrates the effectiveness of FTIR spectroscopy in the rapid measurement of biochar formation. With pyrolysis, biomass underwent a number of significant changes in chemical, physical, and structural aspects. These changes can easily be revealed by FTIR spectra of samples. The proposed image processing method is capable of detecting the cell walls of SEM images after efficiently removing the noise from the original gray-scale images. The obtained results are cross verified by using several other filtering techniques, including high pass filter, filtered log FFT, log FFT. The Center area of FFT provides intensity information, and the outer region corresponds to the edges of the image.
REFERENCES
B.P. Singh, A. 2008. Cowie, Carbon and Nutrient Management in Agriculture, Fertilizer and Lime Research Centre Workshop Proceedings, Massey University, Palmerston North, New Zealand, pp. 549.
Bartle, K.D., Martin, T.G. and Williams, D.F. 1975. Chemical nature of a super critical gas extract of coal at 350 °C. Fuel, 54: 226–35.
Beall, F.C., Blankenhorn, P.R. and Moore, G.R. 1974. Carbonized woods Physical properties and use as an SEM preparation. Wood Sci., 6: 212.
Blake, J.H., Bopp, G.R., Jones, J.F., Miller, M.G. and Tambo, W. 1967. Aspects of reactivity of porous carbons with carbon dioxide. Fuel, 46: 115.
Chia, C.H., Gong, B., Joseph, S.D., Marjo, C.E., Munroe, P. and Rich, A.M. 2012. Imaging of mineral-enriched biochar by FTIR, Raman and SEM-EDX. Vibrational Spectroscopy, 62: 248-257.
Daugaard, D.E. and Brown, R.C. 2003. Enthalpy for pyrolysis for several types of biomass. Energy Fuel, 17: 934–939.
Guerrero, M., Ruiz, M.P., Millera, A., Alzueta, M. and Bilbao, R. 2008. Energy Fuels, 22: 1275–1284.
Gundale, M.J., Thomas, H. and DeLuca, T.H. 2007. Charcoal effects on soil solution chemistry and growth of Koeleria macrantha in the ponderosa pine/douglas fir ecosystem. Biol. Fertil. Soils, 43: 303–311.
Guo, Y. and Bustin, R.M. 1998. FTIR spectroscopy and reflectance of modern charcoals and fungal decayed woods: implications for studies of inertinite in coals. Int. J. Coal Geol, 37: 29–53.
Lee, J.W., Kidder, M., Evans, B.R., Paik, S., Buchanan Iii, A.C., Garten, C.T. and Brown, R.C. 2010. Characterization of biochars produced from cornstovers for soil amendment. Env. Sci. Tech, 44(20): 7970–7974.
Maini, R. and Aggarwal, H. 2010. A comprehensive review of image enhancement techniques. arXiv preprint arXiv:1003.4053.
Rahman, Z.U., Jobson, D.J. and Woodell, G.A. 1996. Multiscaleretinex for color rendition and dynamic range compression. In Applications of Digital Image Processing XIX (Vol. 2847, pp. 183–192). International Society for Optics and Photonics.
Sim, K.S., Tso, C.P. and Tan, Y.Y. 2007. Recursive sub-image histogram equalization applied to gray scale images. Pattern Recognition Letters, 28(10): 1209–1221.
Socrates, G. 2001. Infrared and Raman Characteristic Group Frequencies—Tables and Charts, 3rd ed., J. Wiley & Sons, Chichester.
Steiner, C., Teixeira, W., Lehmann, J., Nehls, T., de Macedo, J.L.V., Blum, W. and Zech, W. 2007. Plant Soil, 291: 275–290.
Weeks, A.R. 1996. Fundamentals of electronic image processing (pp. 316–414). Bellingham: SPIE Optical Engineering Press.
Welch, P. 1967. The use of fast Fourier transform for the estimation of power spectra: a method based on time averaging over short, modified periodograms. IEEE Transactions on Audio and Electroacoustics, 15(2): 70–73.
Wu, D., Fang, N., Sun, C., Zhang, X., Padilla, W. J., Basov, D.N. and Schultz, S. 2003. Terahertz plasmonic high pass filter. Applied Physics Letters, 83(1): 201–203.
Yaman, S. 2004. Pyrolysis of biomass to produce fuels and chemical feedstocks. Energy Convers Mgt., 45: 651–71.
Yao, Y., Gao, B., Inyang, M., Zimmerman, A.R., Cao, X., Pullammanappallil, P. and Yang, L. 2011. Biochar derived from anaerobically digested sugar beet tailings: characterization and phosphate removal potential. Bioresource Tech., 102(10): 6273–6278.