
Economic Affairs, Vol. 65, No. 2, pp. 275-284, June 2020
DOI: 10.46852/0424-2513.2.2020.21
Comparative Economics of Neem Coated Urea Vis-a-Vis Normal Urea: Evidence from a Field-based Study in the Indian Context
ABSTRACT
This article is an output of the late led investigation entitled ‘Impact of Neem Covered Urea on Production, Productivity, and Soil Health in India' across six major agricultural states of India. A sample of 2200 farmers growing major crops using Neem Coated Urea (NCU) and Normal Urea (NU) under irrigated and un-irrigated conditions was selected randomly. Data was elicited for the agriculture year 2016-17 through a survey method. The per acre paid-out costs incurred by both NCU and NU users with respect to ploughing and sowing, seed /purchase of seedlings, organic/FYM, normal urea/neem coated urea, chemical fertilizers, plant protection chemicals, irrigation charges, harvesting & threshing charges, hired labour charges (including ploughing charges till planting, cost or sowing/ transplanting), imputed value of family labour, hired labour (amount paid) and maintenance costs on assets were worked out by way of comparing the economics of NCU and NU usage. The results reveal that the total paid-out costs of paddy have slightly increased in respect of NCU, as compared to NU. However, the net returns received amount to ₹ 23,616/-per acre and ₹ 19,517/-per acre, respectively. As regards tur, per acre total paid-out cost works out to ₹ 12,695 for NCU as compared to NU at ₹ 12,149 with a net return of ₹ 6,155 and ₹ 6,916, respectively. The paid-out costs incurred on cultivation of Sugarcane amount to ₹ 36,384 for NCU, as against ₹ 33,193 in the case of NU. Similarly, in respect of Soybean, the comparative paid-out costs amount to ₹ 9,776 for NCU and ₹ 8,660 for NU; ₹ 12,312 for NCU, as against ₹ 13,203 for NU, as in the case of maize; ₹ 15,349 for NCU, as against ₹ 15,353 for NU with reference to jute. Whereas, the net returns on sugarcane cultivation amount to ₹ 81, 122 for NCU, as compared to NU at ₹ 69,144; ₹ 8,012 for NCU, as against ₹ 6,611 for NU in respect to soybean; as regards maize, the returns realized amount to ₹ 17,110 for NCU, compared to ₹ 13,809 for NU; as for as jute is concerned, the returns amount to ₹ 3,082 for NCU, and ₹ 3,965 for NU, respectively.
Highlights
 Mandatory production and distribution of NCU started from May 2015 by the GoI.
NCU found to be cost-effective as compared to Normal Urea.
NCU benefits are much higher than Normal Urea.
Keywords: Neem coated urea, Normal urea, Cost of Inputs, Input use, Market Price, Gross Returns
India has been experiencing a rapid economic growth and development in the relatively recent years, especially after the introduction of a new economic liberalization policy in the early 1990s. The serious economic and political crisis that India was facing in the mid-1960s led to the introduction of new agricultural policies with a focus on technological breakthrough innovations and the import of new agricultural technologies from abroad. And it was a fortunate coincidence for India that the mid-1960s was a period when new seed-fertilizer technologies had started making their entry into the tropical developing world especially in the northern Indian states such as Punjab and Haryana with suitable climatic conditions.
How to cite this article: Ramappa, K.B., Jadhav, V. and Manjunatha, A.V. (2020). Comparative economics of Neem coated urea vis-a-vis normal urea: evidence from a field-based study in the Indian context. Economic Affairs, 65(2): 275-284.
Source of Support: None; Conflict of Interest: None 
The most important factor which promoted the dissemination of new technologies was the spread of private tube-wells for groundwater exploitation. In this context, Malik and Shekhar (2007) argued that in the absence of any significant breakthrough in the agricultural production technology having been achieved in the last several years, achieving the desired levels of agricultural production in the short- to -medium run would require more concerted efforts towards bridging the crop productivity gaps attainable with the existing technologies. Thus, the new seed-fertilizer technologies, especially for wheat crop, started disseminating very rapidly in the northern India and within a decade or so, the country was able to attaining food self-sufficiency, excepting a few drought years. On the other hand, there has been a spectacular increase in fertilizer consumption in the country since the advent of Green Revolution in the mid-sixties. Further, a series of economic liberalization measures implemented after 1991 in the country, have largely contributed to an accelerated growth of the economy. Considering the importance of agriculture in meeting the increasing food grain requirements of an evergrowing population of the country, ‘fertilizer', as an input in agricultural production, assumes a greater significance in terms of ensuring a sufficient food-grain production. In fact, it is important to note that this role has witnessed a comprehensive transformation of the traditional cultivation practice to modernization of agriculture. As the expansion of area under cultivation is not possible, arable land is declining (Venugopal, 2004), while soil is becoming increasingly deficient in many plant nutrients (Parama and Munawery, 2012) due to the intensive nature of agricultural production. Therefore, the use of fertilizers is vital to restoring soil fertility (FAI). However, an over use of fertilizers in general and urea in particular, over time, has affected the soil quality, resulting in a gradual reduction in the yield levels, across the country.
Fertilizer consumption has jumped from a less than million tons in the mid-1960s to 28 million tonnes by 2019-20. In fact, India ranks second in the world with respect to fertilizer consumption. Urea, one of the most prominent fertilizers, alone accounts for about 57 per cent of the total fertilizer consumption in the country. While fertilizer consumption, both in absolute terms and per hectare basis, has increased manifold over the years, the growth in the last few years has not been satisfactory (Malik and Shekhar, 2007). P. Mala (2013) has established that an increased fertilizer use efficiency leads to economy in the use of fertilizers, a reduction in the unit cost of production and prevention of af all in agricultural productivity. But, the pattern of fertilizer use appears distorted with a growing imbalance in the use of primary nutrients i.e., nitrogen (N), phosphorus (P), and potash (K). Current NPK use ratio is 7:2.7:1 as opposed to a desirable ratio of 4:2:1. Moreover, there exist huge variations in the fertilizer use across various states in the country. For instance, fertilizer use per hectare amounts to less than 10 kg in some of the North Eastern states such as Nagaland, as against 213 kg in Punjab or 262 kg in Telangana. Hence, there is a need for increasing per hectare fertilizer use in areas where there is a potential for growth in India. Likewise, there is a need for correcting the imbalance in the use of nutrients. An improper use of plant nutrients has led to multi-nutrient deficiency in the soils and the resultant soil health deterioration and stagnant crop yields. Recognizing the importance of plant nutrients, the Government of India, over the years,has taken various steps towards promoting a balanced use of fertilizers. The Task Force recommended the restoration of NPK use ratio at the macro-level through an increased use of nutrients P & K instead of reducing the intake of nitrogen.
It is a fact that about 82 per cent of nitrogen application in the country takes a place through urea. In order to increase the nitrogen-use efficiency of urea, the Government of India has made it mandatory to produce 100 per cent neem coated urea, including imported urea from June 2015. Neem coating results in as low release of urea, leading to a higher nitrogen use efficiency. Besides acting as a natural pesticide, neem also helps check the diversion of highly subsidized urea to non-agricultural uses. Further, in order to ensure a balanced use of fertilizers and reduce the consumption of urea, the Government of India decided to introduce a 45-kg bag of urea in place of 50-kg bags from 2018. Although the steps taken by the government so far appear to be well-intended, they have failed to promote a balanced use of fertilizers. Keeping this in background, the Impact of NCU on production, productivity, and soil health was carried out by the Government of India. The present article is part of the same project with the following objectives addressed:
MATERIALS AND METHODS
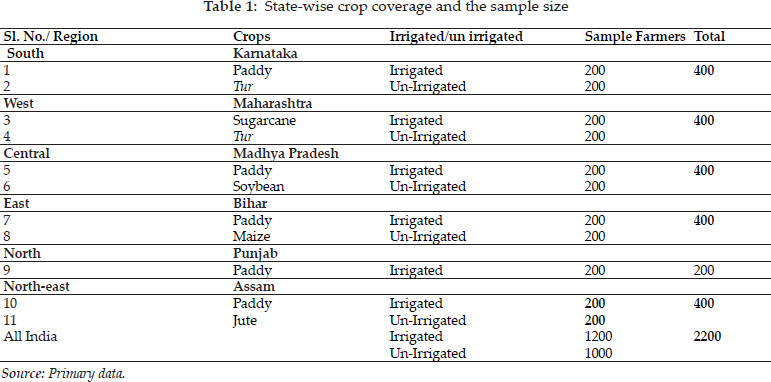
During 2015 Kharif season, both NCU and NU were available in the market across the study area even before the government made the production (100%) and distribution of NCU mandatory throughout the country. Hence, the present study collected the data pertaining to two seasons viz., Kharif 2014 representing Normal Urea (NU) usage and Kharif 2015 representing Neem coated Urea (NCU) usage as part of comparing the economic benefits of NCU and NU usage among the farming community. The present article relied upon primary data collected from the selected states in India with the reference periods being Kharif 2014(NU) and Kharif 2015 (NCU). Both irrigated and rainfed crops accounting for highest urea usage in each of the selected states were considered for the study. For each crop, two districts were selected based on the area under the selected crops and their urea usage within the state. From each district, two taluks/tehsils were selected based on the same criterion. Within the selected taluks, two clusters comprising 3-4 villages each were selected for conducting the survey. A total of 50 farmers from each taluk were selected with the total farmers adding up to 100 from each district. Households were selected randomly for assessing the NCU fertilizer use and its impact on crop production. The households were classified into two categories -NCU users and non-users (those using Normal Urea) - mainly to examine the impact of NCU, as compared to NU. Further, an adequate care was taken to ensure that the selected crops were grown under chosen irrigated/ un-irrigated conditions in the state. Thus, a total of 200 (NCU/ Normal Urea) farmers for each crop were interviewed using a pretested structured questionnaire. An adequate care was taken with respect to the selection of a representative sample based on the operational land holding size. The information gathered from both primary and secondary sources were analysed, using a tabular format. The details of sample selection are presented in Table 1.
RESULTS AND DISCUSSION
Input costs incurred by NCU and NU users of paddy cultivation across the sample states
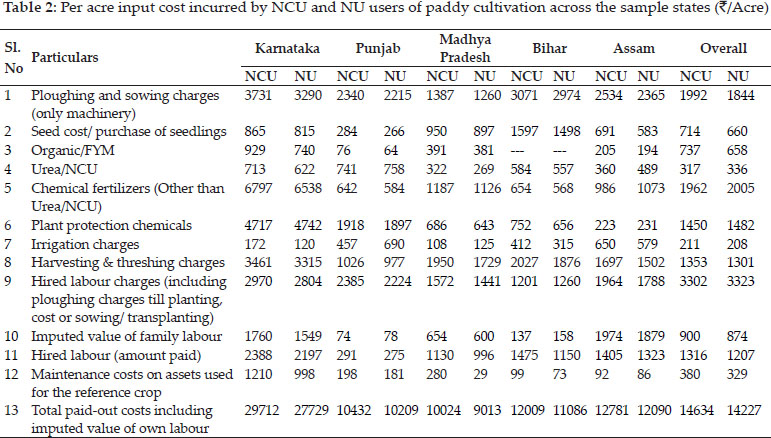
The details of inputs used and costs incurred on each input by NCU and NU users of paddy are presented in Table 2. A perusal of the table reveals a slight increase in the paid-out-costs (₹ 14,634 per acre)in respect of NCU as compared to NU (₹ 14,227 per acre)use at the overall level. This increase in the cost (₹ 407/- per acre) is distributed across different input costs incurred in the production process of paddy. Although, the prices of NCU are found to be slightly higher than NU, the total cost incurred shows a drastic reduction in respect of NCU. Similar is the case with the cost incurred on other fertilizers. Looking at the sample sates, the paid-out costs illustrate an increase for almost all the paddy farmers. From the sample states, the highest paid-out costs incurred are found in the case of Karnataka (₹ 29,712/- per acre for NCU in place of NU (₹ 27,729/- per acre), followed by Assam (₹ 12,781/- per acre for NCU over NU (₹ 12,090/- per acre), Bihar (₹ 12,009/- per acre for NCU against ₹ 11,086/- per acre in respect of NU), Punjab (₹ 10,432/- per acre for NCU in contrast to ₹ 10,209/- for NU), while the least paid-out costs have been noticed in the case of Madhya Pradesh (₹ 10,024/- per acre among NCU users, as compared to ₹ 9,013/- per acre towards NU). Interestingly, the cost of NCU shows a slight reduction for Punjab and Assam in respect of NCU in contrast to NU. In addition, the cost incurred on other fertilizers and PPCs also shows a slight reduction for Assam. While the cost on other chemical fertilizers is found to have increased, the cost on PPCs has declined with respect to Karnataka farmers.
A comparative economics of NCU and NU users of paddy cultivation across the sample states
In the Indian context, a steadily declining farmers' income is a common concern due to an increase in the input prices in comparison to after-harvest prices of agricultural commodities. An attempt has been made in this section to examine the profitability of paddy production with the use of NCU and/or NU. Profit measures namely, main product yield, by-product yield, gross income, net income, and benefit-cost ratio (BCR) on total paid-out costs have been worked out as part of a comparison. The average yield of main product and by-product, market price, marketing costs and net returns are worked out and presented in Table 3. It is worth to note that the application of neem coated urea has increased the paddy yield (main product) to an extent of 26 quintals per acre in respect of NCU, as compared to 23 quintals per acre in respect of NU users at the aggregate. Similarly, paddy by-product has increased to an extent of 41 quintals per acre in the case of NCU in relation to NU users (38 quintals per acre). Across states, the highest main product yield is observed for Karnataka (36 quintals per acre)among NCU users in contrast to 28 quintals per acre in respect of NU users, followed by Punjab (29 quintal per acre for NCU in comparison to 28 quintals per acre inthe case of NU), Bihar (29 quintals per acre for NCU in contrast to NU (27 quintals per acre)), Madhya Pradesh (19 quintals per acre and 15 quintals per acre in respect of NCU and NU, respectively), and the least level of main product yield is observed for Assam state (16 quintals per acre for NCU as compared to NU (14 quintals per acre)). Similar results are observed for paddy by-product across the states,expecting Punjab and Bihar. From among the states, Karnataka accounts for the highest paddy by-product (67 quintals per acre for NCU in comparison to 62 quintals per acre for NU) while the least by-product yield is accounted by Assam (32 quintal per acre for NCU, as against 28 quintals per acre among NU users).
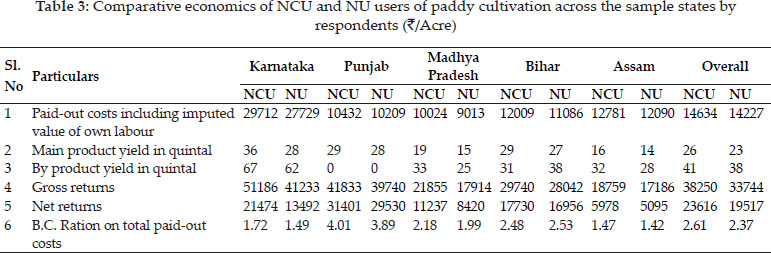
In terms of gross returns, NCU farmers have realized highest gross return to the tune of ₹ 38,250/- per acre as compared to ₹ 33,744/- per acre in respect of NU farmers. From among the states, the highest gross returns are noticed for Karnataka state to the tune of ₹ 51,186/- per acre among NCU farmers as compared to ₹ 41,233/- per acre in respect of NU users, followed by Punjab (₹ 41,833/- per acre for NCU as compared to NU farmers (₹ 39,740/- per acre), Bihar (₹ 29,740/- per acre for NCU farmers, as opposed to ₹ 28,042/- per acre for NU users), Madhya Pradesh (₹ 21,855/- per acre for NCU in comparison to ₹ 17,914/- per acre for NU users), and Assam (₹ 18,759/- per acre for NCU in contrast to ₹ 17,186/- per acre among NU users). Interestingly, the average net returns of NCU users amount to ₹ 23,616/- per acre for NCU as compared to ₹ 19,517/- per acre for NU farmers, the highest among other states. Further, it is worth mentioning that the main product has increased for almost all the paddy sample states in the country. However,excepting Bihar and Punjab, the by-product turnover also shows an increase for all other States. Accordingly, the net returns have also increased forthe entire paddy sample States.
As regards net returns, the highest net return is noticed in respect of Punjab (₹ 31, 401/-per acre for NCU users as against ₹ 29,530/- per acre for NU users), followed by Karnataka (₹ 21,474/- per acre for NCU in contrast to ₹ 13,492/-per acre for NU users), Bihar (₹ 17,730/-per acre for NCU, as against NU users (₹ 16,956/-per acre)), Madhya Pradesh (₹ 11,237/-per acre for NCU in comparison to NU users (₹ 8,420/-per acre), and the least net return from paddy production is found realized by Assam farmers (₹ 5,978/-per acre for NCU users,as compared to NU users (₹ 5095/-per acre), respectively. The highest net return realized by Punjab paddy farmers could be attributed to the application of NCU and the adoption of advanced agricultural technologies in paddy production in relation to other states. The BCR is also highest to the extent of 2.61 in respect of NCU farmers as compared NU users (2.37). These findings are in conformity with the results of the study conducted by Suresh (2001), Jadhav et al. (2006), Naik (2010) and Inder Pal Singh and Grover (2011). Across the states, the BCR is observed highest in the case of Punjab among NCU (4.01) farmers, as against 3.89 in respect of NU, followed by Bihar (2.48 for NCU, as compared to 2.53 in respect of NU farmers), Madhya Pradesh (2.18 for NCU as compared to 1.99 for NU farmers), Karnataka (1.72 for NCU and 1.49 for NU), and the lowest is observed in the case of Assam (1.47 for NCU,as against 1.42 in respect of NU farmers), implying that application of NCU is a profitable intervention.
Input costs incurred by NCU and NU users for tur cultivation across the sample states
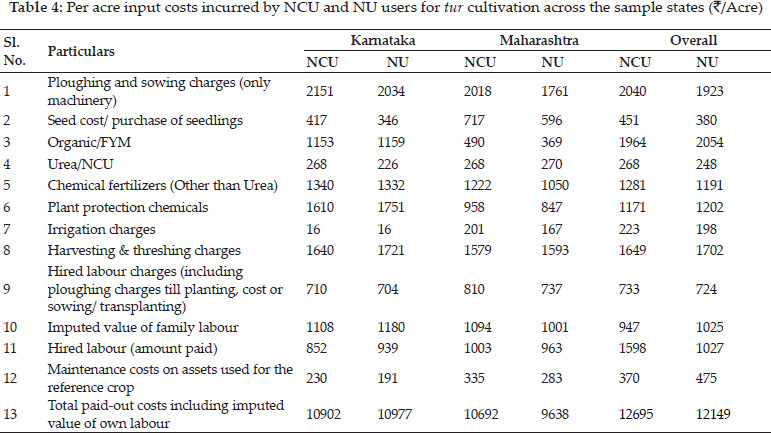
The major inputs and costs incurred by farmers in the cultivation of tur include ploughing and sowing charges, seed cost/purchase of seedlings, organic/ FYM, normal urea/neem coated urea, chemical fertilizers, plant protection chemicals, irrigation charges, harvesting & threshing charges, hired labour charges (including ploughing charges till planting, cost or sowing/ transplanting), imputed value of family labour, hired labour (amount paid) and maintenance costs on assets. Table 4 illustrates the details of per acre inputs used by tur-farmers in Karnataka and Maharashtra states. The results reveal that, on an average, the total paid-out costs incurred by tur-farmers works out to ₹ 12,695/- per acre for NCU, as against ₹ 12,149/- per acre for NU. The incremental costs in the paid-out costs are distributed across variables used in the production of tur, excepting organic fertilizers/ FYM, harvesting and threshing charges, and imputed value of family labour. Across states, the paid-out costs of tur are found relatively the same in respect of Karnataka, whereas in the case of Maharashtra, the paid-out costs are found to have increased from ₹ 9,638/- per acre to ₹ 10,692/- in the case of NCU. The marginally increased costs observed in respect of NCU are mainly due to an increase in ploughing and sowing charges and costs incurred on chemical fertilizers (other than urea), whereas, in other cases, the costs are found to be almost the same for NCU and NU users.
A comparative economics of NCU and NU users for tur cultivation across the sample states
A per acre comparative economics of NCU and NU users for tur cultivation across the sample states is presented in Table 5. A remarkable decrease in tur yield is observed in respect of main product as well as by-products for both the states due to successive drought conditions in the sample study area. A perusal of the table also shows that the total paid-out costs of tur cultivation on NCU are slightly higher (₹ 12,695/- per acre), as compared to NU (₹ 12,149/-per acre) users. Looking at the yield structure, the average main product yield per acre of tur cultivation amounts to 3.60 quintals per acre while that of by-product to 1.90 quintal per acre for NCU users, as compared to NU users (2.65 quintals per acre of main product and 2.30 quintal per acre of by-product) at the aggregate. It also clearly reflects that the application of NCU enhances the yield levels of tur. Accordingly, the average gross return amount to ₹ 18,850/- per acre in respect of NCU in comparison to NU users (₹ 19,065/-per acre). From among the selected states, the highest gross return is accounted for Maharashtra (₹ 37,272/-per acre for NCU in relation to ₹ 23,503/-per acre among NU users), followed by Karnataka (₹ 17,027/-per acre for NCU, as compared to NU users (₹ 19,182/-per acre).
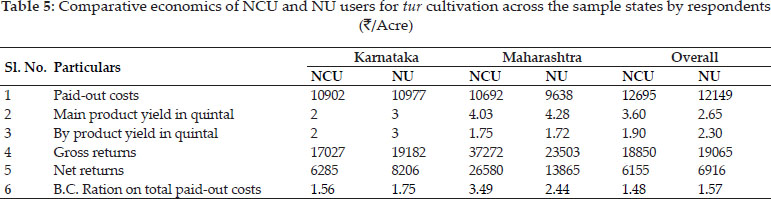
Tur output is found to be better for Maharashtra for both the NCU and NU users, depending upon the severity of drought in these states. Further, a better price is also observed for tur in respect of Maharashtra among NCU users, and accordingly, they have earned better net returns (more than four times) as compared to NU farmers in Karnataka. The Karnataka farmers are found to have incurred a loss of ₹ 1,972/- per acre for NCU, as compared to NU users. Notably, tur production has increased by 0.95 quintal per acre for NCU, as compared to NU users, while by-product per acre has decreased from 2.30 quintals for NU to 1.90 quintals for NCU. On the contrary, the net returns have decreased due to a fall in the prices of Tur. The BCR is also higher for Maharashtra for NCU (3.49), as compared to 2.44 in the case of NU users, followed by Karnataka (1.56 for NCU, as compared to 1.75 for NU) and lowest BCRis noticed in the case of overall farmers.
Input costs incurred by NCU and NU users for sugarcane, maize, soybean and jute
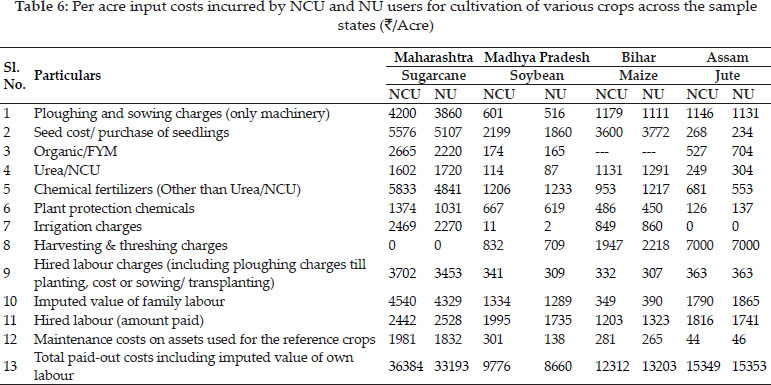
The details of input costs incurred per acre of sugarcane, maize, soybean and jute crops are presented in Table 6. It is clearly revealed from the table that the total paid-out costs incurred on sugarcane crop in the case of Maharashtra is highest (₹ 36,384/- per acre) for NCU farmers, as against ₹ 33,193/- in respect of NU users, and the increase in costs is distributed across all inputs used in the production process. Interestingly, there is a slight reduction noticed in the cost of NCU, as compared to NU. Similarly, in the case of Madhya Pradesh, the paid-out costs incurred on soybean crop are highest (₹ 9,776/-) for NCU in contrast to ₹ 8,660/- for NU users. There is a meager increase in the cost of NCU, as compared to NU users, while a slight decrease is observed in the costs of other chemical fertilizers during post adoption of NCU. However, the increased costs are distributed across different inputs used by NCU farmers. As regards maize crop in respect of Bihar, the paid-out costs have shown an increasing trend in the case of NCU users in relation to NU users, while the increased costs (though not substantial) (₹ 891/- per acre) are found distributed across different inputs. Regarding jute in the case of Assam, the paid-out costs, along with other inputs, are found relatively the same for NCU (₹ 15,349/- per acre) and NU users (₹ 15,353/-per acre).
Comparative economics of NCU and NU users for sugarcane, maize, soybean and jute
A comparative economics of NCU and NU users for sugarcane, maize, soybean and jute are presented in Table 7. Although the additional costs have increased due to the application of NCU, the output has shown an increase both in terms of main product (about 53 quintals/per acre) and by-product (8.30 quintals/ per acre), as compared to NU users (49.30 quintals of main product per acre and 4.70 quintals per acre of by-product). Accordingly, the increase in gross returns and net returns works out to ₹ 1,17,506 and ₹ 81,122/- per acre for NCU, as against ₹ 1,02,337 and ₹ 69,144/- per acre for NU users. Consequently, the production of both the main output and by-products have found increased in the case of NCU farmers. The increase in output and by-products may not be directly attributed to the application of NCU alone. The BCRs are also found higher (3.23) for NCU in comparison to NU (3.08). The per acre total paid out costs for soybean production in respect of Madhya Pradesh amounts to ₹ 9,776/- per acre for NCU users in contrast to NU users (₹ 8,660/- per acre). Accordingly, the average main product yield works out to 10.16 quintals per acre and by-product yield to 14.33 quintals per acre for NCU farmers,as compared to 8.98 quintals and 10.20 quintals per acre respectively, for NU farmers, which is relatively lower than that of NCU farmers. The return structure for soybean clearly reflects that the gross returns per acre are highest at ₹ 17,788 for NCU users, as compared to that of NU users (₹ 15,271/-per acre) (Table 7), thereby depicting positive net returns for both the users. The net returns on NCU amount to ₹ 8,012/ - per acre and that of NU to ₹ 6,611/-per acre. The BCR is also higher in the case of NCU users (1.82) as against NU users(1.76). The higher BCR could be attributed to higher levels of yield, lower paid-out costs, and maximum price received for the quality product. Similar results have been observed by Jitendra Singh et al. (2006), Sujata et al. (2006), Waykar et al. (2006).
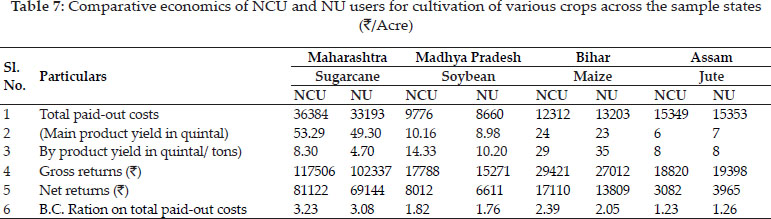
The per acre paid-out costs incurred on NCU and NU for maize production in respect of Bihar are presented in Table 7. A perusal of the table reveals that the total paid out costs of maize production with NCU use amount to less than that of NU users. The total paid-out costs for NCU works out to ₹ 12,312/- per acre, as against ₹ 13,203/-per acre for NU users, an indication that the NCU application not only enhances yield levels but also reduces the total paid-out costs. Looking at the yield levels, it is observed that per acre average yield with NCU works out to 24 quintals per acre for main product and that of by-product to29 quintals per acre, as against 23 quintals per acre for main product and that of by-product to 35 quintals per acre with NU use. The gross returns and net returns structure on maize production for Madhya Pradesh clearly reveals that per acre gross and net returns higher at ₹ 29,421, and ₹ 17,110 for NCU farmers as compared to NU farmers (₹ 27,012 and ₹ 13,809/- per acre), respectively. The BCRs are found positive at 2.39 and 2.05, respectively. It is worth to note that the incremental benefit on net return is mainly due to the application of NCU (₹ 3301/- per acre). There is an increase of one quintal in the case of main product yield and a decrease of six quintals in the case of by-product yield, post the adoption of NCU, as compared to NU.
The per acre paid-out costs for jute production in respect of Assam amounts to ₹ 15,349 for NCU farmers,as compared to NU (₹ 15,353/- per acre) users. Accordingly, the average yield of main product works out to six quintals and that of byproduct to eight quintals per acre, respectively for NCU users in comparison to NU users (7 quintals of main product and 8 quintals of by-product). Looking at the structure of gross and net returns, the average gross returns and net returns amount to ₹ 18,820/-per acre and ₹ 3,082/- per acre in the case of NCU users, as against ₹ 19,398/-per acre and ₹ 3,965/-per acre in respect of NU users. Similarly, the BCR works out to 1.23 for NCU users, as against 1.26 in the case of NU users.
In fact, there is a decrease observed in the main product to the extent of one quintal per acre for NCU users, as compared to NU users. However, the quantity of by-product has remained the same for both the users. As a result, there is a decrease in the net returns to the extent of ₹ 883/- per acre for NCU users, as against NU users.
Diversion of NU and NCU towards others, other than crop purposes
All the sample farmers from the study were asked about the usage of NCU for other than crop production purposes. It has been found during the survey that a very few farmers have used NU in cattle and fishery feed preparation, mixing with milk to enhance the fat content etc., with a very minute quantity (0.1gm/ kg). However, post introduction of NCU, none of the sample farmers has used has NCU for any purpose other than crop production.
CONCLUSION
After observing the benefits of NCU over NU, the Government of India has made mandatory the production (100%) and distribution of NCU throughout the country from June 2015. Farmers have applied higher quantities of NCU in place of NU due to their ignorance about the slow releasing property of NCU and its benefits. Since both NCU and NU were available in the market before Kharif 2015, a few farmers across the country were using NCU, however, its usage has increased only after Kharif 2015. Therefore, the usage of total fertilizers and NU/NCU fertilizers was more or less the same during the study period. Contradictorily, the incidence of pest and disease attacks was on the decline. Overall, the total paid-out costs have slightly increased post NCU use as compared to NU, however, the increased costs were spread across different inputs used in the production process of these reference crops. Although the prices of NCU are slightly higher than NU, the total costs for NCU users show a drastic reduction. Whereas, both the main product and by-products have increased, leading to an increase in the net returns with NCU usage. Considering the benefits of NCU over NU, the decision of the government seems to be right and in the direction of Sustainable Development Goals (SDGs) of the country. More importantly, NCU usage helps the farming community reduce the production costs besides enhancing returns.
REFERENCES
Inder Pal Singh and Grover, D.K. 2011. Economic viability of organic farming: An empirical experience of wheat cultivation in Punjab. Agric. Econ. Res. Rev., 24: 275-281.
Jadhav, M.S., Kamble, B.H. and Yadav, D.B. 2006. Profitability of organic and inorganic farming of suru sugarcane in Maharashtra. Agric. Econ. Res. Rev., 19(2): 234.
Jitendra Singh., Singh, G.P. and Rajkishor. 2006. Present status and economics of organic farming in the district of Udham Singh Nagar in Uttaranchal. Agric. Econ. Res. Rev., 19(2): 135-144.
Mala, P. 2013. Fertilizer Scenario in India, International Journal of Social Science & Interdisciplinary Research, 2(1): 62-72.
Malik, R.P.S. and Sekhar, C.S.C. 2007. Factors Affecting Fertilizer Consumption in Haryana, Research Study No. 2007/4, (2007), Agricultural Economics Research Centre, University of Delhi, Delhi.
Naik, V.R., Kunnal, L.B. and Nethrayini, K.R. 2010. Decomposition analysis of income difference between organic and inorganic chilli cultivation. Green Fmg., 2(2): 145-148.
Parama, V.R. and Munawery, A. 2012. Sustainable Soil Nutrient Management. Journal of the Indian Institute of Science, 92(1): 1-16.
Sujatha, R.V., Eswara Prasad, Y. and Suhasini, K. 2006. Comparative analysis of efficiency of organic farming Vs inorganic farming- A case study in Karimnagar district of Andhra Pradesh. Agric. Econ. Res. Rev., 19(2): 232.
Venugopal, Pingali, Input Management, Vol. 8, State of the Indian Farmer: A Millennium Study, Academic Foundation, New Delhi, (2004).
Waykar, K.R., Yadav, D.B., Shendage, P.N. and Sale, Y.C. 2006. Economics of grape production under organic and inorganic farming in the Nasik district of Maharastra state. Agric. Econ. Res. Rev., 19(2): 240.