Economic Affairs, Vol. 65, No. 3, pp. 401-408, September 2020
DOI: 10.46852/0424-2513.3.2020.12
![]()
Integration of Domestic and International Markets of Indian Coffee
ABSTRACT
Coffee is an important commercial crop of the tropics and it is the largest and widely traded tropical agricultural commodity. The present study was conducted to examine integration of domestic and international markets of Indian coffee prices during 2005–06 to 2016–17. The domestic markets selected for coffee prices were Bangalore, Chennai and Hyderabad markets. Similarly, international markets were International coffee organization (ICO), New York and London. The results revealed that, Johansen’s Co-integration of Arabica and Robusta group prices had long run equilibrium and also implied strength and stability of price linkages between selected markets. Granger causality test showed that ICO and New York markets uni-directionally influenced the price of Bangalore, Chennai and Hyderabad markets, respectively but there was bi-directional causality among the selected domestic wholesale Robusta group markets. Bangalore and Chennai markets are considered to be dependent on the other markets, the speed of adjustment in Robusta group coffee was registered 54 per cent and 33 per cent, respectively. There is need to spend much more money on demand creation, like cafe coffee day, which help to promote coffee consumption within the country. So our producers fetch the better prices for their produce.
Highlights
 This study determines the spatial efficiency of domestic and international markets of Indian coffee and suggested that demand creation helps to increase the profitability of the producer.
Keywords: Integration, Causality, Markets, Prices and Coffee
Coffee is the world’s most favourite beverage which prepared from roasted seeds, usually called coffee beans by coffee consumers. The consumption of coffee had started initially in the 9th century, coffee was introduced into India during 1600 A.D. but commercial cultivation started by Britishers in the 1820's. Coffee is an important commercial crop of the tropics and it is the largest and widely traded tropical agricultural commodity with exports valued at US$ 31.6 billion in 2016. The importance of coffee as an export commodity relies on the fact that out of the total coffee produced in India, 30 per cent is consumed domestically and 70 per cent is exported. India occupies the sixth place in terms of production and holds world’s global share of 3.85 per cent. In addition to this, India ranks 7th in area, 6th in production and 3rd in productivity of coffee in the world. The major coffee producing states of India, which covers the traditional coffee growing regions like Karnataka, Kerala and Tamil Nadu, which accounts for 97 per cent of Indian coffee production. However, coffee is grown to a lesser extent in Andhra Pradesh, Odisha and northeastern states. Coffee was introduced in Kerala in 1826, Karnataka in 17th century and the first coffee plantation in Tamil Nadu was set up in 1840.
International price in New York and ICO markets in Arabica coffee price and international prices in London and ICO markets in Robusta coffee prices became the benchmark at which all sales transactions were finalized. This is possible only by the complete participation of the growers. For the many years, coffee exports have been a substantial source of foreign exchange earnings to India’s exchequer. However, the domestic coffee marketing system in the country has long been neglected due to various reasons. It deserves its due share primarily because more than 65 per cent of the total coffee production is being exported. It is therefore, important to develop a strong network of efficient marketing system with international markets so that a substantial chunk of country’s coffee production is efficiently managed and exported to destination countries. This study was highlights the trend and relationship of domestic and international prices of Indian coffee.
How to cite this article: Ahmadzai, A.B., Sidana, B.K. and Guleria, A. (2020). Integration of Domestic and International Markets of Indian Coffee. Economic Affairs, 65(3): 401–408.
Source of Support: None; Conflict of Interest: None ![]()
METHODOLOGY
The time series data of domestic and international prices of Arabica and Robusta group coffee from 2005–06 to 2016–17 were collected from Coffee Board of India. Monthly price data for these 13 years were considered for analysis. This was done to analyze the trend and examine the market integration in different markets. Data regarding domestic and international prices of coffee, and the exchange rates between Indian rupee and US dollar for the present study period were collected and compiled from various secondary sources such as Coffee Board of India, comtrade.un.org and faostat.com.
Linear trend analysis
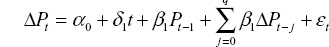
For finding the long-run trend in domestic wholesale prices and international prices of different markets, the OLS method (Ordinary Least Squares) was used to find estimates. By this method, one can easily estimate the intercept coefficient and slope of the linear functional form. The following equation is used as for this purpose.

Where,
Yt = Domestic/ international price of Arabica or Robusta at time t; α = intercept; β = slope; e = error
The trend in selected markets prices were analysed and used for further comparison. The coefficient of determination (r2) was computed in order to test the goodness of fit of trend line to the data.
Test for Stationarity
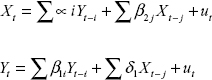
The first step in the time series analysis, before testing for co-integration and Granger causality, is to examine the stationarity of each individual time series selected for the analysis. This involved testing for stationarity of the variables using Augmented Dickey-Fuller (ADF) unit root test. The test was applied to check the order of integration by using the model:
When,
P = the price in each market,
Δ = difference parameter (i.e.,

α0 = constant or drift
t = time trend variable
q = number of lag length and
εt = pure white error term
The null hypothesis is that β1 (the coefficient of Pt-1) is zero. The alternative hypothesis is: β1 <0. A non-rejection of the null hypothesis suggests that the time series under consideration is non-stationary.
Johansen’s Co-integration method
Co-integration explains the extent of deviation from the long run equilibrium relationship by the non-stationary series. Once it was confirmed that all of the price-series were stationary at the level or at same order of differences, the maximum likelihood (ML) method of co-integration was applied to check long run wholesale price relation between the selected markets. Maximum likelihood ratio test statistic is proposed to test number of co-integrating vectors. The null hypothesis of atmost Y co-integrating vectors against a general alternative hypothesis of more than Y co-integrating vectors is tested by trace statistics. The number of co-integrating vectors indicated by the tests is an important indicator of the extent of co-movement of prices. An increase in the number of co-integrating vectors implies an increase in the strength and stability of price linkages.
Granger causality test
The Granger causality test was used to test the existence and the direction of long run causal price relationship between the markets. The test was used to check the significance of changes in price series which affect the other price series,
Where,
t = the time series
ut = the error time and
X and Y are the price series of different markets.
Vector Error Correction Model (VECM)
The co-integration analysis reflects the long-run movement of two or more series, although in the short-run they may drift apart. Once the series are found to be co-integrated, then the next step is to find out the short run relationship along with the speed of adjustment towards equilibrium using error correction model, represented by equations:
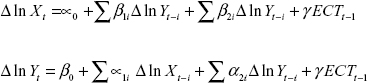
where, ECTt-1 is the lagged error correction term; Xt and Yt are the variables under consideration transformed through natural logarithm; and X and Y- i are the lagged values of variables X and Y. The parameter y is the error correction coefficient that measures the response of the regressor in each period to departures from equilibrium. The negative and statistically significant values of y depict the speed of adjustment in restoring equilibrium after disequilibria and if it is positive or zero, the series diverges from equilibrium.
RESULTS AND DISCUSSION
Trend in coffee prices of Arabica and Robusta group
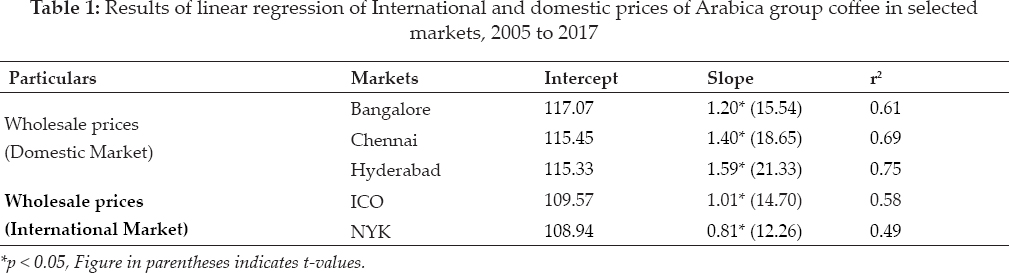
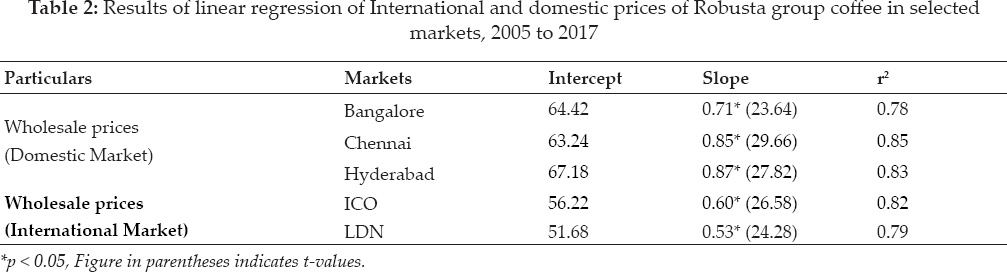
In order to ascertain the long run movements of coffee prices in different markets, linear trend analysis was performed with price as dependent variable and time as independent variable. The important wholesale domestic markets for coffee in India are Bangalore, Chennai and Hyderabad. The data relating to prices of Arabica group coffee were subjected to linear trend analysis during the period 2005–2017. During the study period wholesale prices of Arabica group coffee prices increased at 1.59, 1.40 and 1.20 rupees per kg per month with coefficient of determination (r2) having value of 75, 69 and 61 per cent, respectively in Hyderabad, Chennai and Bangalore markets (Table 1). The monthly increase in coffee prices at international market of Arabica group was found to be maximum in ICO (1.01 rupees per kg per month) followed by New York (0.81rupees per kg per month). Similarly, the corresponding coefficients of determination were 58 per cent and 49 per cent for the respective markets. Robusta coffee is another major cultivar of coffee in the region. It is observed from the Table 2 that, there is an increasing trend in prices of Robusta group coffee for all domestic and international markets. The analysis revealed that the price increased at the rate of 0.87 rupees per kg every month in Hyderabad, 0.85 rupees per kg per month in Chennai and 0.71 rupees per kg every month in Bangalore market. However, time variable affected these price series to the tune of 83, 85 and 78 per cent respectively. In case of international market, the increase in coffee price varied from one market to another i.e., monthly price increase observed to the tune of 0.60 and 0.53 for Robusta group in ICO and London markets respectively, and the corresponding coefficients of determination values were 82 and 79 per cents for ICO and London markets respectively signifying the significant contribution of time factor on variation in the prices. Since, there was increase in price of coffee in selected markets, the alternate-hypothesis that “significance increase in coffee prices over the years” is accepted.
Relationship in coffee prices in domestic and international markets
Augmented Dickey-Fuller test (ADF) for Arabica group: 2005 to 2017
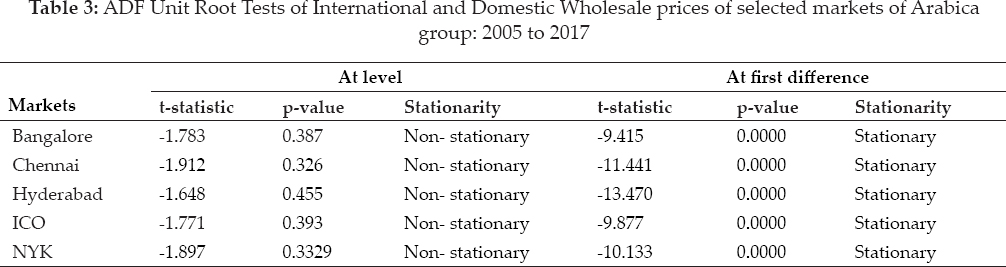
The ADF based unit root test procedure was applied to check whether the price series is stationary or not at their level, followed by their differences. The ADF test conducted for the period from Jan 2005 to Dec 2017 and it was presented in table 3. The table indicated that all the price series appeared non- stationary at the level, which were changed to stationary after taking first difference. The t-statistic value for all the markets were significant implying that these series were stationary and free from consequences of unit root, therefore we can proceed with co-integration test.
Results of Johansen Co-Integration test for Arabica group: 2005 to 2017
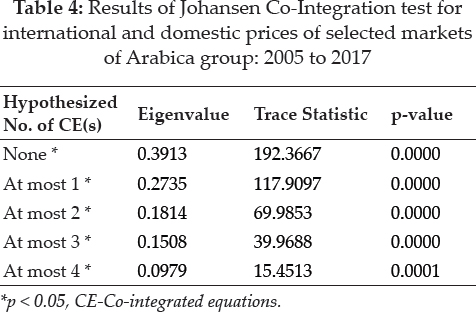
Johansen’s Multiple Co-integration test was employed to determine the long run relationship between the price series of selected markets. The test shows that the selected Arabica group of coffee markets are integrated or not. The results revealed that unrestricted co-integration rank test (Eigen value and trace statistic) were estimated the presence of at most four co-integrating equations at 5 per cent level of significance, which indicate that Arabica group prices in the selected market were having long run equilibrium and also implies strength and stability of price linkages between selected markets.
Granger Causality test for Arabica group: 2005 to 2017
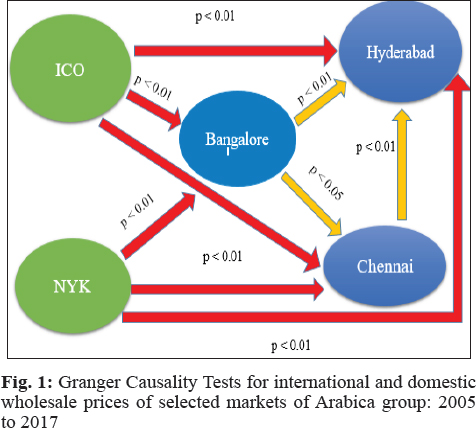
After performing market integration test, it is necessary to know the causal relationship existing between the markets. Here causality implies Granger causality which ascertains the lead market between the market pairs. The result of casual relationship between the prices series of selected markets approached through Granger Causality technique is presented in Fig. 1. It was identified that there is unidirectional causality among the selected Arabica group markets. Both international markets viz. ICO market and New York market uni-directionally influenced the price of Bangalore, Chennai and Hyderabad markets. Bangalore market itself influenced the prices of Hyderabad at 1 per cent level and Chennai markets at 5 per cent level of significance, while Chennai market influenced the price of Hyderabad market. However, prices of Hyderabad market did not influence any other markets.
Vector Error Correction Model (VECM) of Arabica group: 2005 to 2017
Since the selected Arabica group markets are integrated in the long run, it is important to study the short run and long run equilibrium among the markets. Vector Error Correction Model (VECM) was employed to know the speed of adjustments among the markets for long run equilibrium among the selected markets. The number of lags in the VECM was taken to be two as the Akaike Information Criterion (AIC) was lowest at this order (2) in the system for all the selected markets i.e., Bangalore, Chennai, Hyderabad, ICO and New York.
The error correction term indicates the speed of adjustment among the variable before converging to equilibrium in the dynamic model. The results of error correction terms were interpreted in order to study the nature of market (stable/unstable/ random), endogeneity and the movement towards the long run equilibrium, i.e., efficiency of the market. Thereafter, the short-term causality in the prices of selected markets included in the system, i.e., which market impacts the price of other market was also explained.
ΔIn Bangaloret = -0.0003 ECTt-1 - 0.743 ΔIn Bangaloret-1 - 0.328 Δln Bangaloret-2
Δln Chennait = -0.595 ECTt-1 - 0.657 Δln Hyderabadt-1 - 0.402 Δln Hyderabadt-2
Δln Hyderabadt = -1.074 ECTt-1 - 0.572 Δln Chennait-1 - 0.359 Δln Chennait-2
Δln ICOt = -0.0002 ECTt-1 - 0.161 Δ Hyderabad -0.112 Δln Hyderabadt-2
Δln NYKt = -0.0003 ECTt-1 - 0.957 Δln NYKt-1 - 2.82 Δln Chennai t-2
The (VECM) was performed for the international and domestic wholesale price series of the selected markets. The coefficient is the speed adjustment as it gauges the speed at which the deviation in prices return to equilibrium over time. Further, if the coefficient is negative or less than zero, it implies that the international and domestic wholesale price converges to long run equilibrium. However, the error correction coefficient is positive and zero, it implies that the international and domestic wholesale price series are not converging but diverge from the long run equilibrium.
It has been observed that the speed of adjustment is very low in Bangalore, ICO and New York i.e. 0.03 per cent, 0.02 per cent and 0.03 respectively. This is probably due to the reason that only one-way transaction exists between the markets. However, the speed of adjustment is found to be higher in the Chennai and Hyderabad market, i.e. 59 and 107 per cent respectively. The result indicated that Arabica group prices in Bangalore market were affected by the prices of itself and Hyderabad market effect the price of Chennai with lag one and two. Hyderabad market was effected by the prices of Chennai market at lag one and two. However, prices of ICO market were only effected by the Hyderabad prices with one and two lags. New York market were also affected by prices of itself at lag one and Chennai market at lag two.
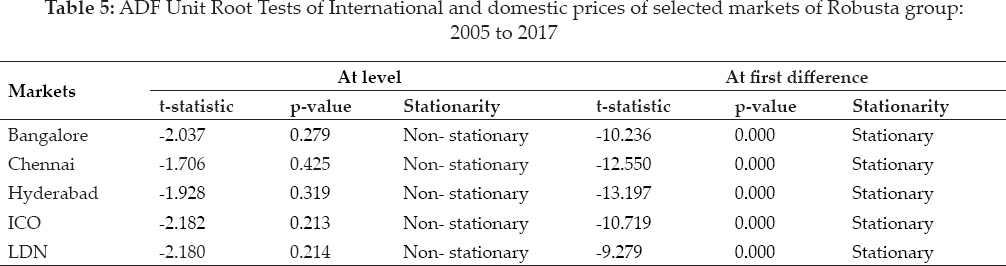
Augmented Dickey-Fuller test (ADF) for Robusta group: 2005 to 2017
The results revealed that all the price series appeared non stationary at level, but all the series were stationary after taking first differences and the t-statistic value for all the markets are significant implying that these series were stationary. Therefore, we can proceed with co-integration test.
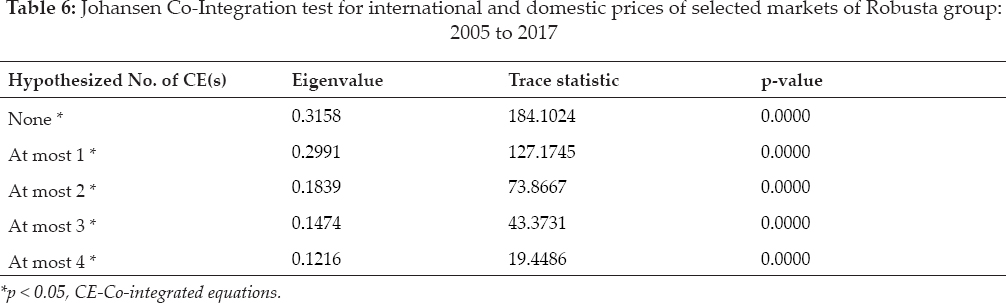
Results of Johansen Co-Integration test for Robusta group: 2005 to 2017
Johansen Co-integration test indicated the long run equilibrium due to presence of at most four co-integration equations at 5 per cent level of significance.
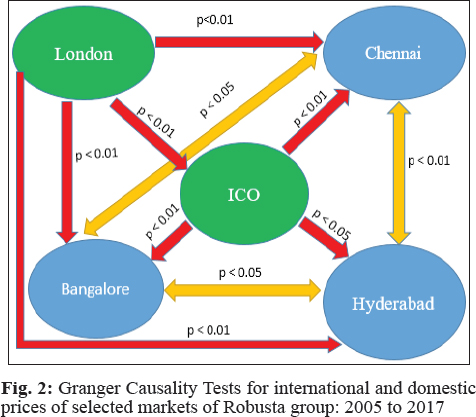
Granger Causality test for Robusta group: 2005 to 2017
The result of casual relationship between the prices series of selected of Robusta group markets approached through Granger Causality technique is presented in Fig. 2. It was identified that there was bidirectional causality among the selected domestic wholesale Robusta group markets, Bangalore market caused bidirectional price transmission with Chennai and Hyderabad markets. Chennai market have bidirectional causality of price transmutation with Hyderabad. However, Robusta group coffee prices in London market caused uni-directional price transmission with ICO, Bangalore, and Chennai. ICO market have uni-directional causality of price transmission with three domestic markets i.e. Bangalore, Hyderabad and Chennai at 5 per cent level of significance.
Vector Error Correction Model for Robusta group: 2005 to 2017
The results revealed that the Bangalore and Chennai markets were dependent on the other markets, the speed of adjustment registered as 54 per cent and 33 per cent respectively. This was probably due to the reason that only one-way transaction exists between the markets and said to be producing markets which supplies the produce to the other markets. However, in the Hyderabad market, the speed of adjustment was found to be lowest in general i.e. 0.06 per cent. However, in the ICO and London markets, the speed of adjustment is found to be higher i.e. 195 per cent and 48 per cent, respectively.
The result had found out that the Robusta group prices in Bangalore market were affected by the prices of itself and all other markets except Hyderabad market with lag one and two. Chennai market was effected by the prices of Bangalore, Hyderabad and ICO markets at lag one. However, price in Hyderabad market were only effected by itself Hyderabad market prices with one and two lags. ICO market were also affected by the domestic market of Bangalore and Chennai markets at lag one. Similarly, London market was influenced by ICO market at one and two lags of international prices and domestic wholesale prices of Chennai market with lag two.
CONCLUSION
The important wholesale domestic markets for coffee in India are Bangalore, Chennai and Hyderabad.
The trend in wholesale prices of Arabica group coffee was increased at 1.59, 1.40 and 1.20 rupees per kg per month at Hyderabad, Chennai and Bangalore markets respectively, while international markets, ICO showed the highest prices in Arabica group coffee followed by New York. In case of Robusta group coffee, the prices increased at the rate of 0.87, 0.85, 0.71, 0.60 and 0.53 rupees per kg per month in Hyderabad, Chennai, Bangalore, ICO and London respectively.
The ADF based unit root test for Arabica and Robusta group that all the price series appeared non stationary at the level, but all the series were stationary after taking first differences and the t-statistic value for all the markets were significant implying that these series were stationary.Johansen’s Co-integration test revealed that Arabica and Robusta group prices in the selected market were having long run equilibrium and also implies strength and stability of price linkages between selected markets.
Granger causality test showed that ICO and New York markets uni-directionally influenced the price of Bangalore, Chennai and Hyderabad markets, there was bi-directional causality among the selected domestic wholesale Robusta group markets. London and ICO markets - influenced the price of all the domestic markets. Bangalore and Chennai markets are considered to be dependent on the other markets, the speed of adjustment in Robusta group coffee was registered 54 per cent and 33 per cent, respectively. Important domestic markets for coffee in India are Bangalore, Hyderabad and Chennai, while ICO, New York and London were the important international markets. There is need to spend much more money on demand creation, like cafe’ coffee day did, which help to promote coffee consumption within the country. So our producers fetch the better prices for their produce.
ACKNOWLEDGEMENTS
Authors are thankful to the Director General (EQR), ICAR, India-Afghanistan fellowship programme for extending support during studies
REFERENCES
Ashoka, N., Naik, B.K. and Anupama, G. 2016. Econometric analysis of wholesale coffee prices and exports from India.
Ashoka, N., Naik, B.K. and Kulkarni, V.S. 2013. Analysis of trends and instability in area, production and productivity of Indian coffee.
Ashoka, N., Naik, B.K. and Kulkarni, V.S. 2014. Behavior of Arabica coffee prices in international and Indian markets.
Balakrishnan, M. and Chandran. K. 2018. An integration of major coffee consuming centers in India - An economic analysis.
Coffee Board of India. 2017. Annual area, production and productivity statistics. Ministry of Commerce and Industry, Govt of India.
Chengappa, P.G., Pradeepa Babu, B.N. and Devika, C.M. 2016. Structural transformation in the Indian coffee sector: Need for coping with global market trends.
Dicky, D.A. and Fuller, W.A. 1979. Distribution of estimators for autoregressive time series with unit root.
Fatima, A., Abid, S. and Naheed, S. 2015. Trend in wholesale prices of onion and potato in major markets of Pakistan: A time series analysis.
Gairhe, S. and Reddy, S.V. 2012. Scenario of coffee in India-An overview.
Granger, C.W.J. 1969. Investigating causal relations by econometric models and cross- spectral methods.
Gujarati, D. 2010. Econometrics by Example. Macmillan Publishers, London.
Johansen, S. 1988. Statistical Analysis of Co-Integration Vectors.
Johansen, S. and Juselius. K. 1990. Maximum likelihood estimation and inference on co-Integration: with applications to the demand for money.
Malladi, P. and Indira, M. 2015. A granger causality analysis on production and export of coffee industry in India.
Naveena, K., Singh, S. and Singh, A. 2015. Co-integration and error correction modelling of Indian coffee price with world market.
Vinod, N.R. and Nethravini, K.R. 2018. Changing direction and magnitude of India’s coffee export in the post-liberalization era.
Vivine, A. 2011. Performance of India’s coffee export trade-An econometric analysis. M.Sc. Thesis, University of Agricultural Sciences Bangalore, India.
Wahlang, L. and Sekhon. M.K. 2019. Price behavior and market integration of chickpea in major producing states of India.