
Economic Affairs, Vol. 65, No. 2, pp. 285-293, June 2020
DOI: 10.46852/0424-2513.2.2020.22
Economics Of Marketing Of Apple Crop And The Problems Faced By Growers In Himachal Pradesh
ABSTRACT
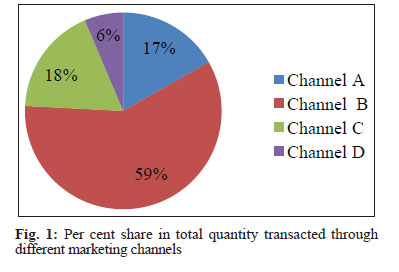
In view of India's potential competitiveness in apple crop in the international market, it is imperative to understand the dynamics of domestic trade in apple. In this study, marketing and price-spread patterns of apple crop in the state of Himachal Pradesh have been examined. A few policy interventions have been suggested for promoting apple crop in the state. The present study has been carried out in the two purposively selected blocks i.e., Banjar and Naggar of Kullu District of Himachal Pradesh by taking representative sample of 70 farmers. The produce has been found to be marketed through four channels and maximum i.e., about 59 percent has been disposed off through channel B (Producer-primary wholesaler-secondary wholesaler-retailer- consumer). Comparison between different channels revealed the highest share in consumer rupee in Channel D (Producer- retailer-consumer) i.e., 73.95 per cent and marketing efficiency has also been found to be highest in channel D i.e. 2.84 which means smaller the channel more profitable it is. Lack of good infrastructure and availability of skilled labour were found to be the major problems faced by the apple growers in the study area.
Highlights
 This study highlights that out of the various channels adopted by the farmers Producer-primary wholesaler-secondary wholesaler-retailer- consumer was the most favored channel, though its marketing efficiency was found to be low. Out of total production of apple a loss of about two per cent was observed due to lack of better cold storage facility.
Keywords: Marketing channels, efficiency, problems, apple
Horticulture sector has emerged as a driving force for agricultural development in India. The sector is the most profitable venture for all farming activities, as it provides ample employment opportunities and scope to raise income of the farming community in the country. Besides, the sector has tremendous potential to push overall agricultural growth above the country's targeted 4 per cent level (Bahadur, 2010). Realizing these potentials, the government of India has started putting greater thrust for the development of horticultural sector after sixties in order to exploit the country's vast potential and to generate the much needed value addition.
Horticulture development in Himachal Pradesh is an economic necessity. The niche advantages for fruits have in the past been exploited by the growers, wherever natural conditions, socio-economic and institutional environments were favorable. The state of Himachal Pradesh being primarily a temperate hilly state is known for the production of commercial temperate fruits crops (Kashirsagar, 2006) that includes apple, peach, plum, apricot, walnut, strawberry and cherry etc. and among these apple is grown at the largest area and most preferred among the fruit growers in the state (Kumar et al. 2007). Horticulture sector covered 25431 thousand hectares of land in 2017-18, accounting for 8.5 percent of the gross cropped area of the country, with production of 311714 thousand metric tonnes (NHB, 2018). In Himachal Pradesh, area under fruit crops crops has been found to be 230.85 thousand hectares with the total production of 565.31 thousand metric tonnes out of which apple crop covers the area of 111.90 thousand hectares with the production of 446.57 thousand metric tonnes (Anonymous, 2018). Apple, the most dominant fruit of Himachal Pradesh, contributes around 57% of the total area under tree crops (Randev 2005) and more than 88 per cent of the total quantum of horticultural production (Kanwar and Nadda, 1984).
How to cite this article: Sharma, I. and Guleria, A. (2020). Economics of marketing of apple crop and the problems faced by growers in Himachal Pradesh. Economic Affairs, 65(2): 285-293.
Source of Support: None; Conflict of Interest: None 
Kullu district of the Himachal Pradesh has become famous for production of apple. Greater emphasis is being laid down on this sector because geographical features and climatic conditions prevailing in the district are ideally suited for fruit farming. Among all the fruits grown in Kullu, apples are most widely grown and represent commercially the most important fruit crop of the district. The area under cultivated apple in Kullu district has increased significantly from 8573 ha during 1975-1976 to 26794 ha in 2017-2018 and apple production has increased from 62931 MT in 1975-1976 to 78948 MT in 20172018 (Anonymous, 2019).
Marketing is basically the process of movement of goods from produces to consumer at the desired time, place and form. The marketing system for apple is therefore, of utmost importance for those growers who specialize in apple production and of great importance to all those people who are concerned with the producer's share in the consumer's price. New market players have to be invited in, resources found for investments, change in policy and support systems from the government and building capacities in individuals and institutions for effective and remunerative participation in the value chain (Naqash, 2018). The extent of profitability of an enterprise also depends upon the efficiency of the marketing system. The expansion in the area and production alone is not an indicator of enhanced income, but its efficient marketing management is equally important to ensure better returns from the produce. The orchardist's are interested in better prices of their produce while consumers expect the availability of produce at reasonable prices. India faces a supply gap in its domestic apple market due to the increasing demand from the growing middle class (Ali, 2018). For achieving the conflicting objectives marketing system has to play a crucial role. It thus, becomes pertinent to review and analyze this farm activity.
Apple is being grown in nine districts of the state and the present study has been undertaken in the Kullu district because of the significant contribution of horticulture sector in improving the livelihood of the people in the district. Quite a few studies have been conducted in the past on the economic aspect of marketing of apples in the state, but apple industry is well established and dynamic in character, hence there has been a need to revalidate the economic indicators from time to time.
Objectives, Data Sources and Methodology
This study has been carried out in order to access the marketing performance of the apple crop with following specific objectives: (i) to estimate the marketed surplus and marketable surplus, (ii) to assess the value of different marketing functions, (iii) to identify the different marketing channels of apple crop and (iv) to estimate the marketing efficiency of identified marketing channels
Purposive sampling was adopted to select the study area i.e. Kullu district of Himachal Pradesh because of its significant contribution with respect to area and production of apple in the state, simultaneously providing fruitful employment to the families involved in apple cultivation. At the first stage 2 blocks namely Banjar and Naggar blocks were selected on the basis of highest area under apple by adopting probability proportion method. At the second stage 5 villages from each block were randomly selected. At the third stage a sample of about 7 apple growers from each selected village were selected by adopting probability proportion method in such a way that the total samples of the respondents were restricted to about 70. For the analysis of data the total respondents were divided into four classes according to the size of their land holdings, viz., marginal (<1 ha), small (1-2 ha), semi medium (2-4 ha) and medium farmers (>4 ha).
MARKET ANALYSIS
Marketing Costs
The total costs, incurred on marketing by the farmers and of the various intermediaries involved have been calculated as follows:

Where, C = Total cost of marketing, CF = Cost paid by the farmers and Cm = Cost incurred by middlemen,
Marketing Margin
Marketing margin of middleman calculated as the difference between the total payments (marketing cost + purchase price) and receipts (sale price) of the middlemen and calculated as follows.

Where, Ami = Absolute margin of middlemen, PRi = Total value of receipts per unit (sale price), Ppi = Purchase value of goods per unit and Cmi = Cost incurred on marketing per unit
Price spread
Generally the economic efficiency of the marketing system is measured in terms of price spread. The smaller the price spread, the greater the efficiency of marketing system. Price spread refer to the difference between the price paid by the consumer and price received by the producer.
Producer's price
The net price received by the orchardist has been calculated by deducting the marketing costs borne by the producers from the original price paid to the producers by the commission agent/ wholesaler and is calculated as given below:

Where, PF = Net price received by the producer, PS = Producer's selling price and PC = Marketing cost incurred by the producers.
Producer's share in consumer's rupee has been worked as under

Where, Ps = Producer's share in consumer's rupee, PF = Price received by farmer per unit and Pr = Retail price per unit/ Consumer's purchase price
Marketing efficiency of the marketing channels In case of marketing channels, the marketing efficiency is concerned with the movement of goods from producer to consumer at the lowest possible cost consistent with the provision of services desired by the consumers. The marketing efficiency of various channels in the study area has been computed by using Acharya's method, as under:
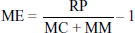
Where, ME = Marketing efficiency, RP = Retailer's price, MC = Total marketing costs and MM = Total marketing margins
RESULTS AND DISCUSSION
Marketable and Marketed Surplus
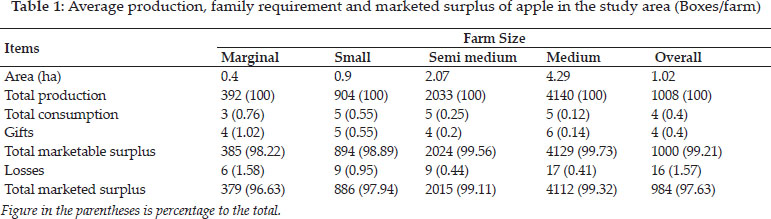
In Kullu district more than 99 per cent of produce of an average farm is meant for the purpose of sale in the market. This amount requires the proper marketing arrangements. The marketed surplus primarily depends upon economic consideration like size of holdings, total production and the other factors like size of family and post harvest losses. For increasing marketed surplus, therefore, total production needs to be enhanced and post harvest losses need to be minimized. Of the total average production, the marketable surplus accounted for 99.21 per cent and on-farm consumption including gifts was found to be 0.8 per cent on overall basis.
The percentage of marketable surplus varied from 98.22 per cent on marginal farms to 99.73 per cent on medium farm. The total marketed surplus varied from 97.94 per cent on small orchards to 99.32 per cent on medium orchards with 97.63 per cent at an overall level. The market losses were estimated to be 1.57 per cent on an average and it varied from 0.95 per cent on small orchards to 1.58 per cent on marginal orchards. The boxes sold had standard weight of 22 kg apples in all farm categories (Table 1).
Marketing functions
Various marketing functions are performed by the apple growers for marketing the produce. The product has to be prepared for the market which involves picking, assembling, grading, packing, transportation, loading/ unloading, storage etc. All these factors have been found to be important determinants of prices which apple fetch in the market, and great care has to be ensured at every step. Any carelessness at any stage in marketing channel may lower the prices and hence affect net returns adversely.
Harvesting
Picking of apples at the correct time is essential to ensure its quality production and maximize storage life. The stage of picking also depends on the time lag between the picking and expected arrival of the fruit in the market. Apples are very susceptible to bruising and other forms of mechanical injuries and therefore should be handled very carefully. Damage from rough handling will accelerate deterioration, thus reducing the value of the produce.
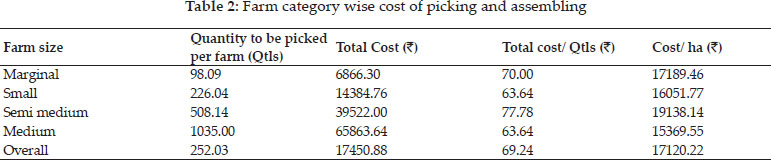
Table 2 shows cost of picking and assembling the apple fruit category-wise on per farm basis and per hectare basis. This table shows that overall cost of picking and assembling per quintal was worked out to be ₹ 69.24, whereas category-wise cost of picking and assembling per quintal was found to be ₹ 70.00, ₹ 63.64, ₹ 77.78, ₹ 63.64 rupees for marginal, small, semi medium and medium farm category respectively.
Grading
After picking the fruit grading is the next important marketing function. Apple is graded according to size and quality of the fruit. Apple is classified into six size grades and three quality grades. The size grades are; super large, extra-large, medium, small, extra-small and pitto. These size grades are further classified into three quality grades. These are; extrafancy (grade-A), fancy (grade-B), standard (grade-C) and culls. Facilities for mechanical grading of fruit also exist in apple growing areas.
Packing
Packaging is very useful function in the marketing. For commodities like apples which are perishable, fragile in nature and transported to distantly located markets all over the country needs a special type of container for packaging which can protect and preserve its quality during transportation and handling. Good quality fruit has been found to be normally packed either in wooden boxes or in the corrugated fibre board carton (cfb cartons) with pulp trays and low grade fruit is packed in gunny bags.
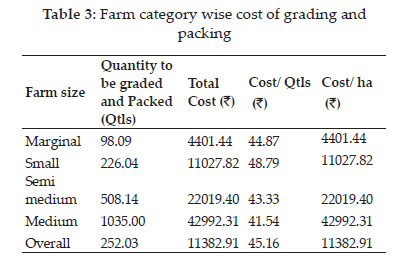
Category wise cost of grading and packing the apple fruit has been given in Table 3 which has shown that overall cost for picking and assembling per quintal of apple was found to be ₹ 45.16, whereas category- wise cost of picking and assembling was found to be ₹ 44.87, ₹ 48.79, ₹ 43.33, ₹ 41.54 rupees per quintal for marginal, small, semi medium and medium farm category respectively.
Transportation
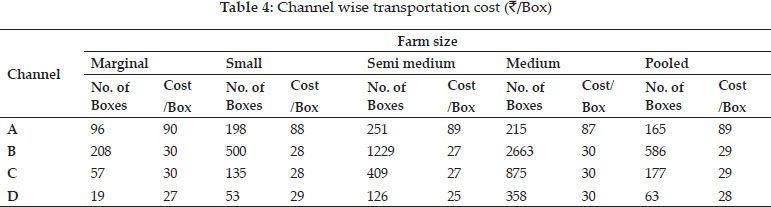
Transportation is another important marketing function which adds place utility to produce. The average transportation cost from orchard to fruit marketing functionary has been worked out as shown in table 4.
The pooled transportation cost per box was worked out to be ₹ 89 for channel A (Producer - wholesaler - retailer - consumer), ₹ 29 for channel B (Producer - primary wholesaler - secondary wholesaler - retailer - consumer), ₹ 29 for channel C (Producer- Pre harvest contractor - Primary wholesalersecondary wholesaler - retailer - consumer) and ₹ 28 for channel D (Producer-retailer-consumer). The table shows that minimum transportation cost was found for channel D as it is the shortest channel i.e. producer to retailer to consumer, while transportation cost was found to be maximum for channel A i.e. producer to wholesaler to retailer to consumer as the produce is transported to distant market on trucks or jeeps.
Marketing Channels
Marketing comprises of movement of apples from producer to ultimate consumer. In this chain various agencies like growers, pre-harvest contractors, wholesalers, retailers, etc, are engaged. This chain of intermediaries/ functionaries is called the marketing channel. The following channels have been identified as important channels in the study area
♦ Channel A : Produce-wholesaler-retailer-consumer
♦ Channel B : Producer-primary wholesaler secondary wholesaler-retailer-consumer
♦ Channel C : Producer -Pre harvest contractorPrimary wholesaler- Secondary Wholesalerretailer- consumer
♦ Channel D : Producer-retailer-consumer
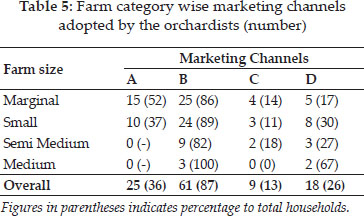
Table 5 shows different marketing channels used by the orchardist to dispose off their produce. Generally four channels were found to be adopted by the orchardist in the study area. It was observed from the analysis that about 36 per cent of the orchardist were found to be disposing of the produce through channel A, 87 per cent through channel B, 13 per cent through channel C and 26 per cent through channel D on overall basis. It can be seen that maximum percentage of orchardist were found to be disposing of their produce through channel B i.e., Producer - Primary wholesaler - Secondary wholesaler - retailer- consumer. Similar marketing channels of apple crop has been found by Kashyap and Guleria (2015) in Mandi district of Himachal Pradesh.
Mode of sale
Table 6 has shown the mode of sale adopted by the orchardist in the study area. It has been observed from the analysis that the percentage of the orchardists who disposed off their produce by themselves in the regulated markets ranged between 86 per cent in marginal category to 100 per cent in medium category and it was found out to be 87 per cent for overall data. The range of the orchardists who sold off their produce through pre harvest contractors was found to be between 14 to 18 per cent among different categories and about 13 per cent for the overall data. Maximum percentage i.e. about 18 per cent of the semi medium orchardist were found giving their orchards to pre harvest contractors which shows less managerial capacity amongst semi medium orchardist than other categories of the orchardist.
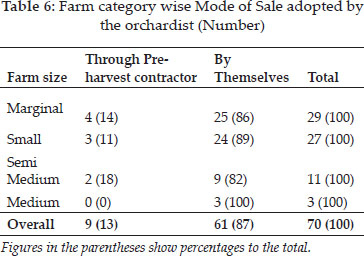
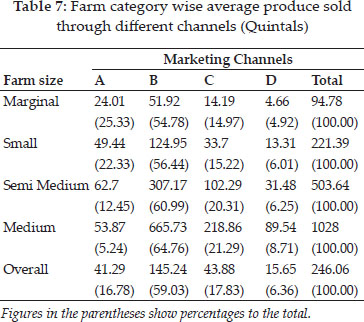
Table 7 shows quantity of produce sold by different categories through above marketing channels. The table shows that out of total marketable surplus in overall category maximum produce i.e. 59.03 per cent was disposed off through channel B i.e. Producer Primary wholesaler Secondary wholesaler retailer consumer followed by channel C, channel A and Channel D i.e. 17.83, 16.48 and 6.36 per cent. Similar results have also been observed by Chand et al. (2017).
Marketing cost and price spread
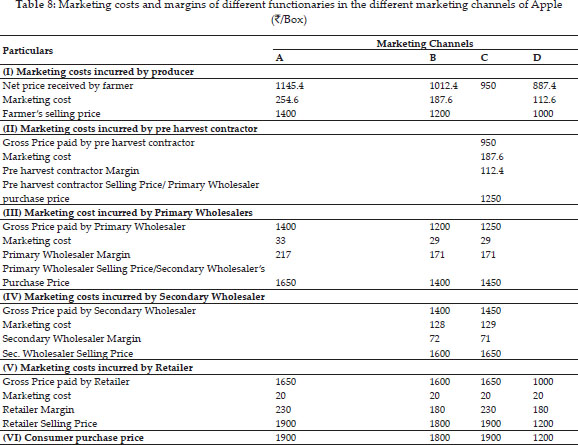
Marketing cost incurred by various marketing functionaries has been shown in table 8.
Cost incurred by producers
In Channel A, producer sold their produce to the consumer through wholesaler. The total marketing cost incurred by the producer was worked out to be ₹ 254.6 per box. The major item of cost was found to be cost incurred on transportation which amounted to ₹ 90 per box. In Channel B, producer sold their produce to primary wholesaler. The total marketing cost incurred by the producer was worked out to be ₹ 187.6 per box. In Channels C, producer sold their produce to pre harvest contractor so there was no marketing cost to be borne by the farmers. In Channel-D, producer sold the produce to the consumer through retailer. The total marketing cost incurred by the producer was worked out to be ₹ 112.6 per box.
Cost incurred by pre harvest contractor
The pre harvest contractor was found in the marketing Channels C. In Channel C pre harvest contractor spent ₹ 187.6 in the marketing, out of which major item of cost was packing material which accounted for ₹ 75 per box followed by commission charges of commission agent which was found to be ₹ 50 per box.
Marketing cost incurred by Primary wholesaler
The Primary wholesaler was found in the marketing Channel A, B and C. The total marketing cost incurred by the primary wholesaler was found to be ₹ 33 per box in channel A and ₹ 29 per box in channel B and C. The primary wholesaler marketing margins was found to be ₹ 217 in channel A and ₹ 171 per box in channels B and C.
Marketing cost incurred by Secondary wholesaler
The secondary wholesaler was found in the marketing Channel B and C. The total marketing cost incurred by the secondary wholesaler was found to be ₹ 128 per box in channel B and ₹ 129 per box in Channel C. The secondary wholesaler marketing margins was found to be ₹ 72 and ₹ 71 per box in both the channels.
Marketing cost incurred by retailer
Retailer was found to be present in all marketing Channel. The total marketing cost incurred by the retailer was ₹ 20 in all marketing channel. Retailer's margin was found to be ₹ 230 per box in channel A and C and ₹ 180 per box in channel B and D respectively.
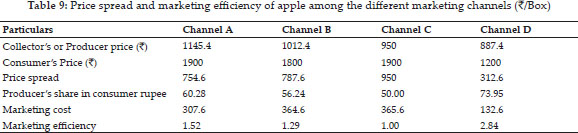
Price spread and marketing efficiency among different marketing channels
The price spread and marketing efficiency of apple among different channels has been presented in Table 9. The price spread was found to be maximum in channel C ₹ 950 followed by Channel B, A, and D i.e. ₹ 787.6, ₹ 754.6 and ₹ 312.6 respectively. Producer's share in consumer rupee was found to be maximum in channel D i.e. 73.95 per cent and minimum in channel C i.e. 50.00 per cent. Marketing efficiency which has been an indicator of overall performance of the marketing channels was found to be highest in channel D followed by channels A, B, and C respectively. Though channel D has been found to be most efficient but the volume transacted was very less (6.36%).
Marketing related problems faced by the sampled households in the study area
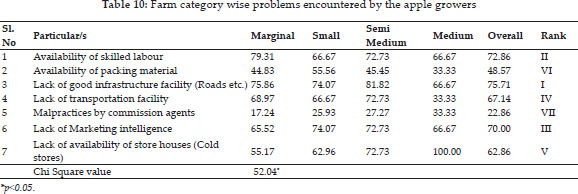
Lack of transportation facilities, availability of skilled labour, lack of marketing intelligence, lack of good infrastructure, malpractices on part of commission agent are some marketing related problems faced by the orchardist. Amongst these problems the major problems was found to be related with good infrastructure like roads (Rank I) followed by availability of skilled labor (Rank II) and lack of marketing intelligence (Rank III). About 67.14 per cent of the farmers highlighted that they were not able to transport their produce because lack of transport facilities in the area. These marketing problems were followed by lack of store houses, lack of packing material and malpractices on part of commission agent. Similar problems has been faced by apple growers of Shimla district (Kudamala et al. 2019)
In order to test whether marginal, small, semi medium and medium orchardist differ significantly or not for the problems faced by them, the approximate chi square was used. Calculated chi square value was found to be 52.40 which has been found to be higher than tabulated value i.e., 19.67 at 0.05% probability level at 11 degree's of freedom. This indicates that all the problems differ significantly between categories of various farm groups.
CONCLUSIONS
Apple production has proved to be highly remunerative farm activity. The present study, by focusing on marketing aspect of apple produce projects the economic potential of apple cultivation in Kullu district. The produce was found to be marketed through four channels and maximum i.e about 59 percent has been disposed off through second channel i.e. producer - primary wholesalersecondary wholesaler- retailer- consumer. Comparison between different channels revealed the highest share in consumer rupee has been found in Channel D (Producer - retailer-consumer) i.e. 73.95 per cent, followed by channel A (Producerwholesaler-retailer-consumer) i.e. 60.28%, Channel B (Producer-Primary wholesaler-Secondary wholesaler-retailer-consumer) i.e. 56.24 % and C (Producer-Pre harvest contractor- Primary wholesaler-Secondary wholesaler - retailerconsumer) i.e. 50.00 %. Marketing efficiency has also found to be highest in channel D i.e. 2.84 which means smaller the channel more profitable it is. Apple being a perishable product incurs huge post- harvest losses. In order to minimize these losses, steps are required for quick disposal of the produce using improved techniques of refrigeration, proper storage and improved packing material, maintenance and expansion of network of link roads must get added attention. Non- availability of sufficient market information to apple growers also affects the operational efficiency of the apple markets as a consequence of which the growers miss the opportunities to sell their produce at remunerative prices, in right place and time. In this regard, credit and crop insurance of apple cultivation should be provided through the formal institutional sources so as to lessen the grower's dependence on traders and improve bargaining power in the market. The practice of e-marketing could be used to increase the marketing efficiency in apple trade.
REFERENCES
Anonymous, 2019. Horticulture - Area under fruits/ Production of fruits. Statistical Outline of Himachal Pradesh. Economics and Statistics Department, Shimla, H.P, pp. 88-89.
Bahadur, S. 2010. Horticulture- Key to India's Agriculture Growth. (Accessed on July 30, 2013 and available at: http://www.commodityonline.com/news/horticulture-key-to-indias-agriculture-growth-34627-3-34628.html)
Kanwar, P.C. and Nadda, A.L. 1984. Economics appraisal of changing marketing structure-A case study of Himachal apples, India. Journal of Agricultural Economics, 29: 228-230.
Kashirsagar, K.G. 2006. Availing marketing infrastructure for horticultural crops: emerging present and future policies. Indian Journal of Agricultural Marketing, 20(2): 69-80.
Kashyap, R. and Guleria, A. 2015. Socio-economic and marketing analysis of apple growers in Mandi district of Himachal Pradesh. Journal of Hill Agriculture, 6(2): 202-206.
Kudamala, S., Sharma, S. and Guleria, A. 2019. Socio-economic characteristics and problems faced by apple cultivators under drip and without drip irrigation system. Economic Affairs, 64(2): 01-07.
Kumar, S., Karol, A., Singh, R. and Vaidya, C.S. 2007. Cost and return from apple cultivation: a study in Himachal Pradesh. Agricultural Situation in India, 41(7): 307-313.
NHB 2018. Area and production of horticulture crops for 201718, National horticulture board, Ministry of Agriculture and Farmer welfare, Government of India.
Randev, A.K. 2005. Marketing of apple in Shimla district of Himachal Pradesh. Indian Journal of Agriculture Marketing, 19(3): 12-19.
Chand, H., Guleria, C., Guleria, A. and Kashyap, R. 2017. Resource use efficiency and marketing analysis of apple crop in Shimla district of Himachal Pradesh, India. Indian Journal of Farm Sciences, 7(1): 1-6.
Naqash, F., Wani, F.J. and Bhat, I.F. 2018. Socio-Economic analysis of apple beneficiaries in Kashmir Valley. AgroEconomist, 5(1): 13-21.
Ali, J., Kachroo, J., Bhat, D.J. and Bhat, A. 2018. Analysis of Prices and Arrivals of Apple Fruit in Narwal Market of Jammu. Economic Affairs, 63(1): 107-111.