
Economic Affairs, Vol. 65, No. 2, pp. 161-166, June 2020
DOI: 10.46852/0424-2513.2.2020.4
Efficiency of Pomegranate Growers: A Data Envelopment Analysis
ABSTRACT
The present study aims at examining the level of efficiency of Pomegranate growers in Solapur district of Maharashtra which happens to be the leading district in terms of production and area under cultivation of this crop. The variation in the level of efficiency is estimated by using Data Envelopment Analysis (DEA) technique. There is a wide variation in the level of efficiency among the sample farmers for both of orchard age group-II (3rd year to 5th year) and group-III (6th year to 12th year) with mean technical efficiency scores estimated as 69.89 per cent and 85.03 per cent respectively. Thus, there is an opportunity of augmenting production with the available resources in both groups. Pomegranate growers in both groups have been clustered by using K-means cluster analysis in four categories on the basis of their technical efficiency scores as efficient, semi efficient, moderately efficient and poor. An attempt has been made to estimate the excessive amount of inputs used by the Pomegranate growers over the targeted level in the study area. The cost on their excessive inputs can be minimized without affecting output level of particular farms.
Highlights
 In this study for examining the level of efficiency of Pomegranate growers Data Envelopment Analysis (DEA) technique was used.
Keywords: DEA, efficiency, Pomegranate, Solapur etc.
Pomegranate which has greater relative advantage in Maharashtra compare to other regions of the country has a definite commercial status in recent times particularly during the past two-three decades due to increasing urban affluence with changing life style. The state Maharashtra represents one of the leading Pomegranate growing states in India in terms of its area under cultivation recorded as 147910 hectares. This shares 63.22 per cent of total area under this crop in India. Again this state shares 62.90 percent of countries total pomegranate production. (Statistics Division, Department of Agriculture, Coopn & Farmers Welfare 2017-18). Data Envelopment Analysis (DEA) is a mathematical programming approach for estimating the relative Technical Efficiency of production activities. Data Envelopment Analysis was introduced by Farrell (1957) and later on extended by Charnes et al. (1978), to incorporate multiple inputs and multiple outputs simultaneously for estimating technical efficiency relative to a production frontier.
Data Envelopment Analysis (DEA) is used to analyze the technical efficiency, i.e. the degree to which a grower uses the minimum feasible amount of resources to produce a given level of output (Coelli et al. 2005). Data Envelopment Analysis (DEA) calculates the relative efficiency scores of various Decision-Making Units (DMUs) in a particular farm sample. DEA technique is a non-parametric measure showing performance or technical efficiency of an existing technology relative to an ideal “best practice” or frontier technology (Coelli et al. 1998). The frontier or best practice technology is a reference technology or production frontier that depicts the most technically efficient combination of inputs and outputs. The frontier technology is formed as a non-parametric, piece wise linear combination of observed -best practice” activities. Data points are enveloped with linear segment and technical efficiency score are calculated relative to the frontier technology.
How to cite this article: Rede, G.D. and Bhattacharyya, K. (2020). Efficiency of pomegranate growers: A data envelopment analysis. Economic Affairs, 65(2): 161-166.
Source of Support: None; Conflict of Interest: None 
An assessment of performance of technical efficiency of an existing technology relative to an ideal ‘Best Practice' or frontier technology will be helpful to the pomegranate growers for scaling down the scare factors in order to minimize the cost of cultivation of that crop without affecting level of output. Considering the importance of Pomegranate crop in farm economy, the specific objective of study was to analyse the efficiency of selected Pomegranate growers using the input factors.
METHODOLOGY
Simple Random Sampling Without Replacement (SRSWOR) method has been used for selection of sample farmers in this study. Five blocks namely Sangole, Pandharpur, Malshiras, Mangalvedha and Mohol have been selected from Pomegranate cultivating eleven blocks contained in Solapur district. One hundred fifty (150) cultivators representing ultimate sample unit have been chosen from total number of Pomegranate cultivators contains in selected five blocks by SRSWOR. The collected data have been rearranged, processed and analyzed to fulfill the stated objective of the study by employing Data Envelopment Analysis (DEA) technique.
Data Envelopment Analysis (DEA)
Data Envelopment Analysis (DEA) is a mathematical programming to construct a production frontier comprising a set of linear segments. The frontier relates to best performance at a point in time. The points separating the segments are forming the best practice Decision Making Unit (DMUs) within a sample. The frontier “envelopes” the entities with the best of output/input ratios. The distance of an inefficient DMU from the frontier is the measure of its inefficiency. For each organization inside the frontier that is found by DEA to be inefficient, the technique identifies at least one DMU on the production frontier. That is a “peer” or role model to the inefficient organization. The technique assigns a wait to each peer reflecting the relevance of that peer to the inefficient DMU.
Briefly, DEA uses mathematical programming to construct a production frontier comprising a set of linear segments. The Frontier relates to the best performance at a point of time and technical efficiency of a DMU (Decision Making Unit) is measured in terms of distance from the frontier. Mathematically the problem DEA is expressed as,
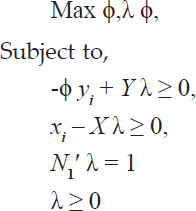
In the above mathematical model, φ can take any value between one and infinity. The proportional increase in output that could be achieved by the ith Pomegranate producing farm or decision making unit (DMU) with input quantities held constant is indicated by (φ-1). Y is (1 × N) the output matrix, λ is (N × 1) vector of intensity variables, X is (K × N) the input matrix, yi is the output of ith farm, x. is the input of ith farm, N1' is a vector of (N×1) and convexity restriction. The ratio of 1/φ defines a technical efficiency score between zero and one (Coelli et al. 1998). One output and eight inputs were used in the model. The output is the per hectare yield of pomegranate production in Solapur district. Inputs included are number of plants per hectare, total human labour (days) per hectare, bullock labour (days) per hectare, machine labour (days) per hectare, irrigation (hours) per hectare, manures (tonnes) per hectare, total fertilizers (kg) per hectare and plant protection chemicals (lit) per hectare. A plant protection chemical represents the total amount of insecticides, fungicides, and herbicides etc., used in pomegranate production.
Using k-means cluster analysis Pomegranate growers are classified into four homogenous groups, viz.; efficient, semi efficient, moderate and poor in terms of technical efficiency scores.
RESULTS AND DISCUSSION
Efficiency of selected pomegranate cultivators:
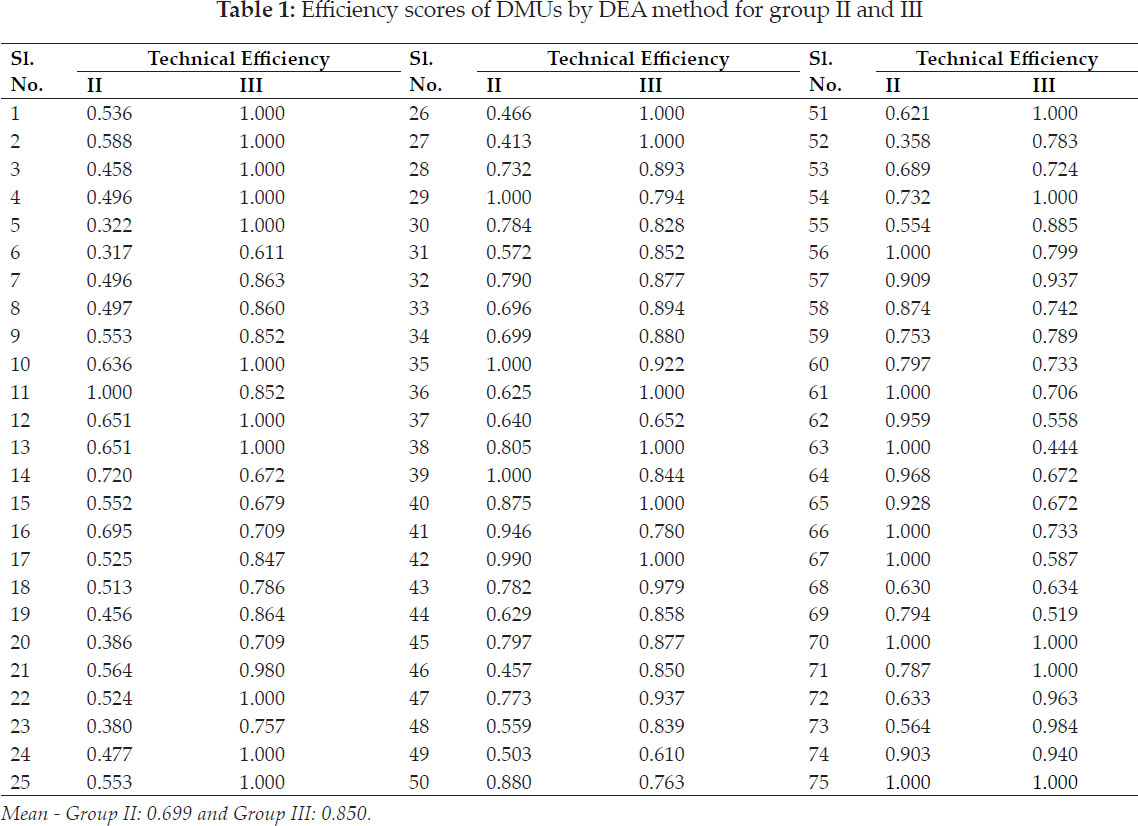
Solapur district in Maharashtra state is dominated by pomegranate crop for a long time. Pomegranate growers of the study area follow more or less same techniques for production but differ widely in terms of output per unit of area. The causes of such variation are owing to differences in the level of efficiency. An attempt has been made to measure the extent of such variation using Data Envelopment Analysis i.e. DEA techniques, which is farm specific influencing production variation. Another objective of using DEA method is to find out the scope for minimizing valuable resources in the disposal of pomegranate growers. The efficiency scores of decision making units i.e. DMUs estimated by DEA for orchard age group II (3rd year to 5th year) and III (6th year to 12th year) are shown in Table 1.
The technical efficiency relates to the degree to which a grower uses the minimum feasible amount of resources to produce a given level of output (Coelli et al. 2005). When considering the maximum and minimum values in Table 1, it can be seen that there is a wide variation in the level of efficiency among the sample pomegranate growers for both groups. The mean score level has been estimated as 69.98 per cent for group II and 85.03 per cent for group III. Thus, there is an opportunity of augmenting at least 30 per cent of production in II and 15 per cent for group III with the available farm resources. In other words there is a scope for lifting the inefficient producers belongs to both groups to the level of best practice by increasing the production to the extent of 30 per cent and 15per cent respectively. Similar results were found by Suresh, (2015), Suresh and Chandrakanth (2016) and Kavand and Sargazi (2016).
Additionally, summary statistics for variables used in the efficiency analysis of age group II (3rd year to 5th year) and III (6th year to 12th year) are presented in Table 2.
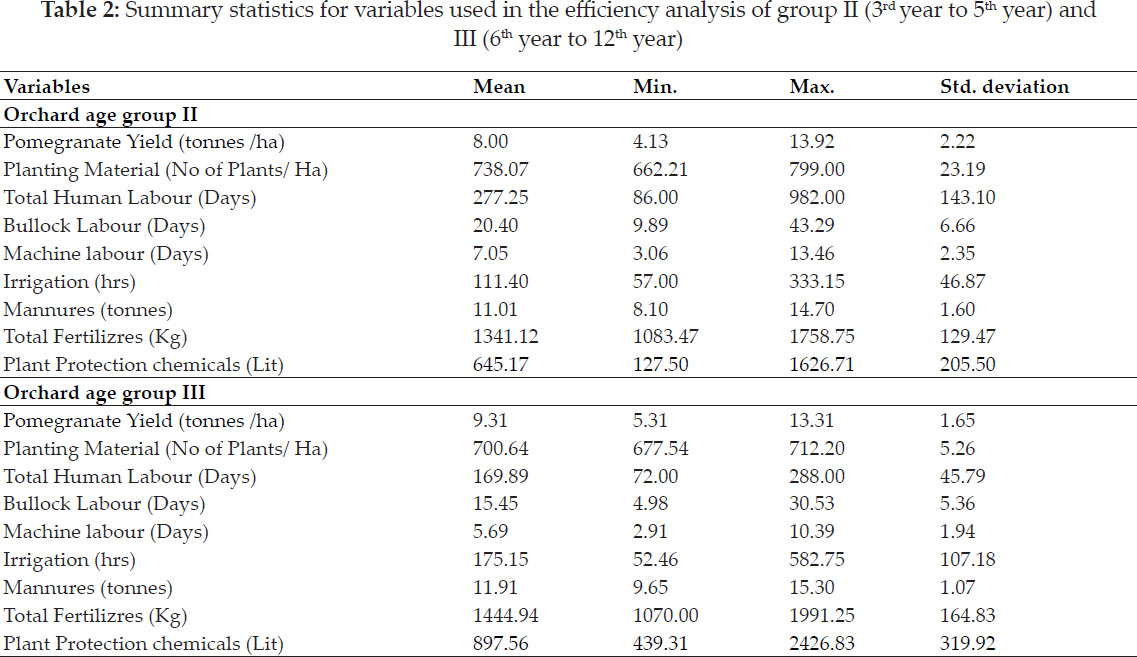
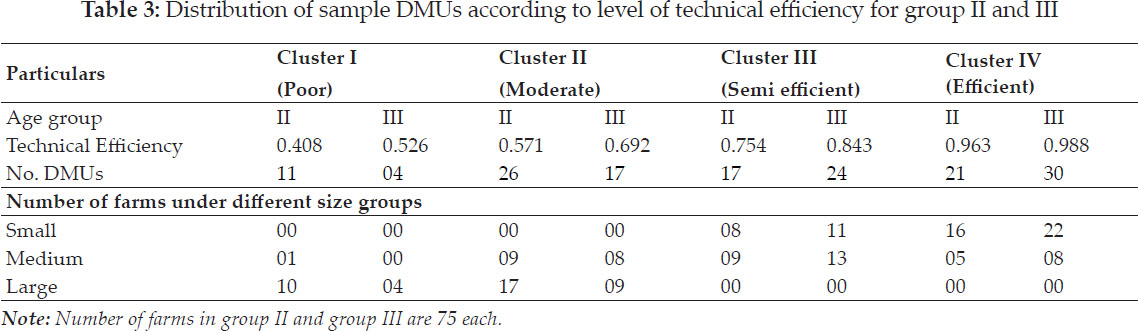
When considering the maximum and minimum level of inputs used in the efficiency analysis, it is observed that there is a wide variation in the level of application of inputs in the sample farms. Distribution of pomegranate growers into four distinct groups according to level of technical efficiency for both groups of sample pomegranate farmers Adhikari et al. (2012), Bhatt and Bhatt (2014), Ray et al. (2016) and Singh and Kaur (2014) and it has been presented in Table 3.
Table 3 shows that, out of 75 farmers in group II, 21 farmers which accounts for 28 per cent belong to efficient cluster. Similarly 30 farmers in group III show their efficiency which is accounted for 40 per cent of the sample pomegranate growers belongs to the efficient cluster. It is also seen that maximum number of DMUs of group II comes under moderately efficient category with mean efficiency 0.57. On the other hand maximum number of DMUs of group III comes under efficient category with mean efficiency 0.98. It is also estimated that 50.66 per cent of sample units from group II belongs to semi efficient and efficient category and 72 per cent from orchard age group III. It is also estimated that 14.66 per cent and 5.33 per cent of group II and group III in poor category farms can be improved by augmenting output with 60 per cent and 58 per cent respectively. Similarly 34.66 and 22.66 per cent moderate category farmers can increase output by 43 and 31 per cent of group II and III respectively, with the existing level of resources.
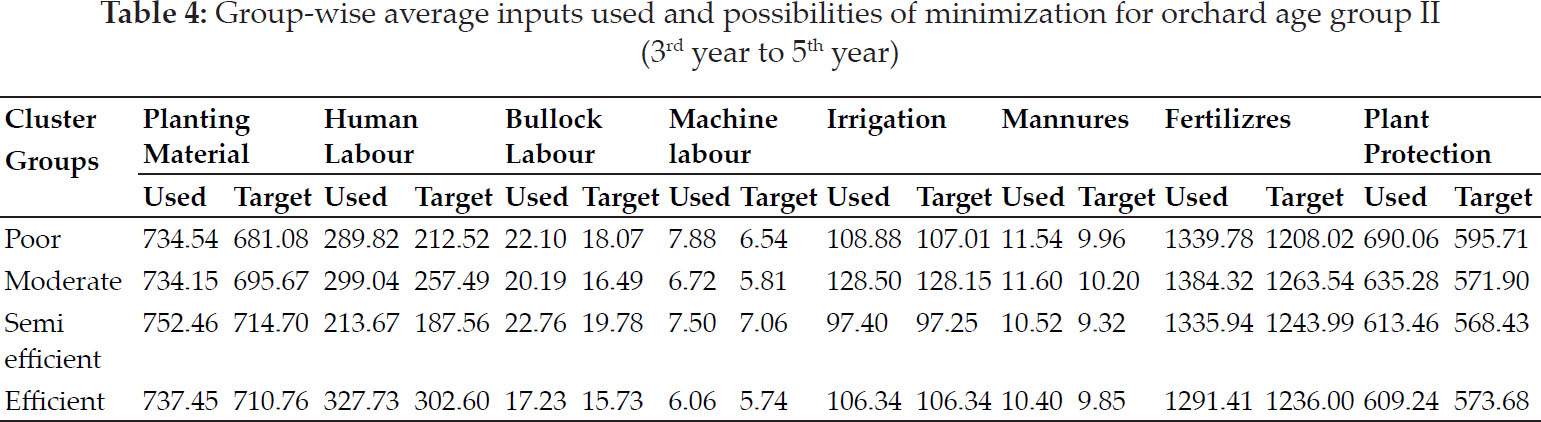
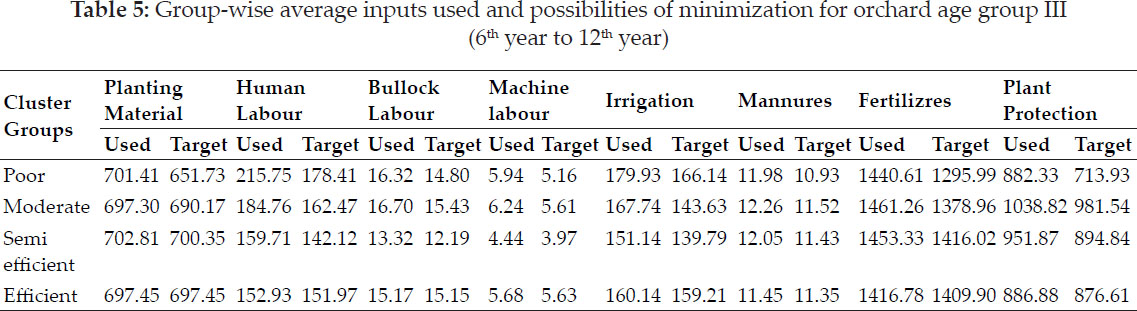
Group-wise average inputs used and possibilities of critical input without loss of current level of production reduction for group II and III has been shown in Table 4 and 5. A wide variation between used and targeted amount of inputs has been found in all cluster groups for the orchard age group II. The similar variation has also seen in case of group III.
An attempt has been made to analyze the slack variables which indicate the excessive amount of inputs used by the pomegranate growers over the targeted level in the study area (Ozalp and Yilmaz 2015). Mean of actual amount of inputs used and their slacks of the group II and III are presented in Table 6.
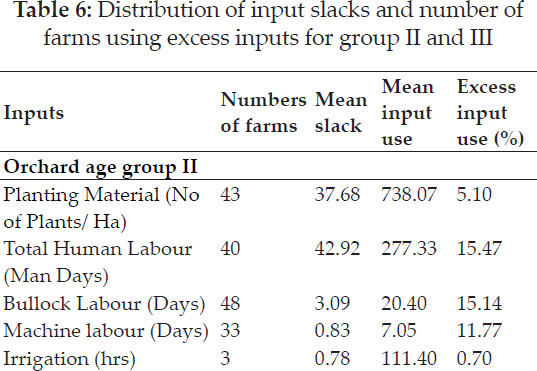
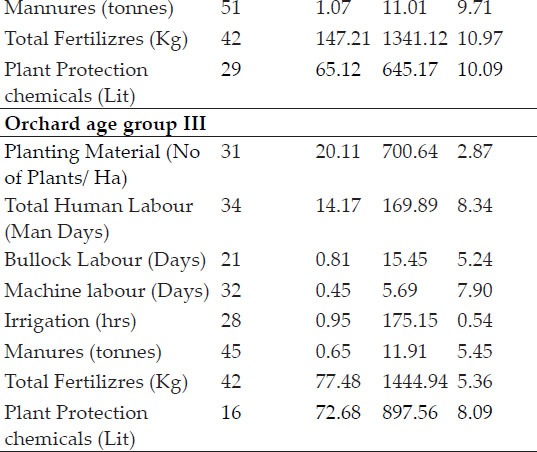
The excessive inputs used in total human labour and bullock labour are found to be maximum in group II (3rd year to 5th year) as revealed by the Table 5.25. In other words it can be said that farm can minimize human labour and bullock labour use by 15.47 per cent and 15.14 per cent respectively. Thus, there are ample scope of minimizing 42.92 man days per hectare and 3.09 bullock pair days without curtailing existing output. This will lead to saving labour as well as reducing input costs. It is also estimated that 53.33 per cent man days and 64 per cent for bullock labour days of DMUs have potential for scaling down in group II. In the same way the particular farm can minimize their machine labour use by 11.77 per cent. As well, in case of manures and fertilizers there is scope for decreasing their quantum by the amount of mean slack i.e., on an average of individual pomegranate grower possess the potential for cutting down manure amount by 1.07 tonnes per hectare and 147.21 kg fertilizers per hectare. Automatically costs on these inputs can be decreased without affecting output level of particular farms. Optimum use of irrigation is witnessed in study area because majority of pomegranate growers are using drip irrigation system for irrigating the orchard. Similarly the excess use of human labour followed by plant protection chemicals and machine labour is found to be high in the farms belong to group III. Therefore, the particular farms may curtail their 8.34 per cent human labour, 8.09 per cent plant protection chemicals and 7.90 per cent machine labour while maintaining the same level of output. Thus, there is a good opportunity of curtailing 14.17 man days per hectare and 72.68 lit plant protection chemicals which leads to diminishing input costs. A farm can reduce its expenditure on key inputs like manures and fertilizers by 5.45 per cent and 4.36 per cent amount for particular slack variable. In the same way the particular farm can minimize their bullock labour use by 5.24 per cent and number of plants per hectare by 2.87 per cent. Hence costs on these excessively used inputs can be decreased without affecting output level of particular farms.
CONCLUSION
The study conclude that there is a wide variation in the level of efficiency among the sample farmers for both of orchard age group-II (3rd year to 5th year) and group-III (6th year to 12th year). So, there is ample scope for saving critical inputs. Overall technical efficiency suggests that the average farm can reduce its amount of input usage without reducing its output. This can be achieved by improving farm technologies and managing improper input use. In group II and III 28 per cent and 40 per cent farmers belong to efficient cluster respectively. Similarly, it is also seen that maximum number of Decision Making Unit's (DMUs) of group-II comes under moderately efficient. In group-III, the maximum number of DMUs comes under efficient. The estimated mean efficiency in poor category farms reveals that 14.66 per cent of group-II and 5.33 per cent of group-III farms belong to poor category can be improved by augmenting output by 60 per cent and 58 per cent respectively. A farm can reduce its spending on a particular input to the tune of the amount of that slack variable, without dropping its production level.
REFERENCES
Adhikari, C.B. and Bjorndal T. 2012. Analyses of technical efficiency using SDF and DEA models: evidence from Nepalese agriculture. Applied Economics, 44: 3297-3308.
Bhatt, M.S. and Bhatt, S. A. 2014. Technical efficiency and farm size productivity—micro level evidence from Jammu & Kashmir. International Journal of Food and Agricultural Economics, 2(4): 27-49.
Charnes, A., Cooper, W.W and Rhodes, E. 1978. Measuring the efficiency of DMUs, European Journal of Operational Research, 2: 429-444.
Coelli, T., Rahman, S. and Thirtle, C. 2005. Technical, Allocative, Cost and Scale Efficiencies in Bangladesh Rice Cultivation: A Non-Parametric Approach. Journal of Agricultural Economics, 53(3): 607-626.
Coelli, T., Rao, D.S.P. and Battese, G. 1998. An Introduction to Efficiency and Productivity Analysis, Kluwer Academic Publishers, Boston.
Farrell M. 1957. The measurement of productive efficiency Journal of the Royal Statistical Society, Series A, 120: 253-281.
Kavand, H. and Sargazi, A.R. 2016. Determination of efficiency types of Borujerd sugar beet growers using data envelopment analysis (DEA). Journal of Sugar and Beet, 31(2): 209-201.
Ozalp, A. and Yilmaz, I., 2015. Productivity and efficiency analysis of Pomegranate production in Antalya province of Turkey. Acta Horticulture, 1089: 197-204.
Ray, J., Paul, D., Mitra, A., Chaudhuri, R. and Sarkar, D. 2016. A case study on resource-use efficiency in Onion cultivation in West Bengal, India. Economic Affairs, 61(2): 321-326.
Singh, T. and Kaur, B. 2014. Application of Data Envelopment Analysis (DEA) for assessing the efficiency of Laser Land Leveling Technology in Punjab Agriculture. Economic Affairs, 59(2): 251-261.
Suresh, A. 2015. Efficiency of Agricultural Production in India: An Analysis using Non-Parametric Approach. Indian Journal of Agricultural Economics, 70(4): 471-486.
Suresh, K. and Chandrakanth, M.G. 2016. Economic efficiency of improved red gram variety (BRG-2) in Karnataka: a DEA analysis. Economic Affairs, 61(1): 81-88.