Economic Affairs, Vol. 65, No. 3, pp. 333-342, September 2020
DOI: 10.46852/0424-2513.3.2020.3
![]()
Foodgrains Production in India: Trend and Decompositions Analysis
ABSTRACT
The present study was undertaken to analyze the trends in area, production and productivity of major food grain crops for the period 1995–96 to 2015–16 obtaining data from the Directorate of Economics and Statistics, Ministry of Agriculture, Government of India, New Delhi. Foodgrains are cultivated in India in an area of 123.22 million hectares with a production of 251.57 million tonnes. The results of the study revealed that the food grains production in the country has increased at a rate of 1.73 per cent per annum which was contributed by negligible increase in area and productivity during the study period. The production-wise scenario of foodgrains has indicated that, major cereals like rice, wheat and maize showed consistent improvement, but pulses production was not consistent. As a coarse cereal, maize stands in an important position next to rice and wheat, due to its multiple uses with yield increases from about 1595 Kg per ha during 1995–96 to 2563 Kg per ha during 20015–16. The computed growth trend for total food grains in India was positive (0.008) and significant (P<0.01) for production and growth for productivity was positive (0.006) and significant (P<0.01).
Highlights
 Notably maize showed increase in area, yield and production during study period.
Growth rates of all food grains except jowar was positive and significant during the period.
Keywords: Area, Compound annual growth rate (CAGR), decomposition, food grains, production, yield
World population, particularly the population of developing countries is increasing at an alarming rate. To feed this ever-increasing population remains a challenging task to the planners of these countries and also the world bodies (Mishra et al. 2015). Agriculture plays a vital role in the Indian economy. Indian agricultural sector has undergone tremendous transformation over the years from a state of severe food crisis to self-sufficiency in food grain production. India has moved away from dependence on food aid to become a net food exporter, with a five-fold increase in food grain production from 50 million tonnes in 1950–51 to about 287.17 million tonnes in 2018–19 (Indiastat, 2018). The post-independence period in India experienced a historically unprecedented growth of agricultural production.
Lots of studies have been done on foodgrain production and its contributing factors. Khatkar et al. (2016) showed that the area under wheat cultivation has accelerated significantly in comparison to other cereals and millets during 2000–01 to 2010–11. Dhingra (2015) analyzed yield of principal crops in India and found that the compound annual growth rate of foodgrains is 2.0 but in cases of rice and wheat which are the major constituents of food grains it is 1.97 and 1.35 respectively whereas for maize it is slightly better and is to the order of 3.00. In case of cereals CAGR is 2.34 and for pulses it is 2.44 during the same period. Ahmed et al. (2015) also reported that production of major cereals in India increased with positive growth rates and it was due to adoption of high yielding varieties. Kumar and Mittal (2006) analyzed agricultural productivity trends in India. The findings revealed that paddy and wheat, the major staple food crops, have performed well in productivity gains. A study by Larson et al. (2004) showed that increase in crop yields and crop acreages have contributed positively to the increased production for most crops.
How to cite this article: Kumari, N., Mehta, V.P. and Bhatia, J.K. (2020). Foodgrains Production in India: Trend and Decompositions Analysis. Economic Affairs, 65(3): 333–342.
Source of Support: None; Conflict of Interest: None ![]()
Priscilla et al. (2017) observed that during 1995–96 to 2004–05, the contribution of yield to foodgrains production was found to be higher and even offsetting the area effect and interaction effect which can be attributed to the increased use of high yielding varieties and fertilizers. Dhanalakshmi (2017) found that during study period (2000-01 to 2015–16) the cultivated area of total foodgrains has reduced from 95.32 million hectare in 2000–01 to 92.43 million hectares in 2015–16 with a negative CAGR of 0.19 per cent. Pathak et al. (2017) studied challenges and options for meeting the needs of pulses and found that the annual compound growth of chickpea recorded the highest growth rate in area (4.5 per cent), production (9.6 per cent) and in yield (5.1 per cent) during 2008–09 to 2013–14.
In India cereals have been considered as the principal component of human diet among the food crops, for thousands of years. They constitute rice, wheat, maize and to lesser extent jowar and millets and for a vegetarian population like India pulses are the major source of proteins. Owing to the importance of the foodgrains in the country, trend in area, production and productivity of six foodgrain crops was studied using compound annual growth rate.
METHODOLOGY
The present study was undertaken in Haryana State during the year 2016–17. To meet the objective of this study, data on different variables such as area, production and productivity of major foodgrains in India were collected from Directorate of Economics and Statistics (DES), Ministry of Agriculture (MoA), Government of India, New Delhi. The periods of study were classified as follows for the meaningful elucidation of results:
1995–96 to 1999–2000 (Period-I)
2000-01 to 2004–05 (Period-II)
2005-06 to 2009–10 (Period-III)
2010-11 to 2015–16 (Period-IV)
1995-96 to 2015–16 - Overall period
Analysis of Data
Trend analysis: Compound annual growth rate (CAGR), was computed for examining trends in area, production and productivity of major food grain crops by fitting to the time series data in exponential function of the following form:
Yt = abt
Or LnY = Ln a + bt
Where, LnY = area, production and productivity of foodgrain crops
t =Time (Years)
a - intercept
b - growth rate to be estimated
Compound growth rate in per cent (r) was thus estimated as under:
r = (h - 1) x 100
The significance of growth rate was tested by applying Student's-test statistics.
Decomposition analysis
To measure the relative contribution of area, yield to the total output change for the major foodgrain crops. The method state that if A0, P0 and Y0, respectively area, production and productivity in base year and A , P and Y are values of the respective variable in nth year item.
Po = Ao x Yo and
Where, Ao and An represent the area and Yo and Yn represents the yield in the base year and nth year respectively.
From equation (1) and (2) we can write,

Hence,
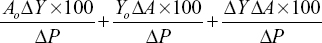
Production = Yield effect + area effect + interaction effect
Thus, the total change in production can be decomposed into three components viz., yield effect, area effect and the interaction effect due to change in yield and area.
RESULTS AND DISCUSSION
Area under foodgrains in India from 1995–96 to 2015-16
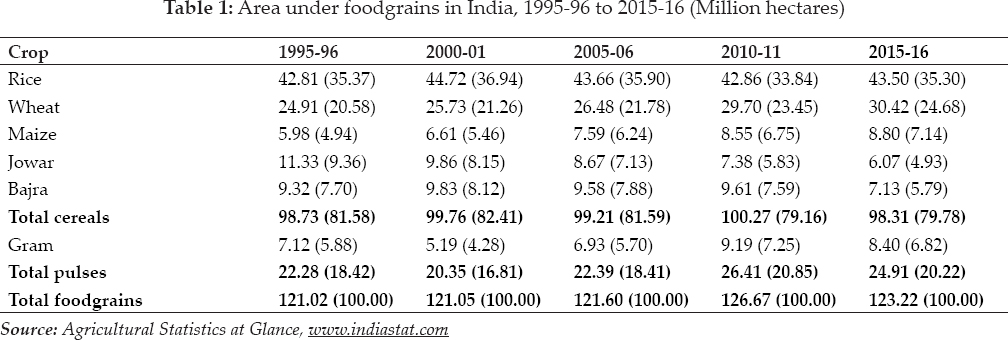
In 1995–96, total foodgrains constituted an area of 121.02 million hectares which continuously increased to 126.67 million hectares during 2010–11 but slightly declined to 123.22 million hectares in 2015–16 (Table 1). Crop wise analysis shows that rice and wheat occupied larger share of area as they are staple foods in our country followed by maize, jowar, bajra and gram. Rice area in 1995–96 was 42.81 million hectares which shows increased to 44.72 million hectares in 2000–01 and declining pattern till 2010–11 and then an increase in area in 2015–16.
Figures in parenthesis are percentages: area under crop to total area under foodgrains
Wheat area during 1995–96 was 24.91 million hectares which continuously increased to 30.42 million hectares in 2015–16. Maize area which was 5.98 million hectares in 1995–96 continuously increased to 8.81 million hectares in 2015–16. Jowar area in 1995–96 was 11.33 million hectares which reduced to 6.07 million hectares in 2015–16. Bajra area which was 9.32 million hectares in 1995–96 decreased to 7.13 million hectares in 2015–16. Area under total cereals was highest in 2010–11which was 100.27 million hectares during the study period. Area under pulses is hanging around 20 million hectares in the country throughout the study period. Analysis of area under pulses during the period 1995–96 to 2015–16 showed that it is highest during 2010–11 which was 26.41 million hectares. Among pulses gram area which was 7.12 million hectares in 1995–96 shows an irregular pattern in the subsequent periods, and shows an increase in 2010–11 which is 9.19 million hectares, highest in the study period and then again decreased to 8.40 million hectares during 2015–16. Among food grains wheat and maize showed continuous increase in area under cultivation during the study period. We can also say that cereals constitute major area as compared to pulses and wheat and rice occupy the major area under foodgrains as compared to coarse cereals and pulses.
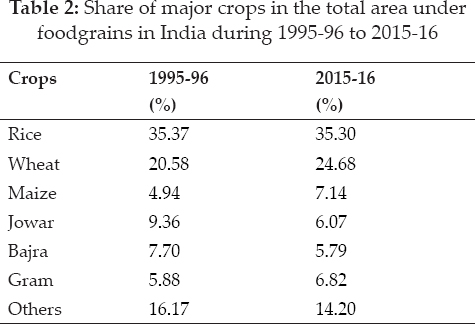
Share of major crops
Share of major crops to total area under food grains are depicted in Table 2. Share of wheat to the total area under food grains in India in 1995–96 was 20.58 per cent which gradually increased to 24.69 per cent in 2015–16. Share of rice did not show much change during this period. In the year, 1995–96 jowar share was 9.36 per cent which gradually declined to 4.93 per cent in 2015–16. The share of gram which was 5.88 percent in 1995–96 was increased to 6.82 in the period 2015-16.
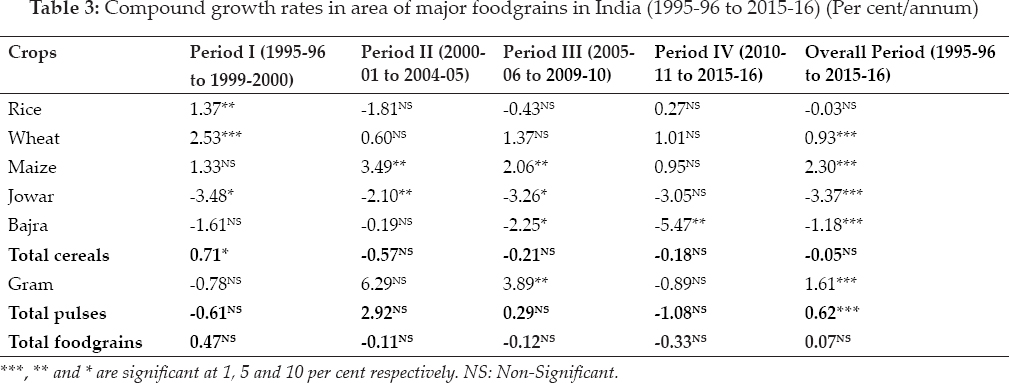
Growth rates in area of major foodgrain crops in India
At all India level, CAGR of rice showed significant growth of 1.37 per cent in the first period while growth in rest of the periods was non-significant. Area under wheat crop increased at a growth rate of 0.93 per cent per annum during the overall period. Wheat shows a considerable growth of area and the main reason of this increase was shift in area from coarse grain production to wheat production. However, the maximum increase is of the order 2.53 per cent per annum during the period-I growth in the rest of the periods was non-significant. The overall rate of increase in maize was 2.30 per cent per annum. There has been continuous decline in area under jowar and bajra crops at different rates in four different periods and the overall period. The overall rate of decline in area of jowar and bajra was 3.37 and 1.18 per cent per annum, respectively. During the overall period the area under gram crop has increased at the rate of 1.61 per cent per annum. Area under pulses increased at a growth rate of 0.62 per cent per annum during the overall study period. The incremental increases in rice and wheat areas have primarily come from reduction in area from coarse cereals i.e. jowar and bajra as a result of crop diversification in favour of fine cereals in period-I. In case of total cereals, the growth rates were non-significant except during period-1, which was 0.71 per cent per annum at ten per cent level of significance. The growth rate of area under total foodgrains was non-significant during the individual as well as overall study period.
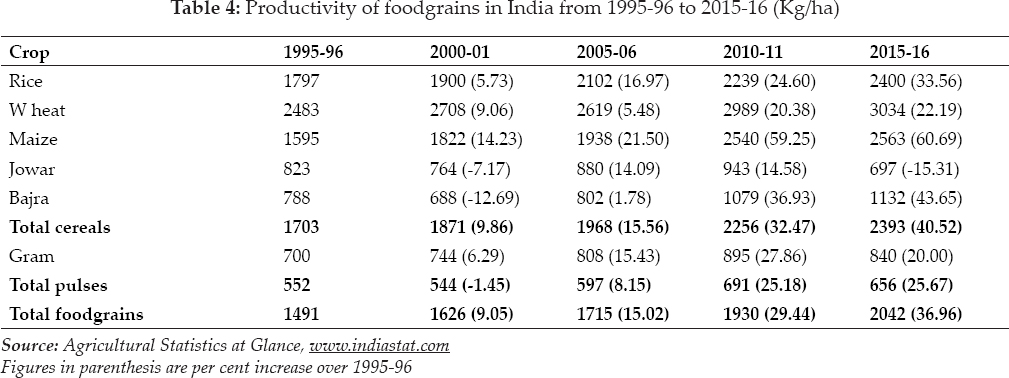
Productivity of foodgrains in India
The productivity scenario of food grains has been shown in the table 4. The data in the table shows that productivity of foodgrains rose consistently throughout the study period which was 1491 kg per hectare during 1995–96 and increased to 2042 kg per hectare in 2015–16. Productivity of rice, wheat and maize shows consistent increase during the study period. Rice, wheat and maize productivity were recorded at 2400, 3034 and 2563 kg-ha respectively in 2015–16 indicating the larger adoption by farmers for the economic advantage of irrigation, fertilizer and prices of these crops. Also pulses, which occupy marginal lands and grown in rainfed areas, experienced fluctuations in their productivity. Gram exhibited irregular trend in productivity from 199596 to 2010–11, productivity continuously increased from 700kg per hectares in 1995–96 to 895 kg per hectares in 2010–11 and then decreased to 840 kg per hectares in 2015–16. In case of bajra productivity first decreases from 788 kg per hectares in 1995–96 to 688 kg per hectares in 2000–01, but after 200001 showed an increase in productivity till 2015–16 which was 1132 kg per hectares. The productivity of total foodgrains was 1491kg per hectares in 1995–96 and increased to 2042 kg per hectares in 2015–16.
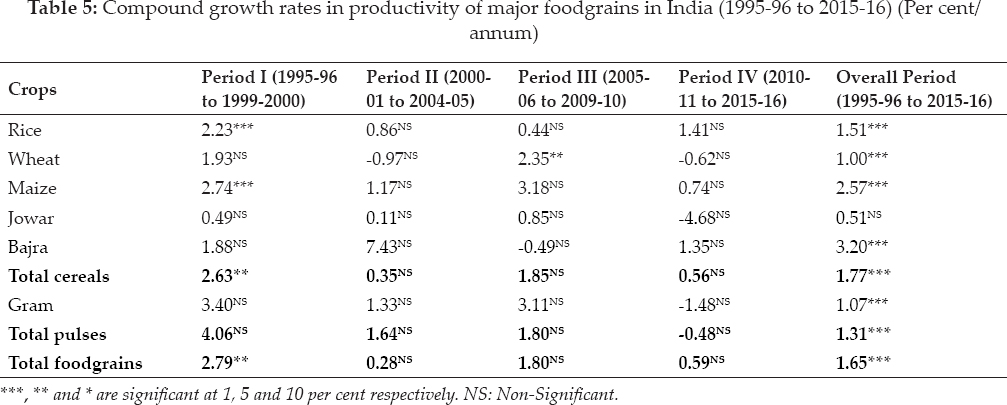
Growth in productivity of major foodgrain crops in India
The perusal of table 5 shows the growth rates of productivity of major foodgrain crops in the country. In case of rice crop, the productivity has increased at the growth rate of 1.51 per cent per annum at one per cent level of significance during the overall period. When we see over the periods, yield has increased at the growth rate of 2.23 per cent per annum during the period-I only; change in growth rate was non-significant during the rest of the periods. Yield of wheat has increased at the rate of 2.35 per cent per annum at five per cent level of significance during the period-III. During the overall period, wheat yield increased at the rate of 1.00 per cent per annum. In case of maize crop, the yield has increased at the rate of 2.57per cent per annum during the overall study period. Yield of jowar show non-significant growth during the study period. In case of bajra, the yield has increased at the rate of 3.20 per cent per annum during the overall period. Yield of total cereals increased at the growth rate of 2.63 per cent per annum at five per cent significance level during period-I and with a growth rate of 1.77 per cent per annum at ten per cent significance level during the overall period. Yield of gram and total pulses, has increased at the growth rate of 1.07 and 1.31 per cent per annum during the overall period. In case of total foodgrains, yield has increased at the growth rate of 1.65 per cent per annum during the overall period. Yield of all crops has increased significantly except jowar during the overall period.
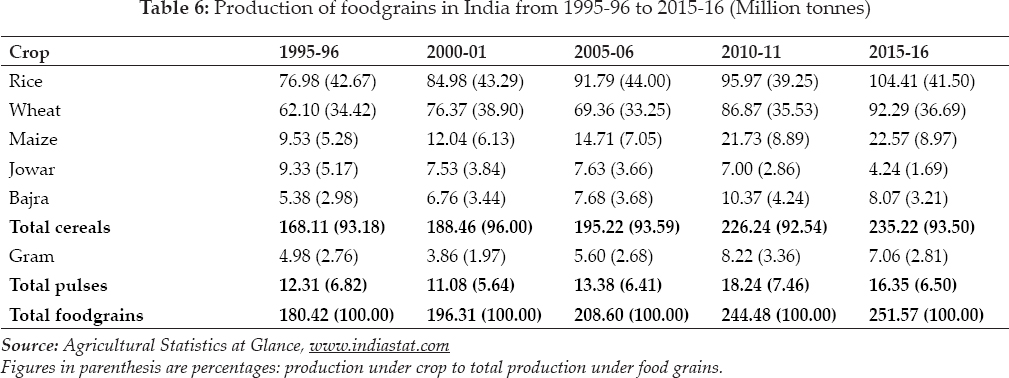
Production of foodgrains in India
The production scenario of foodgrains has been shown in Table 6. Production of foodgrains showed consistent increase during the study period. Total foodgrains production in 1995–96 was 180.42 million tonnes which was increased to 251.57 million tonnes in 2015–16. Major cereals like rice, wheat and maize showed consistent increase in production whereas pulses didn't show such pattern. Rice production in 1995–96 was 76.98 million tonnes which increased to 104.41 million tonnes in 2015–16. Wheat production increased to 92.29 million tonnes in 2015–16 from 62.10 million tonnes in 1995–96. Maize production becomes double from 9.53 million tonnes in 1995–96 to 22.57 million tonnes during 2015–16. In 1995–96, total pulses production was 12.31 million tonnes which increased to 16.35 million tonnes in 2015–16. It is clear from the analysis that the production of total cereals shows an increasing trend while that of pulses didn't show any such pattern which depicts the poor status of pulses in the Indian agriculture.
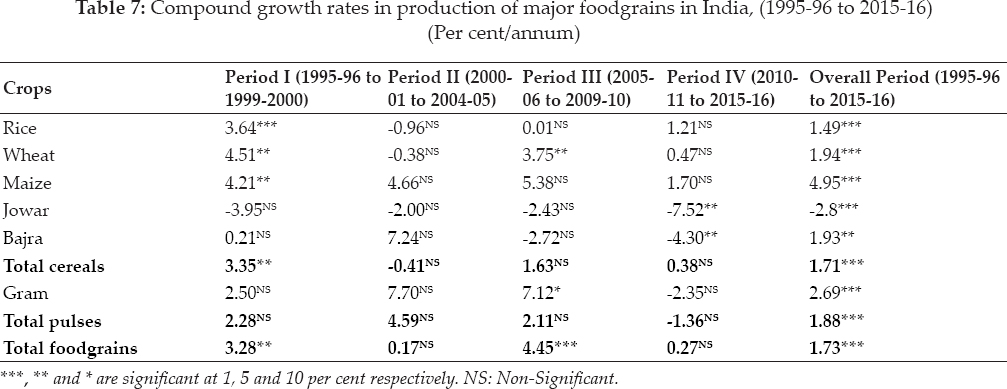
Growth rates in production of major foodgrain crops in India
Table 7 presents the growth rates of production of major foodgrain crops under study in the country. In case of rice production has increased at the rate of 1.49 per cent per annum during the overall period. Rice production showed highest growth rate of 3.64 per cent per annum during the first period. In case of wheat, production has increased at the rate of 4.51 and 3.75 per cent per annum at five per cent level of significance during first and third period and showed an increase in production with a growth rate of 1.94 per cent per annum at one per cent level of significance during the overall study period. Wheat registered growth rate of production, it is only because of increase in the area under wheat cultivation. Maize production has increased at the rate of 4.21 per cent per annum at five per cent level of significance during first period and at the growth rate of 4.95 per cent per annum at one per cent level of significance during the overall period. Production of jowar has declined at the rate of 7.52 per cent per annum at five per cent level of significance and at the rate of 2.8 per cent per annum at one per cent level of significance during the overall period. In case of bajra, production has declined at the rate of 4.30 per cent per annum during the third period. However, during the overall period, production of bajra has increased at the rate of 1.93 per cent per annum. Rate of increase in production of total cereals was 3.35 per cent per annum at five per cent level of significance during the first period and showed an overall growth rate of 1.71 per cent per annum at one per cent level of significance. Production in case of gram and total pulses has increased at the rate of 2.69 and 1.88 per cent per annum, respectively during the overall period. Total foodgrains production has increased at the rate of 3.28, 4.45 and 1.73 per cent per annum at five per cent, one per cent and one per cent level of significance during first, third and overall period. Production of all crops increased significantly but production of jowar declined due to non-significant growth in yield and decrease in area. All India rice area, production and productivity registered a positive growth during the period-I (1995-96) of the study and results were in consensus with Kumar and Mitral (2006). However, it substantially declined during the period-II, III and IV and registered even negative growth in area.
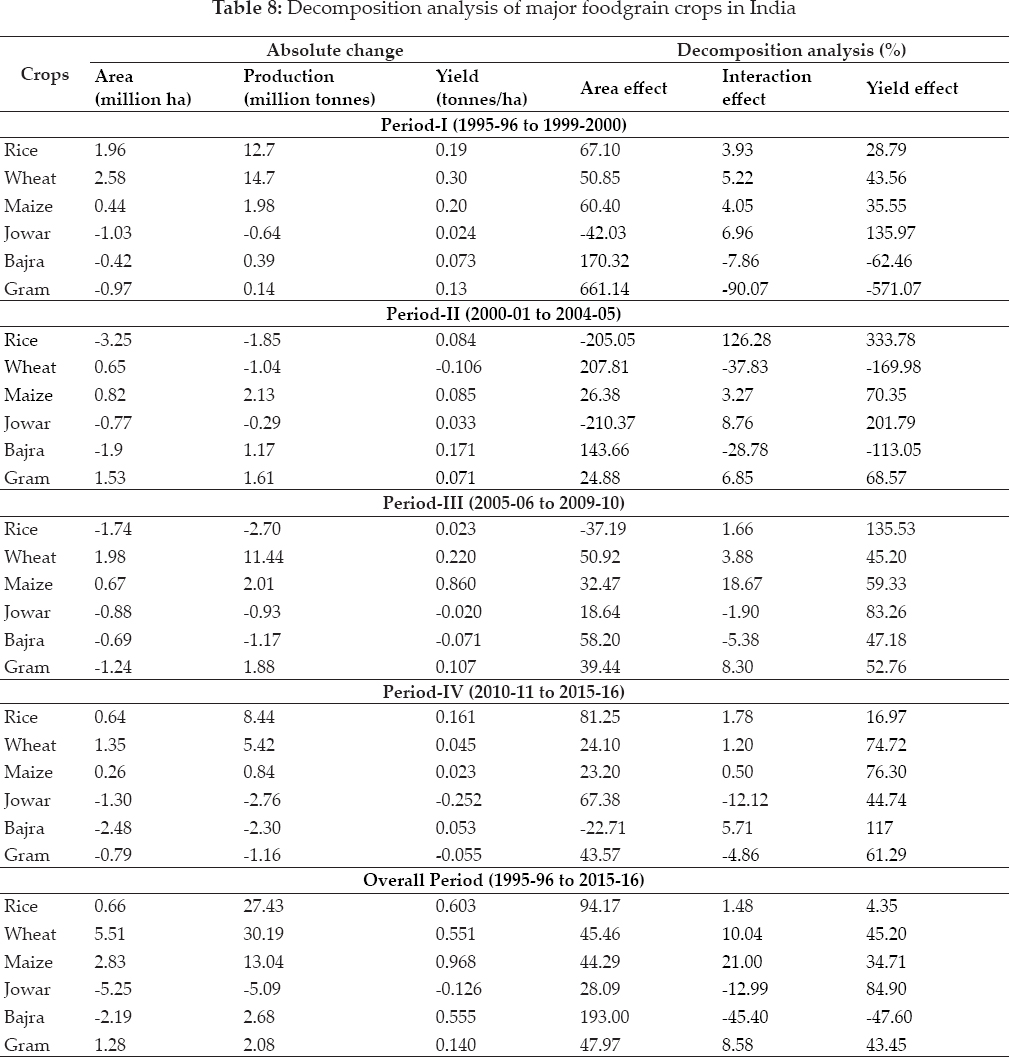
Decomposition analysis
To analyze the contribution of area expansion and yield improvement towards the growth in the production of major foodgrains, decomposition analysis was taken up. Results of the analysis are presented in Table 8. The study of the decomposition analysis helps to reveal the major sources such as area effect, yield effect and their interaction effect that contribute to the change in the production.
In the Period-I (1995-96 to 1999–2000) there was positive change in area in case of rice, wheat and maize,but the change was negative in case of jowar, bajra and gram during the same period. And there was a positive change in production in all crops except jowar and productivity was positive for all the crops under study. Area effect was found more in rice, wheat, maize bajra and gram whereas, jowar yield effect dominated. In Period-II (2000-01 to 2004–05) there was a positive absolute change in production in maize, bajra and gram all which can be attributed to yield effect in case of maize and gram and area effect in bajra. In the period-III (2005-06 to 2009–10) there was a positive absolute change in production in wheat and maize. Area effect was dominant in wheat and bajra whereas, rice, jowar, bajra and gram it was yield effect. In the Period-IV (2010-11 to 2015–16) there was an absolute positive change in rice, wheat and maize production which may be attributed to area effect in case of rice and yield effect in wheat and maize. In case of other crops during the same period there was an absolute negative change in production which can be attributed by interaction effect in jowar and gram and area effect in case of bajra.
In the overall Period from 1995–96 to 2015–16 there was positive absolute change in all the crops in production and productivity except jowar but absolute area change was positive for rice, wheat, maize and gram. Area effect was seen highest in bajra followed by rice, gram, wheat and maize. In case of rice and wheat area effect was more compared to yield and interaction effect.
From the above discussion it can be drawn that the sources of change in production varied in different crops in different periods. Overall there was an increase in area in rice, wheat, maize and gram. As well as production increase in all crops except jowar and this can be attributed to yield improvements. Absolute productivity change was positive for all the crops except jowar under study during overall period.
Trends in Area, Production and Productivity
The trend analysis in area, production and productivity of major food grain crops in India during 1995–2016 has been worked out and depicted in table. There has been significant increase in production and productivity of rice crop. The regression coefficients of production and productivity of rice were significant at one per cent level of significance and R2 being fairly high in case of productivity (table 9). The reason for this increase may be attributed to the availability of good quality seeds of high yielding varieties, expansion of irrigation facilities, uses of recommended doses of chemical fertilizer and relative profitability. Regression coefficient of area, production and productivity of wheat were positive and significant. It shows that there has been significant improvement in area, production and productivity of wheat during the period under study. This improvement in yield can be attributed mainly due to adoption of high yielding varieties of seeds by the farmers, expansion of irrigation facilities and balanced fertigation. In case of maize, the regression coefficient of area, production and productivity were positive and significant. The regression coefficient of jowar crop for area and production was found negative and significant. It showed that in case of jowar, area and production declined during the period under study. Regression coefficient of area of bajra was negative and decline in area was significant. However, in case of production and productivity regression coefficient is positive and significant.
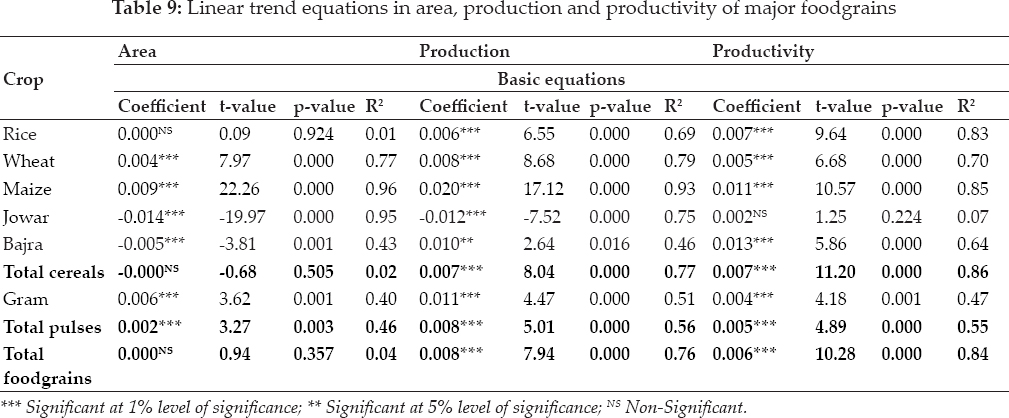
The regression coefficient of total cereals of production and productivity was found positive and significant. The regression coefficient of area, production and productivity of gram was recorded positive and significant. The trend analysis of total pulses also positive and significant. In case of total food grains, the regression coefficient of production and productivity were positive and statistically significant.
CONCLUSIONS
According to the findings of this study, it was concluded that in India there is positive and significant growth rates for production and productivity of all major food grains except jowar. It is found that area under wheat, maize and gram is increased however the area under jowar and bajra is decreased during the study period. The incremental increases in rice and wheat areas have primarily come from reduction in area from coarse cereals i.e. jowar and bajra. It is also found that production of all the food grains except jowar showed satisfactory performance in their production during the overall period (1995-2016). Notably Maize showed increase in area, yield and production during study period which can be due to its increasing demand for industrial usage and had significant growth in the decade due to its growing commercial value with emergence of promising new hybrids. In the overall period of study positive growth rate of area of rice, wheat maize, jowar and gram is associated with positive growth rate of yield. This indicates that one crop is either replacing other crop or is grown in the newly cultivated area and the overall yield of crop is increased. As area growth for food grains is non-significant so it is better to focus on increasing production through productivity by encouraging dissemination of high yielding variety, adequate input supply, transfer of technology and advisory services to the farmers engaged in the cultivation of food grains.
REFERENCES
Agricultural Statistics at Glance. 2017. Directorate of Economics and Statistics, Ministry of Agriculture, Government of India, New Delhi, 2017.
Ahmad, I.M., Samuel, E. Makama, S.A. and Kiresur, V.R. 2015. Trend of Area, Production and Productivity of Major Cereals: India and Nigeria Scenario.
Ankhila, Handral, R., Singh, A., Singh, D.R., Suresh, A. and Jha G.K. 2017. Scenario of Changing Dynamics in Production and Productivity of Major Cereals in India.
Dhanalakshmi, S. 2017. Implications of crop diversification on growth of foodgrains and non-foodgrains production in India.
Dhingra, N. 2015. Yield of Principal Crops in India: Growth and Trends.
Duhan, P.K. 2016. Scenario of Pulses in Haryana and India.
Handral, A.R, Singh, A., Singh, D.R., Suresh, A. and Jha, G.K. 2017. Scenario of changing dynamics in production and productivity of major cereals in India.
Indiastat. 2019.
Janaiah, A., Achoth, L. and Bantilan, C. 2005. Has the green revolution bypassed coarse cereals? The Indian Experience.
Khatkar, B.S., Chaudhary, N. and Dangi, P. 2016. Production and Consumption of Grains: India.
Kumar, P. and Mittal, S. 2006. Agricultural productivity trends in India: Sustainability issues.
Mishra, P., Sahu, P.K., Padmanaban, K., Vishwajith, K.P. and Dhekale, B.S. 2015. Study of instability and forecasting of food grain production in India.
Pathak, A.R., Pithia, M.S., Javia, R.M. and Mehta, D.R. 2017. Challenges and options for meeting the needs of pulses-A review.
Priscilla, L., Balakrishnan, A., Lalrinsangpuii and Chauhan, A.K. 2017. A Study on The Performance of Agricultural Sector in India.