![]()
International Journal of Agriculture, Environment and Biotechnology
Citation: IJAEB: 13(2): 149-153, June 2020
DOI: 10.30954/0974-1712.02.2020.5
BIOTECHNOLOGY
GGE Biplot Based Stability Analysis of Durum Wheat Genotypes Using Statistical Package GGEBiplotGUI
ABSTRACT
The investigation was aimed to identify stable genotypes of durum wheat which can perform consistently under multiple environments. The experiment was conducted in Research Area of CCS Haryana Agricultural University, Hisar during rabi 2015-16. In the present investigation seven released varieties of durum wheat were evaluated on four environments (timely vs late sown, irrigated vs drought) in randomized block design with three replications. Grain yield data was collected from randomly selected five plants of each genotype and used to carry out GGE biplot analysis using the R software and GGEBiplotGUI package. Analysis of variance revealed significant genetic variability among the genotypes. Significant variability was also observed due to both environment and GEI. The four environments were grouped into three major groups. Both irrigated environments were grouped together and were more alike for genotypic comparisons. Genotype WHD 948 was the most stable genotype in all the environments.
Highlights
![]() Significant variability for genotype, environment and their interaction was recorded.
Significant variability for genotype, environment and their interaction was recorded.
![]() Four environments were grouped into two groups.
Four environments were grouped into two groups.
![]() Genotype WHD 948 was found most stable under different environments.
Genotype WHD 948 was found most stable under different environments.
Keywords: GGE biplot, wheat, R software, GGEbiplotGUI, stability
Durum wheat (Triticum durum Desf.) is an important cereal and used for preparations of various food items such as bulgur, macaroni, and cakes. Although this species has less area than bread wheat (T. aestivum) but due to its importance in food industries it is grown all around the world with an annual production of 40 to 50 million tons (Kendal 2019). Demand of wheat is expected to increase in near future due to the increasing population. Plant breeders have always tried to improve the genotypic potential of crops to feed the huge population. But at present various abiotic stresses are causing severe challenges for breeders (Verma et al. 2020). In case of wheat, heat and drought are the major abiotic stresses. Under such situations it becomes necessary to breed genotypes which can tolerate these harsh conditions (Dehghania 2006). In the process of crop improvement, assessment of genotypes under multiple environments is important task. Evaluation of genotypes under different environments become more important under the present situations of climate change where plants are subjected to different stresses during a single growing season. Due to presence of high interaction of genotypes with environments cause change in ranking of genotypes under different environments (Letta et al. 2008; Jalata 2011; Farshadfar et al. 2012). The main problem of this type of evaluation is that data generated from multi environment experiment has multiple dimensions and analysis of this data becomes difficult. Graphical analysis of this type of data makes analysis easier. GGE biplot analysis is one of such techniques which not only help in graphical representation of data but also preserve all the information of the data (Yan et al. 2000). This technique removes irrelevant environment from the data and analyzes the genotype by combining the genotypic variability with genotype x environment interactions (GEI) (Samonte et al. 2005). The main advantage of using this method is that stable genotypes can be identified easily and environments can be divided into groups based on their correlations with each other (Yan and Kang 2003; Yan and Tinker 2006). In recent years the use of this method has increased due to the need to develop varieties for the changing climatic conditions. But still there is lack of information among researchers about how to use this method. During the initial stage of this method a software ‘GGEbiplot’ was developed which was very easy for researchers of biology sciences (Yan 2001). This software although generate good figures but all the features are not available with the trial version. Secondly today researchers are shifting to one easy software R (R Core Team 2016). This software is very easy and freely available to researchers. R contains various statistical packages to carry out different type of analysis. ‘GGEbiplotGuI’ is one of such packages used to analyze the multi-environment data. This package can be used directly to represent data into graphical forms. The present experiment was designed to evaluate durum wheat genotypes under multiple environment conditions. Further only seven genotypes and four environments are evaluated here so that readers can get an idea about how to analyze GGE biplot using this package.
MATERIALS AND METHODS
Experimental material
The present investigation was carried out in Research Area of Wheat and Barley Section, Department of Genetics and Plant Breeding, CCS Haryana Agricultural University. The experiment was conducted during rabi 2015-16. For this experiment randomly selected seven durum genotypes namely; WHD 896, WHD 912, WHD 943, WHD 948, PDW 291, PDW 233, PDW 314 were used.
Environments and experimental design
The genotypes were evaluated under four environmental conditions i.e. timely sown irrigated condition (E1), late sown irrigated condition (E2), timely sown rainfed condition (E3), and late sown rainfed condition (E4). After restricting these conditions other recommended packages and practices were followed throughout the cropping season of wheat. The experiment was conducted in Randomized Block Design (RBD) with three replications.
Data collection and statistical analysis
In the present experiment data was collected from randomly selected five plants from each genotype. Plants were tagged and harvested separately at the time of maturity. Threshing of these plants was done and grain yield of each plant was weighted. The data was then analyzed for the stability of genotypes and grouping of environments based on GGE biplot analysis given by Yan et al. (2000). For the data analysis, R software was used. GGE biplot was generated using statistical package ‘GGEbiplotGUI’. This package can be downloaded in R by using the command ‘install.package(GGEbiplotGUI) and can be loaded for analysis by the command ‘library (GGEbiplotGUI)’. Grain yield of seven genotypes from the above four environments was saved in a comma separated file (.csv) and imported into R studio. After this biplot was generated by a simple command ‘GGEbiplot(data_file)’. Different types of biplots can be generated by using the option ‘biplot analysis’.
RESULTS AND DISCUSSION
Analysis of variance
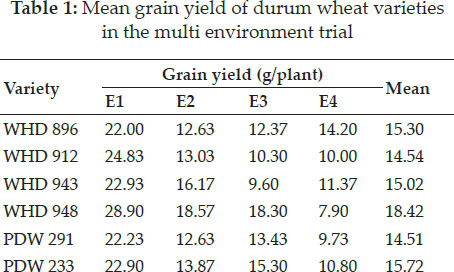
Grain yield in wheat is a complex trait as it has both genotypic and environmental origin (Farshadfar et al. 2013). In the present study it was found that yield of seven durum wheat genotypes varied across environments which proved that environment influenced this trait (Table 1).
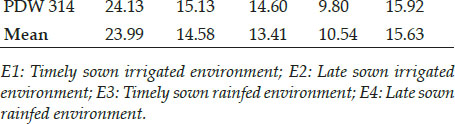
Pooled analysis of yield data for seven durum wheat genotypes from four environments was carried out to partition the total variability into its component parts. Analysis of variance (ANOVA) showed that the studied genotypes were significantly different from each other for grain yield (Table 2). Further highly significant variations were also noticed for environment and genotype × environment interaction (GE). Only 28.10% of variability is caused by genotype itself. It is clear from the table that about 50.48% of variability was caused only by environment itself whereas its interaction with genotype contributed for about 7.38% of variability. It is clear from earlier studies that durum wheat has enough genetic variability for grain yield (Rathwa et al. 2018). Grain yield in wheat is affected by significant influence of environment (Kaya and Akcura 2014). Earlier researchers have also noticed significant interaction of genotypes with environment Solonechnyi et al. (2015). The significant interaction of genotype and environment is the major cause of change in ranking of genotypes under different environments (Matus-Cadiz 2003). This interaction also creates problems while selecting a genotype on the basis of grain yield (Crespo et al. 2017).
Variability explained by GGE biplot
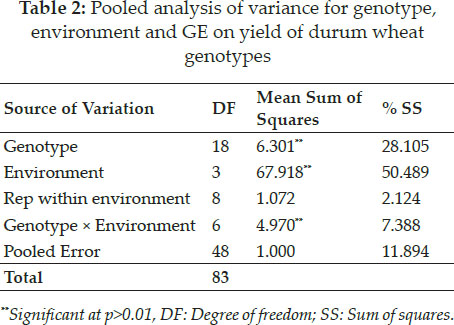
Environmental effect can make the evaluation more confusing. In the present case about 50% of variability was caused due to environment. Under such situation the data was further analyzed for genotype and genotype plus environment interaction (GGE) using the standard procedure of GGE biplot analysis suggested by Yan et al. (2000). In GGE biplot analysis the irrelevant environmental variance is separated from total variance and evaluation of genotypes are carried out only using two parameters viz. genotype and GEI (Yan and Kang 2003). Using this method two major principle components; PC1 and PC2 were calculated which accounted for 71.30% and 17.34% of variability respectively shown on x and y axis of GGE biplot (Fig. 1). The first two principle components accounted for a total of 88.64% of genetic variability for grain yield among these genotypes caused by G+GE interaction. In a similar study first two PCs were used to represent 88.50% of variability caused by GEI (Solonechnyi et al. 2015). When first two PCs can measure maximum variability exploration of other PCs become wasteful (Verma et al. 2020).
Grouping of environments
In our present GGE biplot, green color was used to indicate positions of genotypes on biplot whereas environments were represented by blue color. To get the maximum information from the biplot, black dotted lines were used to represnt origin of biplot and blue dotted lines as environment vectors i.e. line joining the environments to the origin of biplot. The environment vectors were formed by calculating standard deviations of genotypes in a particular environment. Thus, the length of environmental vectors can be utilized in identification of a suitable environment. In the present study, environment E3 had maximum length of environment vector (Fig. 2). Grouping of environments based on GGE biplot is more easy and valuable (Yan 2000).
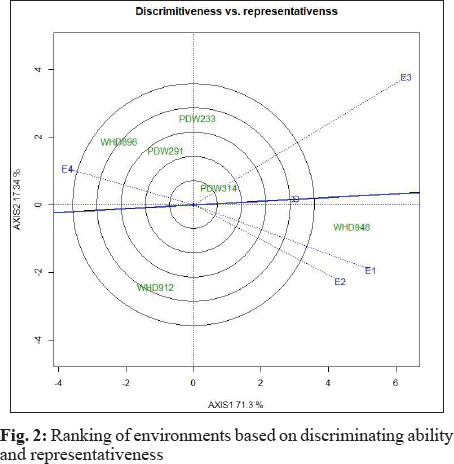
Thus, environment E3 had more discriminating power as genotypes perform differentially in this environment. All other environments had similar environment vectors and thus had same discriminating powers. The other information we get from environment vectors is the correlation between the environments. This correlation is a measure of cosine angular distance between two environment vectors. Larger the angle, lesser will be correlation between the environments and vice versa. In the present case, environment E1 and E2 were highly correlated while others with high angles were less correlated. Thus instead of E1 and E2 we can use either of these environment for future studies as both environments are alike and can give similar results. Another feature of GGE biplot is that environments can be grouped based on average or ideal environment. In Fig. 2, the bold and arrowed blue line was used to represent average environment. This line is called average environment coordinate (AEC) and the angle between this line and a test environment is used to check the reliability power of that test environment (Braun et al. 1996). In present case, environment E4 and E1 had almost equal angle with AEC and had higher discriminating power than other environments. Thus out of these four environments only three environments i.e. E1, E2 and E3 are best and one can drop the fourth environment for genotypic assessment.
Stability of genotypes
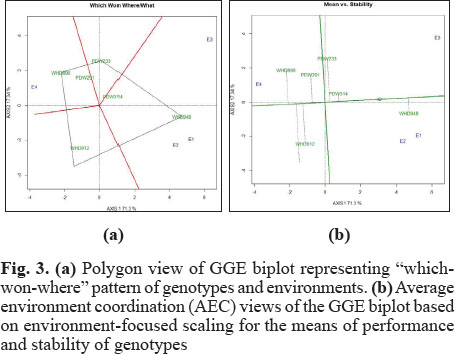
The genotypes WHD 948 was best for three environments viz. E1, E2 and E3 whereas WHD 896 was most suitable for E4 (Fig. 3a). Variability in a genotype and its yield stability can be accessed by locating the genotype on AEC. From Fig. 3, it is clear that genotype WHD 948 is more stable and higher yielder than other genotypes. Genotypes WHD 943, WHD 912 and PDW 233 were situated away from ATC lines and thus varied from one environment to other. In other way we can say that performance of these three genotypes was changing across different environments (Fig. 3b). As GGE biplot can classify the genotypes according to their stability this technique is very useful for plant breeders (Hagos and Abay 2013; Sagar et al. 2014). GGE biplot has been utilized by Solonechnyi et al. (2015) to identify stable genotypes.
CONCLUSION
From this study it can be concluded that GGEbiplotGUI is one of user friendly package in R which can be used to study multiple environment data. Based on correlation matrices four environments can be classified into two groups. This suggests that when there is no difference in irrigation, both normal and late sown environments can be used equally to evaluate the genotypes. Stability of genotype is a major concern for present day agriculture. In our study it is clear that the durum wheat genotype WHD 948 is most stable genotype.
REFERENCES
Braun, H.J., Rajaram, S. and van Ginkel, M. 1996. CIMMYT’s approach to breeding for wide adaptation. Euphytica., 92: 175-183.
Crespo-Herrera, L.A., Crossa, J., Huerta-Espino, J., Autrique, E., Mondal, S. and Velu, G. 2017. Genetic yield gains inCIMMYT’s International Elite Spring Wheat Yield Trials by modeling the genotype x environment interaction. Crop Sci., 57: 789-801.
Dehghania, H., Ebadia, A. and Yousefib, A. 2006. Biplot analysis of genotype by environment interaction for barley yield in Iran. Agron. J., 98: 388-393.
Farshadfar, E., Mohammadi, R., Aghaee, M. and Vaisi, Z. 2012. GGE biplot analysis of genotype × environment interaction in wheat-barley disomic addition lines. Aust. J. of Crop Sci.,6(6): 1074-1079.
Farshadfar, E., Rashidi, M., Jowkar, M. and Zali, H. 2013. GGE biplot analysis of genotype × environment interaction in chickpea genotypes. Eur. J. Exp. Bio.,3(1): 417-423.
Hagos, H.G. and Abay, F. 2013. AMMI and GGE biplot analysis of bread wheat genotypes in the Northern part of Ethiopia. J. Plant Breed Gen., 1(1): 12-18.
Jalata, Z. 2011. GGE-biplot analysis of multi-environment yield trials of barley (HordeumvulgareL.) genotypes in Southeastern Ethiopia highlands. Int. J. Plant Breed Gen., 5(1): 59-75.
Kaya, Y. and Akcura, M. 2014. Effects of genotype and environment on grain yield and quality traits in bread wheat (T. aestivum L.). Food Sci. Technol., 34(2): 386-393.
Kendal, E. 2019. Comparing durum wheat cultivars by genotype x yield x trait and genotype × trait biplot method. Chil. J. Agric. Res., 79(4): 512-522.
Letta, T., D'Egidio, M.G. and Abinasa, M. 2008. Analysis of multi-environment yield trials in durum wheat based on GGE-biplot. J. Food Agric. Environ., 6(2): 217-221.
Matus-Cadiz, M.A., Hucl, P., Perron, C.E. and Tyler, R.T. 2003. Genotype × environment interaction for grain color in hard white spring wheat. Crop Sci., 43: 219-226.
R Core Team 2016. R: A Language and Environment for Statistical Computing. R Foundation for Statistical Computing, Vienna, Austria.
Rathwa, H.K., Pansuriya, A.G., Patel, J.B. and Jalu, R.K. 2018. Genetic Variability, Heritability and Genetic Advance in Durum Wheat (Triticum durum Desf.). Int. J. Curr. Microbiol. App. Sci., 7(01): 1208-1215.
Sagar, V., Yadav, R., Jain, N., Gaikwad, K.B. and Prabhu, K.V. 2014. Consolidating the yield gain by exploiting genotype× management interaction in wheat. Ind. J. GenPl Breed,74(2): 157-165.
Samonte, S.O.P.B., Wilson, L.T., McClung, A.M. and Medley, J.C. 2005. Targeting cultivars onto rice growing environments using AMMI and SREG GGE biplot analysis. Crop Sci.,45: 2414-2424.
Solonechnyi, P., Vasko, N., Naumov, A., Solonechnaya, O., Vazhenina, O., Bondareva, O. and Logvinenko, Y. 2015. GGE biplotanalysis of genotype by environment interaction of spring barley varieties. Zemdirbyste- Agriculture,102(4): 431-436.
Verma, A., Crossa, J., Vargas, M., Joshi, A.K. and Singh, G.P. 2020. Adaptability Measures for Wheat Genotypes Evaluated under Northern Hills Zone of Country for Irrigated Timely Sown Conditions. IJAEB, 13(1): 01-12.
Yan, W. 2001. GGEbiplot-a windows application for graphical analysis of multi-environment trial data and other types of two-way data. Agron. J.,93: 1111-1118.
Yan, W., Hunt, L.A., Sheny, Q. and Szlavnics, Z. 2000. Cultivar evaluation and mega-environment investigation based on the GGE biplot. Crop Sci.,40: 597-605.
Yan, W. and Kang, M.S. 2003. GGE biplot analysis: a graphical tool for breeders, geneticists and agronomists. Taylor & Francis.
Yan, W. and Tinker, N.A. 2006. Biplot analysis of multienvironment trial data: principles and applications. Can. Plant Sci., 86: 623-645.