INTRODUCTION
In the United States, approximately 200,000 people live with RCC annually (Cairns, 2011). The mortality rates of these patients are 19%, 26%, 47%, and 92% for stages 1, 2, 3, and 4, respectively, indicating the need for early detection (Cairns, 2011). Those with metastatic RCC (pT4) have a median survival of around 13 months and a 5-year survival rate of under 10% (Cairns, 2011). RCC is a malignant cancer of the kidneys with numerous subtypes: Clear cell, collecting duct, chromophobe, mucinous tubular, multicellular, papillary, and renal medullary. The cancer is created from many specialized cells located along the nephron, the basic structure of the kidney. Only 2–4% of RCC in patients have hereditary causes, but a mutation in one or more of the following tumor suppressor genes – von Hippel-Lindau, fumarate hydratase, folliculin, and succinate dehydrogenase genes – which stops the cells from proliferating excessively and becoming cancer, has been found to increase the likelihood of a person to develop RCC (Martinez et al., 2000). The treatment options for patients are usually nephrectomy surgeries. If the cancer progresses too far, both kidneys may have to be removed, necessitating a kidney transplant (National Cancer Institute, 2019).
In the UK in 2014, almost half of cancer patients were diagnosed too late, reducing the likelihood of their treatment success, and increasing the mortality of treatable cancers (Campbell, 2014). Late diagnosis is caused by an array of factors: The expense of tumor detection machines and the inefficiency of doctor diagnosis to name a few. After diagnosis, treatment options usually require invasive surgeries and scans, intimidating patients even further (Arruebo et al., 2011). Even with imaging, many early RCCs are not accurately distinguishable from other non-malignant renal lesions (American Cancer Society, 2019). Thus, a non-invasive cancer detection technology is needed. Research into biomarkers can be a promising avenue of developing early cancer diagnosis with a non-invasive analysis of patients’ blood.
A common biomarker for cancers and other diseases is microRNA: Non-coding, tiny RNAs that target messenger RNAs to regulate gene expression. They are transcribed from DNA sequences and do not code for protein like other RNAs; instead, they engage with target RNAs to suppress protein expression, create overexpression of certain specific genes, or act signaling molecules to mediate cell communications (O’brien et al., 2018). The dysfunction of microRNAs manifested by altered microRNA concentrations is commonly present in either the tissue, blood, urine, or cerebrospinal fluid of disease-ridden patients (Moldovan et al., 2014). Malignant changes happen when mutations occur in genes, in which the oncogenes are activated, and tumor suppressor genes are inactivated. In microRNAs, overexpression leads to reducing oncogene expression and vice versa (Paranjape et al., 2009). Proto-oncogenes are genes that typically help cells grow. However, in a situation where further copies of proto-oncogene mutations are created, a gene can be permanently activated. This corrupted gene, which is always activated, causes a non-stop proliferation of cancer cells (American Cancer Society, 2019). Cancers are also believed to be created or able to grow by evading the process of apoptosis – programmed cell death that most cells undergo. Misregulation of microRNA can lead to the inactivation of tumor suppressor genes responsible for apoptosis and assists the proliferation of cells until the cancer is formed (American Cancer Society, 2019). Dysregulation of the microRNAs responsible for the inactivation of tumor suppressor genes and activation of oncogenes is an indicator for most types of cancer. However, it is not the only source of misregulation of genes that may cause cancer. Other issues include transcriptional misregulation, where the gene is unable to convert DNA to RNA correctly, leading to failed gene activity. This is a consideration while analyzing the role of microRNAs in cancers.
A statistical analysis of a dataset of cancer microRNAs was classified with random forests and support vector machine algorithms by Rehman et al. (2019). Since many microRNAs affect the subtype and outcome of cancer, ML was chosen as a suitable method to sort through the data (Strimbu and Travel, 2010). It concluded that ML could validate 12 experimentally determined microRNA biomarkers of breast cancer. Zakrzewska et al. (2019) used RWeka with decision tree-based models to reveal altered microRNA expression patterns in neuronal-glial tumors. A random forest algorithm identified novel diagnostic markers for soft-tissue sarcoma that distinguished between synovial sarcoma and malignant peripheral nerve sheath tumor using gene expression data from the Genotype-Tissue Expression project and the French Sarcoma Group (van IJzendoorn et al., 2019).
In RCC, miR-17-5p and miR-224 both target hypoxia-inducible factor 1a and Von Hippel-Landau (VHL) protein. These proteins are lost in approximately 70% of all RCCs, which may lead to an over-proliferation of nephrons and cancer (Al-Ali et al., 2012). In addition, miR-106b, miR-1233, miR-1290, miR-210, miR-7-1, miR-320b, and miR-93 were all selected microRNAs that were highly differentially expressed in RCC by looking through microRNA profiles (Fedorko et al., 2016). Bhowmick et al. (2018) utilized the Cancer Genome Atlas database, including 255 instances with renal clear cell carcinoma, to use ML to compile sets of possible microRNAs that often occur in various cancerous samples. Ten microRNAs were found to be most indicative of classification accuracy; they are possible biomarkers of RCC of clear cell subtype. Thirty-five discriminative microRNAs for the subtypes of RCC were found using data from the Cancer Atlas Genome project (Ali et al., 2018).
Previous research did not compare healthy and cancerous samples or tissue and blood microRNAs to find discriminative biomarkers of any subtype of RCC. This investigation hopes to use healthy and cancerous samples from all subtypes of RCC, differentiating between tissue and blood microRNAs, to build classification models that reveal discriminative microRNAs; those that overlap between tissue and blood models will be evaluated as potential new biomarkers. Clear cell, papillary, and chromophore are the subtypes being investigated because they are the most common (Cairns, 2011).
The Waikato Environment for Knowledge Analysis (Weka) interface will be used because it facilitates both dataset and algorithm exploration (Witten et al., 2016). A dataset specific to RCC was pulled from the Gene Expression Omnibus and the Cancer Genome Atlas. It has 18 data instances of microRNAs associated with chromophore RCC, 243 data instances of microRNAs for clear cell RCC, and 77 data instances of microRNAs for papillary RCC. Instances in these cases correspond to microRNAs, not the individual patient, so they will be reorganized to have microRNAs as attributes normalized to reads per million and with the instances characterized by patient id. All these databases have microRNA comparing cancerous tissue to normal tissue. However, they include other metal profiling such as high-grade versus low grade, metastasis, poor versus good outcome, and blood profiling. This can be used to describe the microRNA profiles of cancer patients (Luan et al., 2016). Following the successful classification of possible microRNA biomarkers, the mirTarBase database will be used to determine the gene targets of the microRNA biomarkers.
MATERIALS AND METHODS
Isoform microRNA expression values were downloaded from the Gene Expression Omnibus, submitted by Wach et al. (2013), and last updated in 2017. It includes data from two of the major subtypes, clear cell and papillary. These two subtypes represent approximately 90% of all RCC cases. The entire data set had 7815 microRNAs as features and a total of 29,690 instances. The data were exported to excel and reformatted to classify the RCC subtype as either cancerous or healthy.
This process was repeated for each sample and added to the same data table. Missing values were substituted by the average expression for that attribute in the healthy or cancerous class. The dataset was converted into an AIFF file to be placed in Weka. Overfitting was avoided by cross-validation. This ensures that the software is not running the algorithm through the entire dataset until the model is complete. The algorithm is always unfamiliar with the testing data until it runs. Ten-fold is the standard because it creates enough splits to avoid familiarity. Four is the minimum number of folds that ensure some variance in a smaller dataset. Too many splits can lower the number of sample combinations in each fold and interfere with the algorithm’s accuracy. Since the dataset had a limited number of samples, 4-fold cross-validation was used to achieve variance and accuracy.
Six preliminary algorithms were run through the dataset with no feature selection as a baseline for results in Weka. Three feature selection techniques were tested as wrappers with each algorithm, and the best feature selection method was selected as Best First Attribute Selector (BFAS). This information is explained in the results section. BFAS is an information gain feature selection technique in which an optimization algorithm searches the space of attribute subsets by greedy hill-climbing, building a solution by constantly looking at the next attribute that offers the greatest and most immediate benefit iteratively and incrementally – augmented with a backtracking facility. This evaluates the added attribute’s benefit compared to the original one and removes it if it is detrimental. This feature selection technique was evaluated by CfsSubsetEval, which evaluates the worth of a subset of attributes by considering each feature’s individual predictive ability and the degree of redundancy between them. With this feature selection technique, a panel of 52 microRNAs was generated for the model.
Using BFAS, the top algorithms with the highest original accuracies were considered most suitable for the data: Unpruned J48 decision tree and Hoeffding tree. It is important to note that the name of the J48 decision tree varies; Weka labeled it as such (it is otherwise referred to as a C4.5 decision tree classifier). The Hoeffding tree algorithm is an incremental type of decision tree in which a new node is built from an attribute based on its value the Hoeffding bound equation (Bifet and Gavalda, 2013). The unpruned J48 algorithm is a standard decision tree that creates a node based on its mathematical benefit to the classification accuracy (Bhargava et al., 2013). The AUC-ROC, the area underneath the curve of receiver operating characteristics, is a performance metric created by taking the integral of a probability curve plotted against a model’s false-positive rate and measuring how well a model can distinguish between classes. The AUC-PRC, or the area underneath the recall curve, is a performance metric created from taking the integral of a curve of precision values plotted against recall value and represented the models’ tradeoff between precision and recall. A great model has an AUC-ROC and AUC-PRC value closer to 1, and a weak model has an AUC-ROC and AUC-PRC closer to 0. Both methods are used as performance metrics as they distinguish between classes by measuring separability. By depicting this distinction, it provides insight into how accurately and effectively the model works. Zheng et al. (2020) used an AUC-ROC on a microRNA data sample to demonstrate and compare the performance of the two models. The information gained from these metrics provided insight into the overall performance of the models. The models were compared to find the accuracy, precision, recall, AUC-ROC, and AUC-PRC in cancer prognosis.
RESULTS AND DISCUSSION
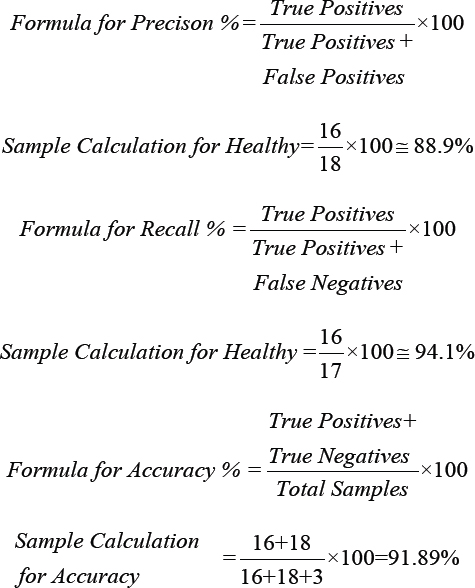
Equations for precision, recall, and accuracy:
***AUC−ROC and AUC−PRC were generated from Weka
It is important to note that there was only one accuracy value for each model because accuracy is a measure of the model successfully predicting both healthy and RCC samples. Table 7, which showed the performance metrics for healthy versus cancerous classification with a Random Forest Algorithm, also had an accuracy of 91.892%, but the model was not deemed as an appropriate one due to its large size and tendency to overfit with the small sample size.
The unpruned J48 tree is less convoluted than the Hoeffding tree. It includes fewer nodes or pathways taken. An unpruned J48 decision tree was chosen over a pruned J48 decision tree because pruning is used to reduce the size of a tree and may lead to overfitting; since the unpruned J48 decision tree is relatively small, with two nodes as shown in Figure 1, there was no reason to try cutting the tree’s size down and risk overfitting a model of a small sample size that is already prone to overfitting. The J48 is an efficient algorithm because it can complete the task with few nodes.
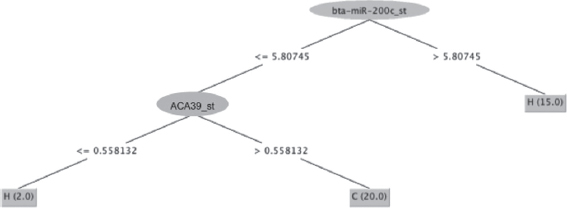
Figure 1: J-48 decision tree visualization: “H” indicates a healthy classification and “C” indicates a cancerous classification
Precision is the measure of true positives overall samples classified as positive. In Table 8, the precision for the unpruned J48 decision tree with BFAS was 93.8% for healthy classification and 90.5% for cancerous classification so that the model can be evaluated as moderately precise on the testing data. The recall is the measure of true positives overall actual positives. While the recall of 88.2% for healthy classification is not considered vital, the 95% recall for cancerous classification is considered very strong. The correct diagnosis of cancer patients is weighted more heavily than the correct diagnosis of healthy patients when evaluating the model’s performance as desired.
Again, the ability for the model to diagnose cancerous patients is slightly more important than the ability to diagnose healthy patients, so the 0.929 AUC-PRC value for cancerous classification in Table 8 is indicative of a strong model.
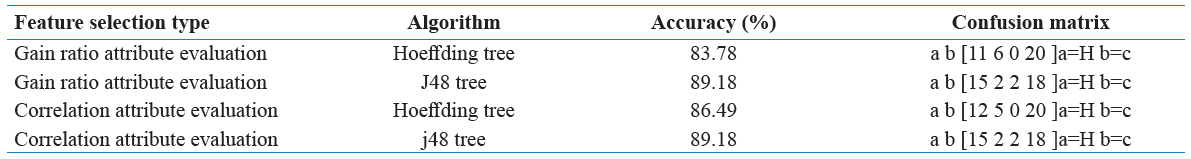
Table 1 represents a subsection of the final edited data set as a reference point. Tables 2 through 6 contain various combinations of performance metrics of the algorithms. Table 2 has a relatively low performance metric as well as Table 4 and Table 6. In comparison, Table 3 and Table 5 were able to establish an accuracy of above 80%, but this was still not considered strong enough. Finally, while the accuracy value for Table 9 is extremely strong in respect to this research, it is still weaker than Table 7 and Table 8, thus it was not selected. Below is Table 10, a representation of the confusion matrix of each of the following algorithms with either gain ratio attribute evaluation or correlation attribute evaluation. This information provides insight into the false positive, false negative, true positive, and true negative presence in each model.
Table 1: Small section of the final dataset used – labeled as healthy or cancerous samples
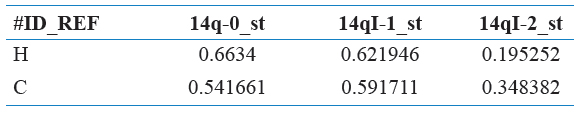
Table 2: Performance metrics of healthy versus RCC with JRip algorithm
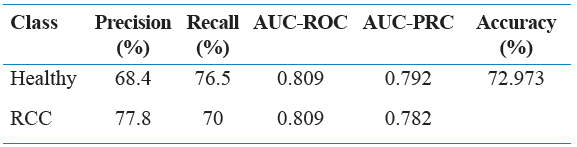
Table 3: Performance metrics by healthy versus RCC with SMO algorithm
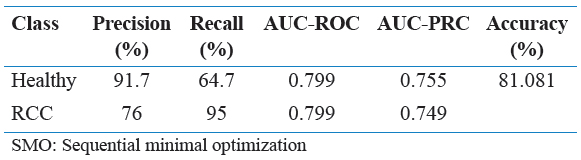
Table 4: Performance metrics by healthy versus RCC with Ibk algorithm
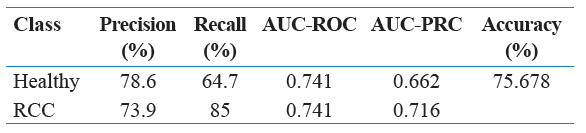
Table 5: Performance metrics by healthy versus RCC with J48 algorithm
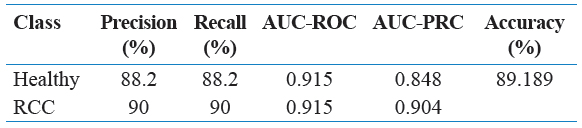
Table 6: Performance metrics by healthy versus RCC with Hoeffding Tree algorithm
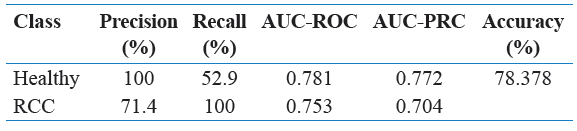
Table 7: Performance metrics by healthy versus RCC with Random Forest Algorithm
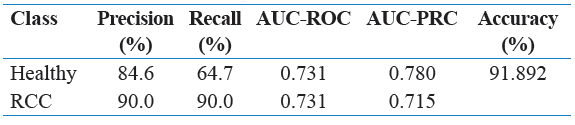
Table 8: Performance metrics by healthy versus RCC with Best First Attribute Selection and J48 algorithm
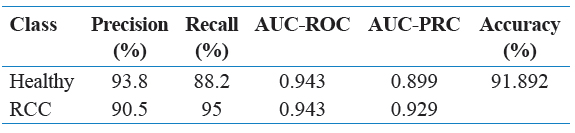
Table 9: Performance metrics by healthy versus RCC with Best First Attribute Selection and Hoeffding Tree algorithm
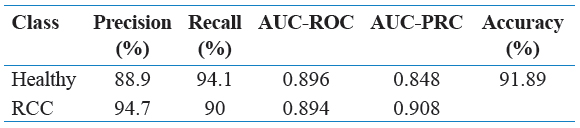
Table 10: Performance metrics by healthy versus RCC with various feature selections
As seen above, Figure 2 represents the raw unedited data taken directly from the source with no changes made. In comparison, Figure 3 is that very source that was entered into excel. As the file size for both are quite large, only a small subsection was added.
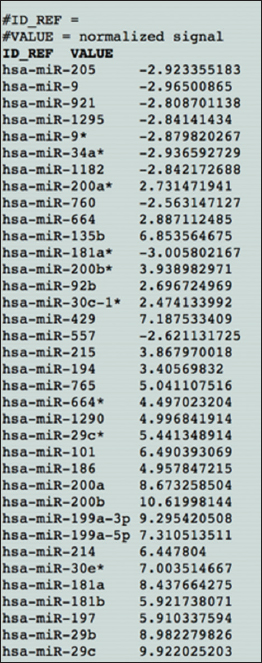
Figure 2: The raw data set – unedited
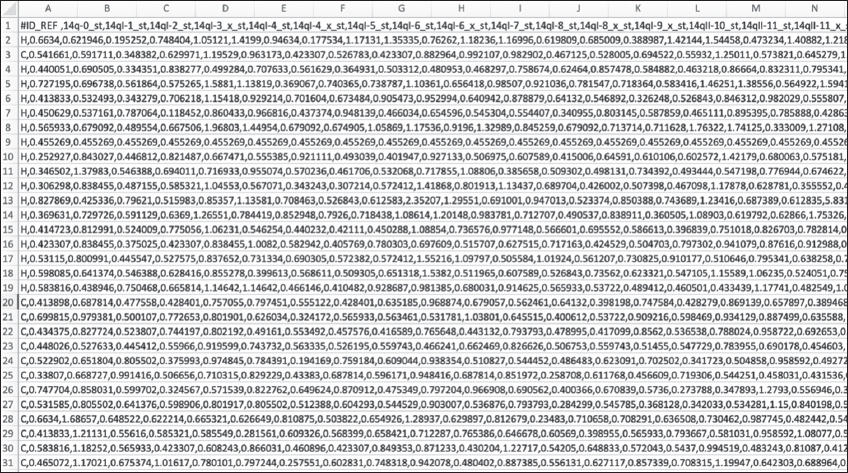
Figure 3: Small subsection of the data classified as healthy versus cancerous
The lower AUC-PRC value for healthy classification indicated that the Hoeffding tree was not as good of a model as the J48 model. Overall, significant evidence suggests that both models are strong enough to classify between healthy and cancerous samples in the RCC dataset. Specifically, both trees used the same two microRNAs as the critical features in their trees.
In addition, ACA39_st, abridged labeling of microRNA, was a significant feature used in both models that may be a novel biomarker that has not been recorded in literature. This is a variant of a microRNA coding linked to acetyl CoA, which is a protein primarily responsible for lipid metabolism. A properly functioning kidney must be able to metabolize lipid binding proteins well. In addition, improper lipid metabolism, and subsequent lipid accumulation, in the kidney has been a hallmark of the clear cell subtype of RCC (Sanchez and Simon, 2018). Thus, there is some reasoning to believe a microRNA associated with acetyl CoA and the microRNA ACA39_st would play RCC. These results show a possible significant novel biomarker for RCC. A novel microRNA biomarker for RCC can open the door for cheap and efficient early detection of cancer, increasing the chance of survival. The role of acetyl CoA (ACA39_st) is not clear; there is a need for future research that investigates the link between ACA39_st and RCC as a potential biomarker.
CONCLUSION
Zakrzewska et al. (2019) determined that the feature selected to give a model’s highest predictive ability may predict the patient’s disease or cancer. Thus, the microRNAs chosen as the nodes in the J48 model, bta-miR-200c_st and ACA39_st suspected to be highly predictive of RCC diagnosis. While the Hoeffding tree cannot be visualized, it uses all the 52 microRNAs in the preselected panel of features to build the tree, including bta-miR-200c_st and ACA39_st. The role of miR-200c in RCC has been supported in the past. Nakada et al. (2008) found significant downregulation of microRNAs miR141 and miR-200c in RCC profiling.
ACKNOWLEDGMENTS
We would like to acknowledge the help of Dr. Julie Sohl and Mr. Duke Writer with our deepest gratitude. They provided foundational support across multiple aspects of this research. Thank you to Mr. Sundaram Thirukkurungudi for aiding us in the revisions of this paper. Furthermore, we would like to thank the Academies of Loudoun for providing us with the facilities and opportunity to conduct our research.
FINANCIAL SUPPORT AND SPONSORSHIP
No additional financial support other than instructional funding from the Academies of Loudoun was received.
CONFLICTS OF INTEREST
The authors and the people listed in the acknowledgments did not have any conflicts of interest with this research.
REFERENCES
1. Al-Ali, B.M., Ress, A.L., Gerger, A. and Pichler, M. 2012. MicroRNAs in renal cell carcinoma:Implications for pathogenesis, diagnosis, prognosis and therapy.
2. Anon. 2014. Oncogenes and Tumor Suppressor Genes. American Cancer Society. Available from:https://www.cancer.org/cancer/cancer-causes/genetics/genes-and-cancer/oncogenes-tumor-suppressor-genes.html. [Last accessed on 2021 Jan 28].
3. Anon. 2018. Key Statistics About Kidney Cancer. American Cancer Society. Available from:https://www.cancer.org/cancer/kidney-cancer/about/key-statistics.html. [Last accessed on 2021 Jan 28].
4. Anon. 2019. Renal Cell Cancer Treatment (PDQ®)-Patient Version. National Cancer Institute. Available from:https://www.cancer.gov/types/kidney/patient/kidney-treatment-pdq. [Last accessed on 2021 Jan 28].
5. Arruebo, M., Vilaboa, N., Sáez-Gutierrez, B., Lambea, J., Tres, A., Valladares, M. and González-Fernández, Á. 2011. Assessment of the evolution of cancer treatment therapies.
6. Bhargava, N., Sharma, G., Bhargava, R. and Mathuria, M. 2013. Decision tree analysis on j48 algorithm for data mining.
7. Bhowmick, S.S., Saha, I., Bhattacharjee, D., Genovese, L.M. and Geraci, F. 2018. Genome-wide analysis of NGS data to compile cancer-specific panels of miRNA biomarkers.
8. Bifet, A. and Gavalda, R. 2009, August. Adaptive learning from evolving data streams. In:International Symposium on Intelligent Data Analysis. Springer, Berlin, Heidelberg. pp. 249-260.
9. Cairns, P. 2011. Renal cell carcinoma.
10. Campbell, D. 2014. Almost Half of Cancer Patients Diagnosed Too Late, The Guardian. Available from:https://www.theguardian.com/society/2014/sep/22/cancer-late-diagnosis-half-patients. [Last accessed on 2021 Jan 29].
11. Chang, I., Mitsui, Y., Fukuhara, S., Gill, A., Wong, D.K., Yamamura, S., Shahryari, V., Tabatabai, Z.L., Dahiya, R., Shin, D.M. and Tanaka, Y. 2015. Loss of miR-200c up-regulates CYP1B1 and confers docetaxel resistance in renal cell carcinoma.
12. Fedorko, M., Pacik, D., Wasserbauer, R., Juracek, J., Varga, G., Ghazal, M. and Nussir, M.I. 2016. MicroRNAs in the pathogenesis of renal cell carcinoma and their diagnostic and prognostic utility as cancer biomarkers.
13. Luan, J., Wang, J., Su, Q., Chen, X., Jiang, G. and Xu, X. 2016. Meta-analysis of the differentially expressed microRNA profiles in nasopharyngeal carcinoma.
14. Martinez, A., Fullwood, P., Kondo, K., Kishida, T., Yao, M., Maher, E.R. and Latif, F. 2000. Role of chromosome 3p12-p21 tumour suppressor genes in clear cell renal cell carcinoma:Analysis of VHL dependent and VHL independent pathways of tumorigenesis.
15. Morii, K., Yamasaki, S., Doi, S., Irifuku, T., Sasaki, K., Doi, T., Nakashima, A., Arihiro, K. and Masaki, T. 2019. microRNA-200c regulates KLOTHO expression in human kidney cells under oxidative stress.
16. Moldovan, L., Batte, K.E., Trgovcich, J., Wisler, J., Marsh, C.B. and Piper, M. 2014. Methodological challenges in utilizing mi RNA s as circulating biomarkers.
17. Muhamed Ali, A., Zhuang, H., Ibrahim, A., Rehman, O., Huang, M. and Wu, A. 2018. A machine learning approach for the classification of kidney cancer subtypes using miRNA genome data.
18. Nakada, C., Matsuura, K., Tsukamoto, Y., Tanigawa, M., Yoshimoto, T., Narimatsu, T., Nguyen, L.T., Hijiya, N., Uchida, T., Sato, F. and Mimata, H. 2008. Genome-wide microRNA expression profiling in renal cell carcinoma:Significant down-regulation of miR-141 and miR-200c.
19. O'Brien, J., Hayder, H., Zayed, Y. and Peng, C., 2018. Overview of microRNA biogenesis, mechanisms of actions, and circulation.
20. Paranjape, T., Slack, F.J. and Weidhaas, J.B. 2009. MicroRNAs:Tools for cancer diagnostics.
21. Rehman, O., Zhuang, H., Muhamed Ali, A., Ibrahim, A. and Li, Z. 2019. Validation of miRNAs as breast cancer biomarkers with a machine learning approach.
22. Sanchez, D.J. and Simon, M.C. 2018. Genetic and metabolic hallmarks of clear cell renal cell carcinoma.
23. Strimbu, K. and Tavel, J.A. 2010. What are biomarkers?
24. van IJzendoorn, D.G., Szuhai, K., Briaire-de Bruijn, I.H., Kostine, M., Kuijjer, M.L. and Bovée, J.V. 2019. Machine learning analysis of gene expression data reveals novel diagnostic and prognostic biomarkers and identifies therapeutic targets for soft tissue sarcomas.
25. Wach, S., Nolte, E., Theil, A., Stöhr, C., Rau, T.T., Hartmann, A., Ekici, A., Keck, B., Taubert, H. and Wullich, B. 2013. MicroRNA profiles classify papillary renal cell carcinoma subtypes.
26. Witten, I.H., Frank, E., Hall, M.A. and Pal, C.J. 2005. Practical Machine Learning Tools and Techniques. Vol. 578. Morgan Kaufmann, United States. 1.
27. Zakrzewska, M., Gruszka, R., Stawiski, K., Fendler, W., Kordacka, J., Grajkowska, W., Daszkiewicz, P., Liberski, P.P. and Zakrzewski, K. 2019. Expression-based decision tree model reveals distinct microRNA expression pattern in pediatric neuronal and mixed neuronal-glial tumors.
28. Zheng, X., Fu, X., Wang, K. and Wang, M. 2020. Deep neural networks for human microRNA precursor detection.