
Economic Affairs, Vol. 65, No. 2, pp. 267-274, June 2020
DOI: 10.46852/0424-2513.2.2020.20
Impact of Agricultural Price Policy on Major Food Crops in Haryana
ABSTRACT
The present study aimed to analyze the impact of Agricultural Price Policy on major food crops in Haryana. The Secondary data on Farm Harvest Prices (FHP) and Minimum Support Prices (MSP) of major food crops were collected from Statistical Abstract of Haryana, Directorate of Marketing and Inspection and Commission for Agricultural Cost and Prices for the period 2007-08 to 2017-18. The effectiveness of the price policy during the harvest periods was examined by the deviations of FHP from MSP and classified into positive and negative deviations (to examine whether market prices ruled higher or lower than the minimum support prices). Gap between FHP and MSP resulted that in mostly cases FHP is higher than MSP because higher demand due to more procurement for central part than supplies does not allow the market prices to fall below MSP. In recent years, market prices ruled higher than MSP. The impact of MSP on area is higher but there is non-significant impact of MSP on productivity of food crops. The study revealed that there is significant variation in areas of food crops due to previous year's minimum support prices of the food crops but there is non-significant variation in productivity of food crops.
Highlights
 FHP is higher than MSP of food crops. Impact of MSP is significant on area due to previous year's MSP and non significant on Productivity.
Keywords: Farm Harvest Price, Minimum Support Price, Agricultural Price Policy
INTRODUCTION: In developing countries, where agriculture is very important, the Agricultural prices occupy a lead position in the price structure. The study of price behaviour is a crucial requisite of any sound price policy. Agricultural Price Policy and price support system have come under academic scrutiny due to the recent changes towards liberalization of the Indian economy (Sudhakar & Wale, 2017). As agriculture becomes more market oriented and marketable surplus increases, changes in relative prices of different farm products affect the acreage that .a farmer would like to put under each crop which in turn would also affect the level of production .of different enterprises. Any agricultural policy analysis needs to deal with the problems or factors influencing demand of the agricultural output. The very important decisions in agricultural production such as how do farmers .decide what to produce and how much to produce? What policy instruments and other factors .influence their decisions regarding acreage allocation .under different crops must be understood so as to construct a sound and successful .agricultural policy. The conclusion of supply in agriculture are likely to be made on the knowledge relating to technical co-efficient, prices of inputs and output. The MSP is fixed by government before sowing season, but awareness level among farmer is very low. Hence this study focuses on the method of estimating MSP based on 2018 Budget proposed by the government whiz “at least 50 per cent more than the weighted average cost of the production. A portal would be developed to create awareness among the farmers. (Jain et al. 2018).
How to cite this article: Ritu, Mehta, V.P., Malik, D.P., Kumar, R. and Nisha (2020). Impact of agricultural price policy on major food crops in Haryana. Economic Affairs, 65(2): 267-274.
Source of Support: None; Conflict of Interest: None
Minimum Support Price (MSP) is a fundamental component of Agricultural Price Policy of India. It targets to corroborate support price to farmers and reasonable prices to consumers through Public Distribution System (PDS) (Parikh & Singh 2007). The price support system was conceptualized during pre-green revolution .period as an governmental mechanism for incentivizing farmers to acclimatize new technologies.(Planning Commission 2005; Deshpande 2008). Later, Agriculture Price Commission (APC) was established in the year 1965, based on Jha committee recommendations to recommend support prices for crops after considering the cost of cultivation (Kadasiddappa et al. 2013). It was reflected in the revised terms of reference of Agricultural Prices Commission (which was later renamed as Commission for Agricultural Costs and Prices) with a shift from maximizing the production to developing a production pattern regular with the overall needs of the economy (Acharya, 1997). The Commission for Agricultural Costs and Prices (CACP) recommends Minimum Support Price (MSP) for.26 agriculture crops i.e. cereals (paddy, wheat and ragi), coarse cereals (barley, jowar, bajra and maize),.pulses (gram, arhar/ tur, moong, urad and lentil), oilseeds.(groundnut, rapeseed/mustard,.toria, soyabean, sunflower seed, sesame,. safflower seed and niger seed), raw cotton, raw jute, copra, de-husked coconut, sugarcane, VFC tobacco. Broad objectives of the Agriculture Price Commission (APC).are to ensure remunerative prices to farmers and affordable prices to consumers and promote sustainable use of all resources towards socially desirable crop mix (Parikh & Singh 2007). The worse situation of the price policy as far as concerned with the area allocation under gram crop because the area has been decreasing in spite of providing more prices for the crop (Godara & Poonia, 2013).
Price incentives in the form of minimum support prices helped India to increase food production during green revolution period. Minimum Support Prices (MSP) also aims at procuring food grains from food surplus states for distribution through Public Distribution System and maintaining buffer stock and thus fulfil the demand supply gap (Jha & Srinivasan 2006; Chand 2008). Price incentives in the form of MSP are credited for the increase in area under wheat and rice in the green revolution states like Haryana and Punjab. Also, the Agricultural price policy is considered to have favoured food crops more than the other crops. As a result, a large mass of good quality and was shifted from oilseeds, pulses and other important crops to paddy and wheat crops, creating a serious imbalance in the demand and supply of many other agricultural commodities.(Chand, 2008). In other regions of the country due to small marketable surpluses, the Agricultural price policy .is considered to be ineffective as the government has less interest in procurement operations. So, it is argued that the market prices for wheat and paddy crop rule lower than the Minimum Support Price (MSP) in these are as during post-harvest period and shoot up during the lean periods, which is usually not the case in the surplus producing regions (ADRT, 2003). In recent years, the Minimum Support Price (MSP) policy has been criticized by both farmers and proponents of free trade. The heavy subsidisation of agricultural exports by developed countries due to WTO obligations, the situation is fast changing. Since international agricultural prices have become lower than the Indian agricultural prices, farmers in the state have been put to a serious disadvantage (Debashis Sarkar, 2011).
MATERIALS AND METHODS
Selection of crops
The major food crops i.e. wheat, rice, bajra, barley, gram, maize, rapeseed/ mustard were selected purposively for the study. The present study was primarily based on secondary data collected from Statistical Abstract of Haryana, Directorate of Marketing and Inspection (DMI), Ministry of Agriculture and Farmers Welfare Government of India (Faridabad), CACP, other published and unpublished sources. The yearly time series data on prices of major food crops were collected for Haryana state covering period from 2007-08 to 2017-2018.
Analytical Tools and Techniques
Gap between FHP and MSP of major food crops in Haryana:
The study is based on the secondary data on farm harvest prices and minimum support prices of major food crops in Haryana state. Based on the data availability, the time period chosen was 2007-08 to 2017-18. To study the effectiveness of the price policy during the harvest. periods, the deviations of Farm Harvest. Prices (FHP) from the Minimum Support Prices (MSP) were worked out and divided into positive and negative deviations to examine whether market prices ruled higher or lower over the minimum support prices. The negative deviations reflected ineffectiveness of MSP policy for producers. The formulae used for the mean absolute negative./ positive deviation was as follows:
MAPD or MAND = 1/n Σ |FHP. - MSP|
If, FHP > MSP = Positive deviation (PD) FHP < MSP = Negative deviation (ND)
Where, MAPD. = Mean absolute positive deviation,
MAND. = Mean absolute negative deviation,
FHP. = Farm harvest price,
MSP. = Minimum support price, and
n = Frequency of positive or negative deviations.
These deviations were adjusted with MSP in order to examine the degree of their deviation from the MSP. The formulae used for the adjusted mean negative./positive deviation was as follows:
AMPD or AMND = 1/n Σ( IFHP.- MSP. I / MSP.)*100
Where,
AMPD. = Adjusted mean positive deviation, and
AMND. = Adjusted mean negative deviation
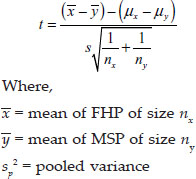
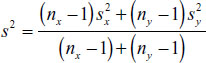
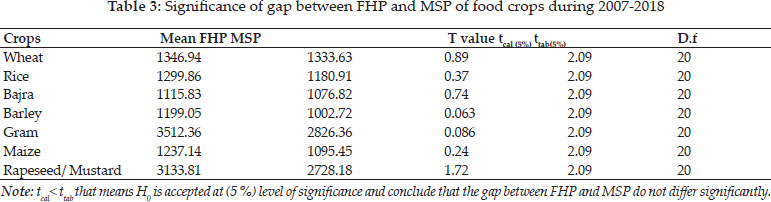
The significance of gap between FHP and MSP of food crops was tested by two sample t test.
Impact of Minimum Support Prices (MSPs) on major food crops in Haryana To study the impact of lagged Minimum Support Prices (MSPs) on the acreage allocation, production and productivity of food crops .in Haryana, linear and logarithmic .forms of equations have been fitted. The food crops included wheat, rice, bajra, barley, gram, maize and .rapeseed/ mustard for study purpose. The previous year's MSPs generally influence the Producer farmers' decision on acreage allocation for the current year. The .linear type of equation has been used as:
1. Linear regression equation:
At= a + b Pt-1
Pt= a + b Pt-1
Yt= a + b Pt-1
The logarithmic type of equation has been used as:
2. Logarithmic regression equation:
Log At = log a + b Pt-1
Log Pt = log a + b Pt-1
Log Yt = log a + b Pt-1
Where, At = Area of food crops at (t)th period,
Pt = Production of food crops at (t)th period,
Yt = Productivity of food crops at (t)th period,
Pt-1 = Minimum Support Prices of food crops taken in per quintal at (t-1) th period.
Linear type of function found a better fit than logarithmic function.
RESULTS AND DISCUSSION
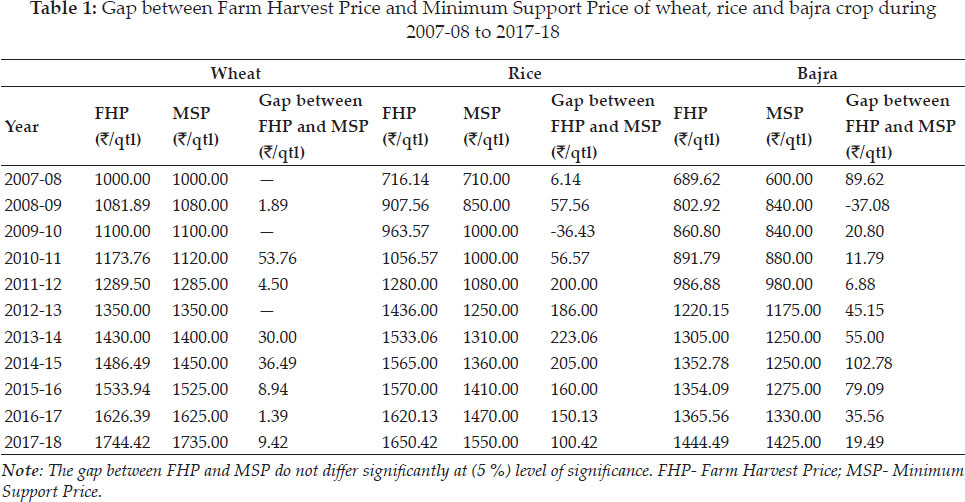
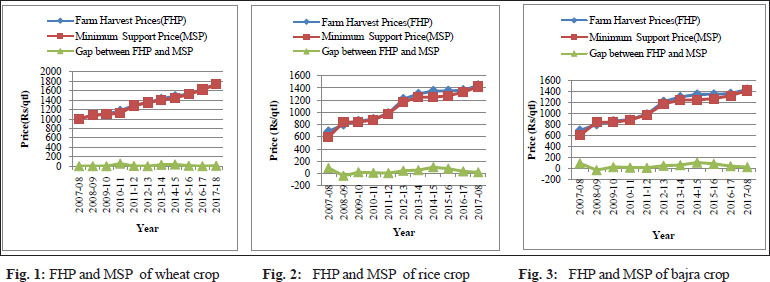
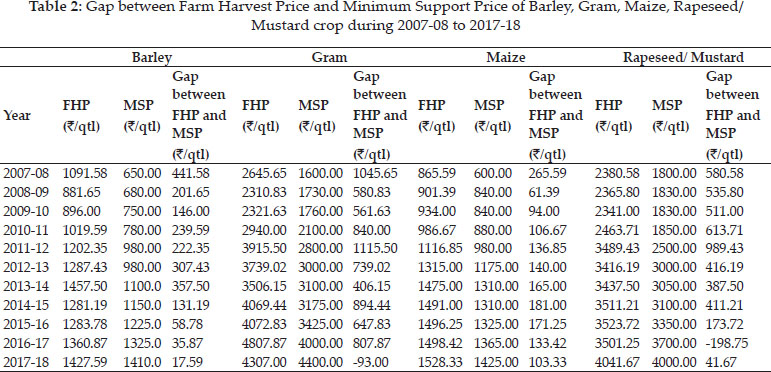
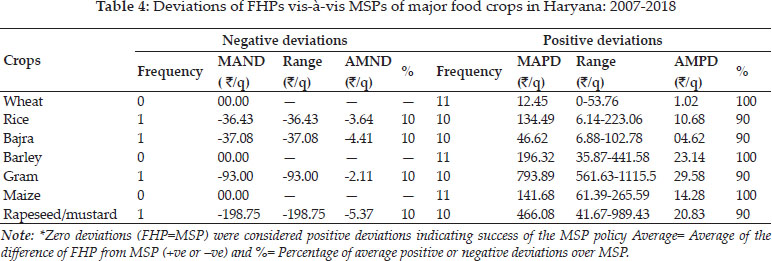
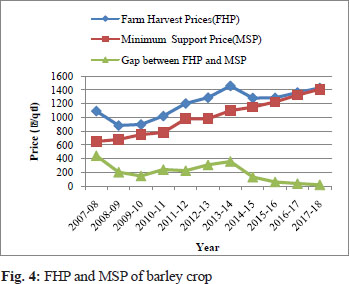
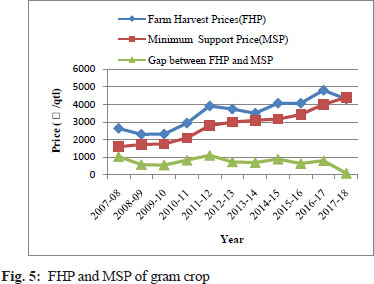
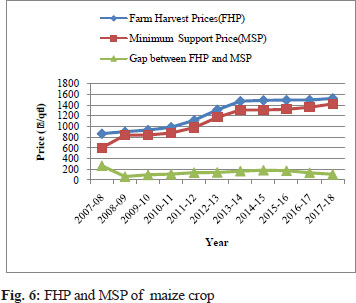
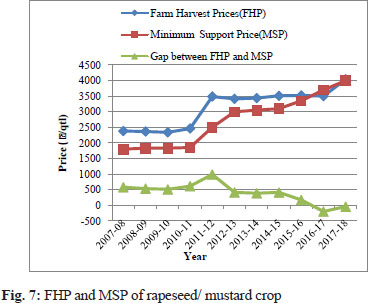
Deviations of FHPs from MSPs of major food crops in Haryana from 2007-18
To examine the effectiveness of MSP policy for food crops in Haryana, difference between its FHP and MSP was calculated in different years. Wheat, barley, maize experienced positive deviations 11 times in 11 years during 2007-18. This means that the average FHP was equal to or ruled higher than MSP in 11 times out of 11 years. The adjusted difference (positive) between MSP and FHP was as low as 100 per cent of MSP and the negative difference was nil. Rice, bajra, gram and rapeseed/ mustard experienced positive deviations 10 times and negative deviation 1 time in 11 years during 2007-18. This means that the average FHP was equal to or ruled higher than MSP in 10 times and lower than MSP in one time out of 11 years. The adjusted difference (positive) between MSP and FHP was as low as 90 per cent of MSP and the negative difference was 10 per cent of MSP
Impact of Minimum Support Prices (MSPs) on major food crops in Haryana during 2007-18
To study the impact of lagged Minimum Support Prices (MSPs) on the acreage allocation, production and productivity, linear and logarithmic form of equations have been fitted. As linear type of function had found a better fit than logarithmic function, the former had been presented here. The previous year MSPs had been used here since these prices generally influence the farmers' decision on acreage allocation for the current year.
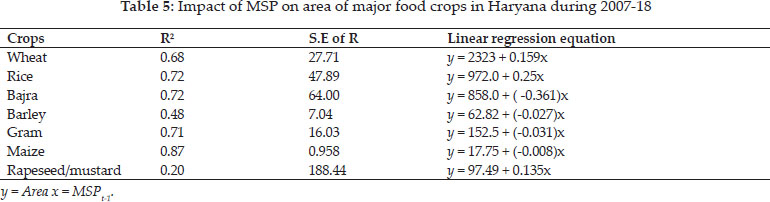
Impact of MSP on area of major food crops in Haryana during 2007-18
Impact of MSP on area of major food crops in Haryana are presented in table 5. The numerical values of the linear function for food crops indicates that R2 is significant at 1 per cent level and supports the results that variation in areas of food crops is explained by the explanatory variable, i.e. previous year's Minimum Support Prices (MSPs) of the food crops. The result revealed that 68 per cent variation in area of wheat, 72 per cent variation in area of rice, 72 per cent variation in area of bajra, 48 per cent variation in area of barley, 71 per cent variation in area of gram, 87 per cent variation in area of maize and 20 per cent variation in area of rapeseed/ mustard is explained by independent variable i.e. lagged MSP. The elasticity for these variables is significant at 1 per cent level in case of area of food crops. The value of elasticity has found as 0.159, 0.25, -0.361, -0.027, -0.031, -0.008, 0.135 per cent indicating thereby that previous year price influences current year's area of major food crops (like rice, wheat, gram, rapeseed/ mustard, maize, bajra, barley).
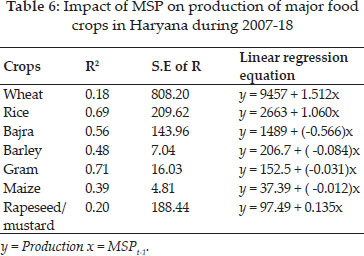
Impact of MSP on production of major food crops in Haryana during 2007-18
Impact of MSP on production of major food crops in Haryana are presented in Table 6. The numerical values of the linear lag function for food crops indicates that R2 is significant at 1 per cent level and supports the results that variation in production of food crops is explained by the explanatory variable, i.e. previous year's minimum support prices of the food crops. The result revealed that 18 per cent variation in production of wheat, 69 per cent variation in production of rice, 56 per cent variation in production of bajra, 48 per cent variation in production of barley, 71 per cent variation in production of gram, 39 per cent variation in production of maize and 20 per cent variation in production of rapeseed / mustard is explained by independent variable i.e. lagged MSP. The elasticity for these variables is significant at 1 per cent level in case of production of food crops. The value of elasticity has found as 1.512, 1.060, -0.566, -0.084, -0.031, -0.012, 0.135 per cent indicating thereby that previous year price influences current year's production of major food crops (like rice, wheat, gram, rapeseed/ mustard, maize, bajra, barley).
Impact of MSP on productivity of major food crops in Haryana during 2007-18
Impact of MSP on productivity of major food crops in Haryana are presented in Table 7. The numerical values of the linear lag function for food crops indicates that R2 is significant at 1 per cent level and supports the results that variation in productivity of food crops is explained by the explanatory variable, i.e. previous year's MSPs of the food crops.
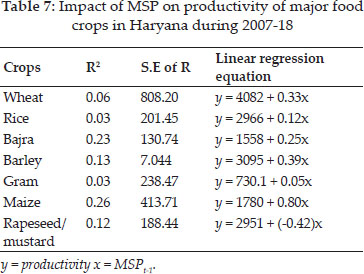
The result revealed that 6 per cent variation in productivity of wheat, 3 per cent variation in productivity of rice, 23 per cent variation in productivity of bajra, 13 per cent variation in productivity of barley, 3 per cent variation in productivity of gram, 26 per cent variation in productivity of maize and 12 per cent variation in productivity of rape seed/ mustard is explained by independent variable i.e. lagged MSP. The elasticity for these variables is significant at 1 per cent level in case of productivity of food crops. The value of elasticity has found as 0.33, 0.12, 0.25, 0.398, 0.05, 0.80, -0.42 per cent indicating thereby that previous year price influences current year's productivity of major food crops (like rice, wheat, gram, rapeseed/ mustard, maize, bajra, barley).
CONCLUSIONS AND POLICY IMPLICATIONS
The gap analysis in which deviations of FHPs from MSPs of food crops results in positive deviations (FHP ruled higher than MSP) in most of cases in Haryana during 2007-18. In Haryana, higher demand due to more procurement for central part than supplies does not allow the market prices to fall below MSP. Market prices for bajra and barley rule lower than the MSP in some years during post harvest period and shoot up during the lean periods. The government intervention was very strong and did not allow the FHPs to move away from MSPs in a significant manner despite large marketed surplus. The increase in MSP over the previous year brought additional area under food crops, but the impact was nominal. From the results we conclude that impact of MSP on area is higher but there is lower impact of MSP on productivity of food crops. A higher rate of increase in the MSP of paddy over the previous year increased the area significantly under this crop. It may be concluded on the bases of above discussion that for bringing about the technological revolution, the price policy is a necessary condition but not a sufficient one. In Haryana, a large chunk of good quality land was shifted from pulses, oilseeds to paddy and wheat crops creating a serious imbalance in the demand and supply of several other agricultural commodities.
Introduction of Direct Payment Deficiency System (DPDS) for paying MSP guarantee for the farmers has to be initiated. Under this system, the farmers will directly get the amount, which is the difference between the Minimum Support Price (MSP) and the market price, when the market price falls below the MSP. The government of India may adopt the recommendation given by the National Commission for Farmers (NCF) that MSP should be at least 50 per cent more than the weighted average of cost of production. New technological mission on food crops should be started to promote the growth of food crops. In Haryana, procurement is effective only in rice and wheat crops. Policy should made availability of procurement machinery for all the food crops. Policy should provide proper warehouse facilities for increasing farmers income. The Cabinet Committee on Economic Affairs should increase in the Minimum Support Prices (MSPs) for all Kharif crops and to incentivise cultivation of pulses and oilseeds, Government should announced a more bonus on these crops, payable over and above the approved MSP. Swaminathan commission suggested to give farmers a minimum support price at 50 per cent profit above the cost of production classified as C2 by the Commission for Agricultural Costs and Prices (CACP).
REFERENCES
ADRT 2003. Impact of Minimum Support Prices on Agricutural Economy ( consolidated report), Agricultural Situation in India, 60: 598-614.
Ali, S.Z., Sidhu, R.S. and Vatta, K. 2012. The Effectiveness of Minimum Support Price Policy for Paddy in India with a Case Study of Punjab. Agricultural Economics Research Review, 25: 231-42.
Chand R. 2008. MSP and Other Interventions in Wheat Market: Are They Contributing to the Buffer Stock Cycles and Market Destabilization? http://citeseerx.ist.psu.edu/viewdoc/download?doi=10.1.1.620.3112&rep=rep1&type=pdf
Deshpande, R.S. (Ed). 2004. Impact of Minimum Support Prices on the Agricultural Economy. In Glimpses of Indian Agriculture. Ministry of Agriculture & Academic Foundation, Government of India. New Delhi.
Godara, A.K. and Poonia, U. 2013. Impact of Prices on Acreage and Income from Gram In Haryana. International Journal of Innovative Research & Development, 2: 206-219.
Jain, R., Jain, Y. and Manjunath 2018. Estimating of Minimum Support Price (MSP) of Crops Using Data Analysis. International Journal for Research in Applied Science & Engineering Technology, 6: 16-22.
Jha, S. and Srinivasan, P.V. 2006 India— Reforming Farm Support Policiesfor Grains Report Prepared for IGIDR— ERS/USDA Project: Indian Agricultural Markets and Policy, Mumbai.
Kadasiddappa, M., Soumya, B., Prashanth P, Sachin and H.M. 2013. A Historical Prospective for Minimum Support Price of Agricultural Crops. Kisan World, 40.
Parikh, J. and Singh, C. 2007. Extension of MSP: Fiscal and Welfare Implications.http://planningcommission.nic.in/ reports/sereport/ser/ser_msp.pdf.
Planning Commission. 2005. Report of the Inter-ministry Task Group on Comprehensive Medium-Term Strategy for Food and Nutrition Security.http://planningcommission.nic.in/aboutus/taskforce/inter/inter_nutrn.pdf.
Sarkar, D. 2011. Agricultural Policy in West Bengal: A Policy Matrix. Economic Affairs, 56.
Sudhakar, G. and Wale, Z. 2017. Minimum Support Prices and its impact on Agricultural Economy. International Journal of Economics and Business Management, 3: 38-46.