![]()
International Journal of Agriculture, Environment and Biotechnology
Citation: IJAEB: 13(2): 185-192, June 2020
DOI: 10.30954/0974-1712.02.2020.10
AGRONOMY
Integrated Farming Systems for Sustainable Agriculture in Raigad District of Maharashtra
ABSTRACT
An integrated farming system comprises the crop production, livestock, horticulture crops and fisheries etc. The status of these combinations depends on the prevailing modal of these systems in a particular area. Therefore, it is necessary to identify the existing major integrated farming systems with internal cost adjustment, return, income and employment in the farming systems. The present study was conducted in Raigad district of Maharashtra during year 2015-16. A total sample of 120 households was selected. Out of seven farming systems six systems were found livestock based systems, viz; FS-I: Crops + Vegetable, FS-II: Crops + Dairy, FS-III: Crops + Poultry, FS-IV: Crops + Vegetable + Dairy, FS-V: Crops + Poultry + Dairy, FS-VI: Crops + Vegetable + Goat and FSVII: Crops + Vegetable + Orchard + Dairy. The total cost of farming system was minimum in FS-I and highest in FS-V. On per farm basis employment generated was minimum in FS-I (267.76 man days) and maximum in FS-V (758.82 man days).
Highlights
![]() The income and employment generation as well as internal cost adjustment (67.66%) per hectare was maximum in FS-VI as in this farming system crops, vegetables and goats enterprises were undertaken.
The income and employment generation as well as internal cost adjustment (67.66%) per hectare was maximum in FS-VI as in this farming system crops, vegetables and goats enterprises were undertaken.
Keywords: Farming systems, Dairy, Poultry, Goat, Internal-cost adjustment and Return
Indian agriculture is characterized by decreasing holding size of farms, increasing population and labour charges, changing consumption behaviour pattern and reduced availability of land and water resources besides which climate change and global warming are also the important challenges. With these issues, agriculture has responsibility of providing household food and nutritional security to billion plus population.
The decreasing trend of per capita land availability with shrinking operational farm holding size poses a serious challenge to the sustainability and profitability of existing farming systems especially in marginal and small households. A paradigm shift in agricultural research through integrating locally available farm resources along with restoration of environment is essential to address all the issues which are being faced by Indian agriculture. The farming systems approach to agricultural research and development efforts will accelerate agricultural growth and will provide opportunity to leverage poverty-prone rural India into a prosperous India. Research with Integrated Farming Systems perspective has various objectives ranging from increasing the body of knowledge about farming systems to solve problems in different Farming Systems. Farming Systems concept, after tracing the evolution of general systems theory as a system referring to crop combination or enterprise mix in which the products and/or the by-products of one enterprise serve as inputs for the production of other enterprises (Maji 1991). The whole farming, rather than the individual crops/enterprises need to be considered in the decision making under the integrated farming systems approach. Maharashtra is the third largest state in India in terms of geographical area (3,07,713 sq. km.) occupies nearly 9.3 per cent geographical area of the country. Maharashtra state occupies the western and central part of the country and has a long coastline stretching nearly 720 kilometers along the Arabian Sea. The climate of the state is tropical. The Western Ghats hill ranges run north to south separating the coastal district of Palghar, Thane, Mumabi, Raigad, Ratnagiri and Sindhudurg from rest of the state. On the basis of rainfall, soil types and vegetation the state has been divided into nine agro-climatic zones. The agriculture in most of the part of the state is rainfed and is prone to high production risk. In order to meet the farm and family requirement, the farmers in the state have evaluated different combinations of crop, livestock, horticulture, forestry etc. Food security always remains an uncompromising goal of farm level agriculture for rural masses in most part of the state.
Costs and returns play an important role in portraying economic viability of a crop and dairy enterprise. Generally, a producer can increase his income in two ways either by increasing the production or by reducing cost of production. Therefore, an attempt was made in the present study to estimate the costs and returns in different farming systems with special emphasis on internal cost adjustment, income and employment through integrated farming systems in Raigad districts of Maharashtra.
MATERIALS AND METHODS
Multi stage random sampling plan was adopted for the selection of study area and sample respondents for collection of information required for the study. At first stage, Raigad district was selected from north Konkan region. From the selected district, two tahsils were selected randomly. The selected tehsils were Mahad and Roha tehsils, from each tehsil four villages were selected randomly on the basis of highest area under farming systems. Out of which 15 farmers of each village were selected randomly. Thus, final sample consisted of 120 farmers from four selected tahsils of study area.
Costs and Return Estimation
Operational or Variable Costs
Operational cost are the actual costs incurred by the farmer along with incidental charges incurred towards labour and material costs. The various items of operational costs were seed, farmyard manure, fertilizers, plant protection chemicals, feeds and concentrates, fodder and straw, labour (hired labour and family human labour) etc.
Fixed Costs
The various items of fixed costs were land revenue, land rent and depreciation. The depreciation rates, life span and junk value for various agricultural implements and machinery were decided in consultation with the respondents. Interest on fixed capital was calculated at the prevailing bank rate (12 %) on the value of the farm and livestock assets. The following method for estimation of costs and returns was used:
Total Cost (TC) = Total Variable Cost (TVC) + Total
Fixed Cost (TFC)
Return
The return from crop, livestock, goatry and poultry were estimated by multiplying the actual price realized to quantity sold by them and the quantities that retained for seed or home consumption was evaluated at the rates prevailing at the time of harvest time. The same method was also followed for the evaluation of by-products of various enterprises.
Income Generation:
Gross income from integrated farming system (GIIFS):
Income generation from Integrated Farming Systems were worked out as follows.
Value of main and byproduct received from various farming systems were:
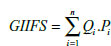
Where, Qi is the Physical output (main and by product) of ith component of IFS and
Pi is the price of ith output (main and by product) Paid out cost of Integrated Farming Systems (PCIFS) The PCIFS was work out as:
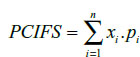
Where, xi = the quantity of ith external input pi = the price of ith external input

Where, NIIFS = Net Income from Integrated
Farming System
Cost of Internally Adjusted Input (CIAI)

Where, TC = Total Cost (Fixed Cost + Variable Cost). PC/FS = Paid out cost of Integrated farming system.
EMPLOYMENT GENERATION
The extent of employment generation in different farming systems was worked out. Human labour employment in farming systems was calculated by taking time spent in performing various operations.
RESULTS AND DISCUSSION
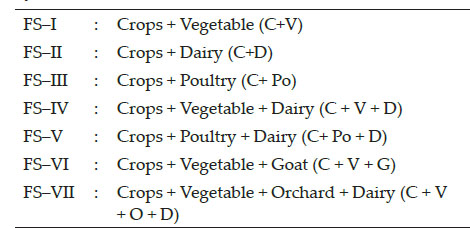
In the present study irrespective of climatic condition as well as location following farming systems were observed,
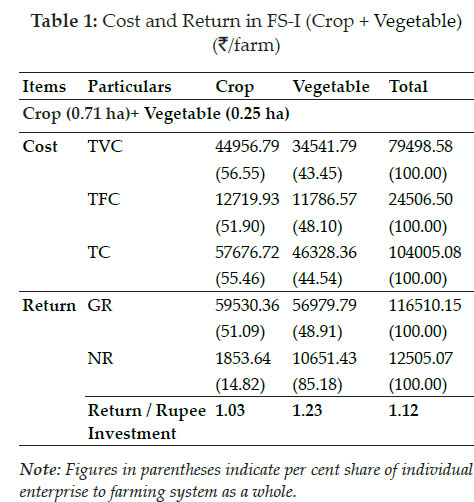
Cost and Return in Existing Farming Systems FS-I (Crop + Vegetable): The per farm cost and return from different enterprises in FS- I were calculated and presented in Table 1. It is evident from the table 1, that the total cost (TC) of FS-I was ₹ 104005.08 per farm, of which ₹ 79498.58 (76.44%) and ₹ 24506.50 (23.56%) were total variable cost (TVC) and total fixed cost (TFC), respectively. The gross return (GR) was ₹ 116510.15 per farm and net return (NR) per farm was ₹ 12505.07 out of which ₹ 1853.64 (14.82%) were contributed by raising the crops and the remaining ₹ 10651.43 (85.18%) by growing the vegetables. The return by spending one rupee was ₹ 1.03 and ₹ 1.23 in crops and vegetables, respectively. Same findings were also reported by Nanda et al. (2007), Channabasavanna (2009) and Singh (2014).
FS-II (Crop + Dairy enterprise) The cost and return from the FS-II are presented in Table 2.
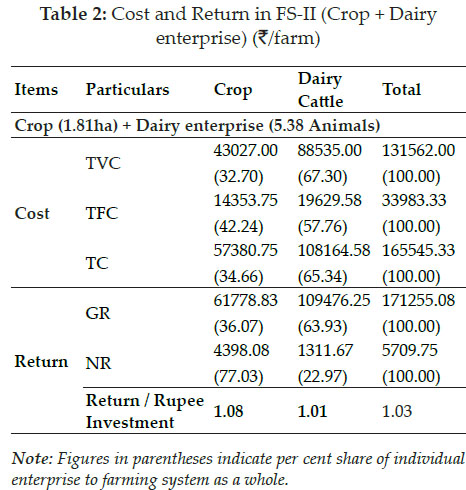
It is clear from the table that in this farming system, farmers had crops and dairy enterprises. The total cost for FS-II was ₹ 165545.33 of which the major part of ₹131562 (79.47%) was shared by variable cost and the remaining part of ₹ 33983.33 (20.53%) due to total fixed Cost. Of this total cost per farm, 34.66 per cent was incurred to raise crops and 65.34 per cent to rear the dairy cattle. The net return per farm was ₹ 5709.75 in which ₹ 4398.08 (77.03%) was contributed by raising crops and ₹ 1311.67 (22.97%) by dairy component. The return by spending one rupee was ₹ 1.08 and ₹ 1.01 in crops and dairy enterprises, respectively. Same result was reported by Singh (2014).
FS-III (Crop + Poultry): It can be observed from the table 3,that the total cost incurred in this farming system was ₹ 177494.08. Out of which 85.63 per cent and 14.37 per cent were total variable and total fixed cost, respectively.
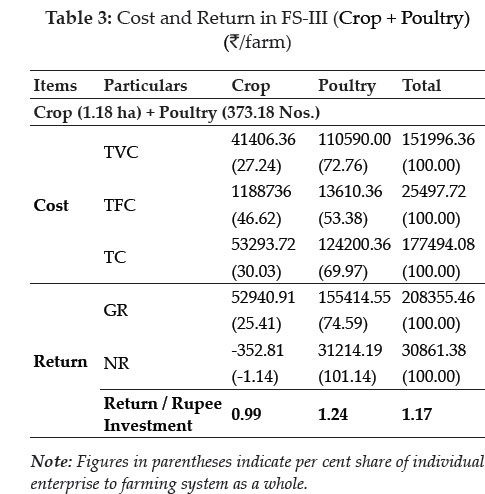
From the total cost per farm 69.97 per cent and 30.03 per cent cost was incurred to rear poultry birds and crops, respectively. The average number of poultry birds maintained per farm was 373.18. The net return per farm was ₹ 30861.38 in which ₹ 31214.19 (101.14%) was contributed by poultry enterprise and negative return by crops i.e. ₹ -352.81 (-1.14%). Thus, the contribution of poultry enterprise in net return per farm was more (101.14%) than the crop enterprises. The return per rupee was ₹ 1.24, and ₹ 0.99 in poultry and crop enterprise, respectively. Thus, in this farming system, poultry enterprise contributed more return compared to crops, which was negative. In this system loss due to crops was covered by poultry enterprise.
FS-IV (Crop + Vegetable + Dairy enterprise):The per farm cost and return in the FS-IV is presented in Table 4. Total cost in FS-IV was ₹ 181364.03 including total variable cost of ₹ 140254.76 and total fixed cost of ₹ 41109.27. The per cent contribution of TVC and TFC was 77.33 per cent and 22.67 per cent of the total cost, respectively.
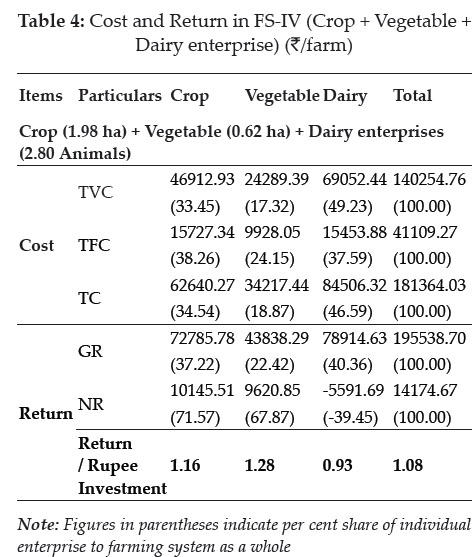
Further, maximum total cost was incurred in dairy enterprise (46.59%) followed by crops (34.54 %) and vegetables (18.87%). In total fixed cost, the percentage share of cost incurred was maximum to raise crops (38.26%) followed by dairy enterprises (37.59%) and vegetables (24.15%), where as in total variable cost the percentage share incurred was maximum in dairy enterprises (49.23 %) followed by crops (33.45%) and vegetable (17.32 %). The gross return from the system was ₹ 195538.70 of which dairy enterprises contributed maximum share of ₹ 78914.63 followed by crops (₹ 72785.78) and vegetables (₹ 43838.29). The contribution in net return per farm from crops enterprises was maximum i.e. ₹ 10145.54 followed by vegetable (₹ 9620.85) and negative return from dairy enterprises (₹ -5591.69). The negative return in case of dairy enterprise is probably due to the fact that the per day per animal milk output is very low.
The return per rupee on invested was maximum in vegetables (? 1.28) followed by crops (₹ 1.16) and less than dairy enterprises (₹ 0.93). The overall return to per rupee investment in FS-IV was ₹ 1.08. Singh (2014) also reported the similar results.
FS-V (Crops + Dairy enterprise + Poultry): The per farm cost and return in the FS-V are presented in Table 5. The total cost of system was ?
761864.80. Out of the total cost, the per cent share of total variable cost and total fixed cost was 86.45 per cent and 13.55 per cent, respectively. Of the total cost per farm per year, 74.69 per cent, 15.69 per cent, and 9.62 per cent were incurred for rearing poultry birds, dairy enterprises and crops raising activities, respectively. Thus, this integrated farming system is poultry dominated system.
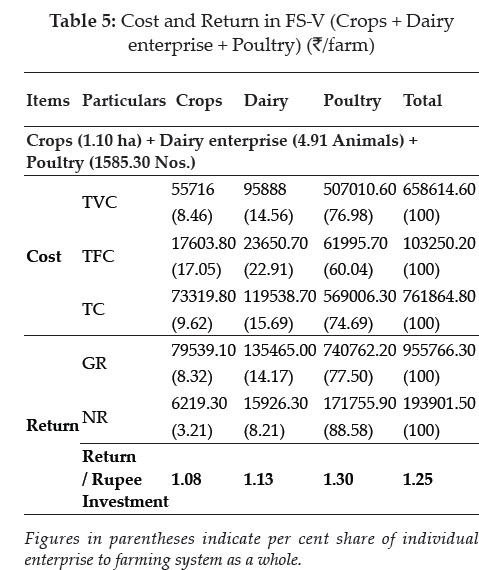
The gross return from the system was ₹ 955766.30. The highest share in gross return was from poultry enterprises i.e. ₹ 740762.20 followed by dairy enterprise (₹ 135465.00) and crops (₹ 79539.10). The net return per farm was ₹ 193901.50 in which 88.58 per cent contributed by poultry enterprises, 8.21 per cent by dairy enterprises and 3.21, per cent by crops. The benefit cost ratio was ₹ 1.30, ₹ 1.13, and ₹ 1.08 from poultry enterprises, dairy enterprises and crops, respectively. Thus, in this system poultry enterprises and dairy enterprises were more profitable than crops.
FS-VI (Crops + Vegetables + Goat): The total cost incurred, gross return generated & net return obtained in the FS-VI are depicted in Table 6. When coming to the total cost per farm in this system it was ₹ 120147.25 in which 75.57 per cent and 24.43 per cent were total variable cost and total fixed cost, respectively.
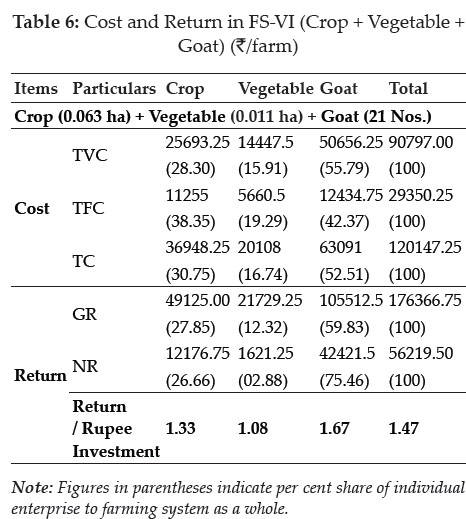
From the total cost per farm 52.51 per cent was incurred to rear the goats, 30.75 per cent to raise the crops and 16.74 per cent to raise the vegetables. In total fixed cost the highest cost incurred was also in goatery (42.37%) and similarly in total variable cost also the maximum cost was incurred in goat rearing (55.79%). The gross return from the system was ₹ 176366.75 in which the highest share was contributed by goat (₹ 105512.50) followed by crops (₹ 49125.00) and vegetables (₹ 21729.25) The net return from the system was ₹ 56219.50 of which 75.46 per cent came from goat rearing, 26.66 per cent from crops grown and 02.88 per cent from vegetables grown. The return per rupee investment was maximum from goat enterprises i.e. ₹ 1.67 it was followed by crops (₹1.33) and vegetables (₹ 1.08). Thus, in this system goat enterprise was more profitable than other two enterprises. Girdhar et al. (2012) reported that mixed farming (crops plus livestock) gave maximum net return ₹ 46,350 per year (1.4 ha) under irrigated condition.
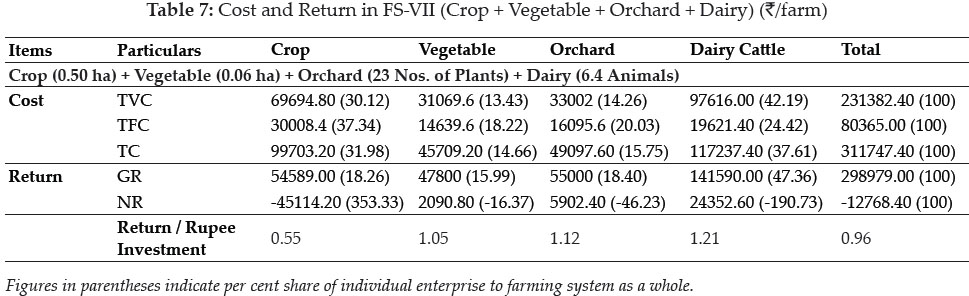
FS-VII (Crop + Vegetable + Orchard + Dairy): Per farm cost and return obtained in FS-VII are presented in Table 7. The per farm total cost of the system was ₹ 311747.40 of which total variable cost and total fixed cost were ₹ 231382.40 and ₹ 80365.00, respectively. Within the system, the share of total cost was maximum in dairy (37.61%) followed by crops (31.98%), orchard (15.75%) and it was lowest in vegetable (14.66%). In total variable cost the contribution of dairy was ₹ 97616 (42.19%) followed by crops ₹ 69694.80 (30.12%), orchard ₹ 33002.00 (14.26%) and lowest in vegetable ₹ 31069.600 (13.43%). The share of fixed cost to the total cost was highest in crops (37.34%) followed by dairy (24.42%), orchard (20.03) and lowest in vegetable (18.22%). The gross return of the system was ₹ 298979.00 of which dairy contributed highest share (₹ 141590.00) followed by orchard (₹ 55000.00), crops (₹ 54589.00) and vegetable (₹ 47800.00). The net return of the system was negative i.e. ₹ -12768.40, indicted that, the losses incurred due to crops in this year were to great extent recovered by other three component of the integrated farming system. Thus, this system improves the risk bearing ability of the farmer. In this system dairy, orchard and vegetable enterprises were profitable with net return of ₹ 24352.60, ₹ 5902.40 and ₹ 2090.80 respectively at individual level, but due to heavy loss in crop enterprises the whole systems was in loss. This loss of crop enterprise was due to heavy rainfall. The return per rupee investment was highest in dairy (₹ 1.21) followed by orchard (₹ 1.12), vegetables (₹ 1.05) and crops (₹ 0.55).
Farm Income and Employment Generation
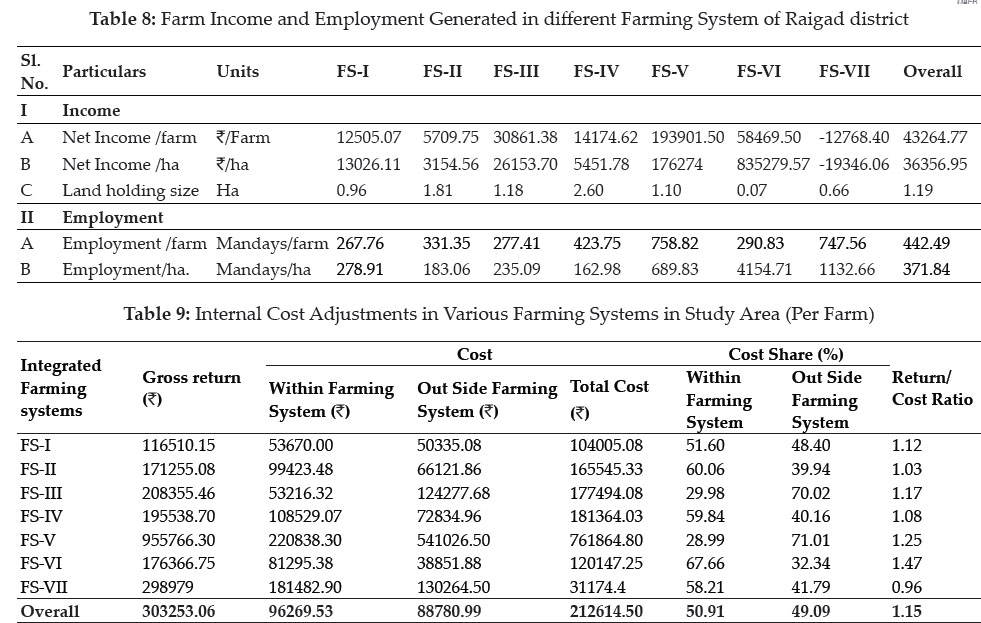
Table 8 revealed that out of seven farming systems of Raigad district, maximum net income per farm was generated from FS-V (₹ 193901.50) followed by FS-VI (₹ 56219.50), FS-III (₹ 30861.38), FS-IV (₹14174.67), FS-I (₹ 12505.07) and FS-II (₹ 5709.75). Per farm maximum employment generation was observed in FS-V (758.82 man-days) followed by FS- VII (747.56 man-days), FS-IV (423.75 man-days),FS- II (331.35), FS-VI (290.83 man-days), FS-III (277.41 man-days)and the lowest in FS-I (267.76 man-days). On per hectare basis the maximum employment was generated by FS-VI (4154.71 man-days) followed by FS-VII (1132.66 man-days), FS-V (689.83 man-days), FS-I (278.91 man-days), FS-III (235.09 man-days), FS-II (183.06 man-days), and lowest in FS-IV (162.98 man-days). On an average per farm net income and employment generated was ₹ 43264.77 and 442.49 man-days per year respectively. The income and employment generated per hectare was maximum in FS-VI as in this farming system crops, vegetable and goat enterprises were taken. Thus, it can be concluded that on per farm basis net income and employment generation were maximum in FS-V, while on per hectare basis net income as well as employment generation were maximum in FS-VI.
Internal Cost Adjustments in Various Farming Systems in Study Area
The cost involved in these activities on different farming systems were divided into two parts i.e. cost incurred within the farming system and cost incurred from outside the farming system. Cost from within farming system included the value of all those inputs required for different enterprises and are supplied from within the system like FYM cost, owned labour, green/dry fodder, seed and feed. The value of the inputs brought from outside the farm (or farming system) for different enterprises were included in the cost incurred outside the farming system. From the total cost, the cost incurred within the farming system, show the utilization of resources within the system. The system is more feasible and sustainable when there is more utilization of resources within the system than the other system. Financial requirement to purchase the inputs from outside the farm is also minimum in such system. This also reduces the dependency of the households for cash in hand. Return/cost ratio or return on per rupee investment can also be the criteria to select the best farming system among the existing one. Therefore, all the existing farming systems in Raigad district were studied, on the basis of cost incurred within and outside the farming system as well as on the basis of per rupee investment. Internal cost adjustments in various systems in the study area were worked out and are presented in Table 9. Outside cost means purchase of inputs from outside market by the farmers. The study area having seven farming systems of which FS - VI showed maximum share of internal cost adjustment (67.66%) followed by FS - II (60.06%), FS - IV (59.84%), FS - VII (58.21%), FS - I (51.60%), FS -III (29.98%) and FS - V which had least share (28.99%). The FS - VI showed more self-dependence due to rearing of goats therefore in this system maximum cost was adjusted internally and only 32.34 per cent cost inputs were purchased from outside. FS - II also showed same trend where dairy played an important role in cost adjustment. FS - V and FS - III were more dependent on the outside cost items. Because FS-V and FS - III had required more investment or long term investment in setting up of poultry enterprises. In this district on per rupee investment basis FS-VI (₹ 1.47) and FS-V (₹ 1.25) were more profitable than other systems.

CONCLUSION
The present study was conducted in Raigad district of Maharashtra during year 2015-16 to examine the costs and returns in existing farming systems. A total number of 120 households were selected for study. Seven farming systems observed in Raigad district were Crops + Vegetable (C+V), Crops + Dairy (C+D), Crops + Poultry (C+ Po), Crops + Vegetable + Dairy (C+ V+D), Crops+ Poultry + Dairy (C+ Po+D), Crops+ Vegetable + Goat (C+V+G) and Crops+ Vegetable + Orchard+ Dairy (C+V+O+D).
The net return among the seven farming systems varied from ₹ -12768.40 in FS-V to ₹ 193901.50 in FS-VI. The highest net return came from FS-V due to vegetable and poultry enterprises whereas lowest net return in FS-VII (₹ -12768.40), farmers had taken kharif crops, vegetables, dairy and orchard which were mostly depend upon rainfall and due to heavy rainfall during the study period crops, vegetable and orchard were badly affected hence farmers in this region obtained of loss compare to FS-VI.
Out of seven farming systems, maximum net income per farm was generated from FS-V (₹ 193901.50) followed by FS-VI (₹ 56219.50), FS-III (₹ 30861.38), FS-IV (₹ 14174.62), FS-I (₹ 12505.07) and FS-II (₹ 5709.75). Per farm maximum employment generation was observed in FS-V (758.82 man-days) followed by FS-VII (747.56 man-days), FS-IV (423.75 man-days), FS-II (331.35), FS-VI (290.83 man-days), FS-III (277.41 man-days)and the lowest in FS-I (267.76 man-days).
On cost adjustment basis, the FS-VI showed maximum share of internal cost adjustment followed by FS-II, FS-IV, FS-VII, FS-I, FS-III and FS -V respectively. The FS - VI showed more selfdependence due to rearing of goats. Only 32.34 per cent cost inputs were purchased from outside in this system. FS - II also showed same trend in these systems where dairy enterprise played an important role in cost adjustment.
REFERENCES
Abdul, N.S. and Rao, D.N. 1987. Agricultural development policies - need for a fresh look. Kurukshetra, 35(7): 4-6.
Chandel, B.S. and Malhotra, R. 2006. Livestock systems and their perforamance in poor endowment regions. Agriculture Economics Research Review, 19(2): 311-326.
Channabasavanna, A.S., Biradar, D.P., Prabhudev, K.N., and Mahabhaleswar, H. 2009. Development of profitable integrated farming system model for small and medium farmers of tungabhdra project area of Karnataka. Karnataka Journal of Agriculture Science, 22(1): 25-27.
Dorge, J.T., Joshi G.G. and Sanap, D.J. 2015, Employment and income pattern of different farming systems in Western Maharashtra. Internt. Res. J. Agric. Eco. & Stat., 6(2): 356363.
Girdhar, K., Elangovan, A.V., Sharangouda., Khanderkar, P. and Sympathy, K.T. 2012. Economic analysis of farming systems in Chitradurga district of Karnataka. Expended Summaries Vol3 3rd International Agronomy Congress, Nov- 26-30, 2012.
Jayanthi, C.C., Vermila K., Nalimi and Vivek, G. 2007. Physical indicators - on farm farming system for irrigated uplands of western zone of Tamil Nadu. Journal of Farming Systems Research & Development, 13(1): 56-59.
Kandasamy, G. S. 1998. An economic analysis of integrated farming system in Dharampuri district, Tamil Nadu. Farming Systems, 14(1&2): 26-33.
Kumari Sarita., Sharma L., Burark, S.S., Murdia, A., and Bhushan, B. 2015. An economic analysis of different farming systems prevailing in Udaipur District of Rajashtran. Journal of Animal Research, 5(4): 819-826.
Maji, C.C. 1991. Farming systems in the post green revolution belt. Indian Journal of Agricultural Economics, 46(3): 403-411.
Naik, A.D., Shankramurthy, H.G., Teggi, M.Y. and Koppad, M.B. 2003. Resource use efficiency in onion cultivation in Bijapur District, Karnataka. Karnataka Journal of Agricultural Sciences, 11(1): 27.
Nanda, S.S., Mishra, S.N. and Mohanty, M. 2007. On farm farming system for income and employment generation in Kalahandi district of Orrisa. Journal of Farming System Research & Development, 13(1): 56-59.
Norman, D.W. 1978. Farming systems research to improve the livelihood of small farmers. American Journal of Agricultural Economics, 60: 813-818.
Ramrao, W. Y., Tiwari, S. P. and Singh, P. 2005. Crop-livestock integrated farming systems for augmenting socioeconomic status of small holder tribal of Chattishgarh in central India. Livestock Research for Rural Development, 17:252-259.
Ravi Shankar, N. Pramanik, S.C. Jaya Kumar, J. Singh, D.R. Bibi, N. Nawaz, S. and Biswas, T.K. 2007. Study on integrated farming system (IFS) under different resource condition of Island Ecosystem. Journal of Farming System Research & Development, 13(1): 1-9.
Ravi Shankar, N., Pramanik, S.C., Rai R.B., Shakila Nawaz, Tapan, K.R., Biswas and Nabisat Bibi. 2007. Study on integrated farming system in hilly upland areas of Bay Islands. Indian Journal of Agronomy, 52(1): 7-10.
Shankar R., Pramanik N., Jaya Kumar S.C., Singh J., Bibi D.R., Nawaz N., S. and Biswas, T. K. 2007. Study on integrated farming system (IFS) under different resource condition of Island Ecosystem. Journal of Farming System Research & Development, 13(1): 1-9.
Singh H. 2014. Economic Analysis of Integrated Farming Systems in Southern Rajasthan. Unpublished Ph. D. Thesis, Rajasthan College of agriculture, MPUAT, Udaipur.
Vichare. 2007. Economic analysis of rice based cropping systems in north Konkan region of Maharashtra. Unpublished Ph.D. Thesis, Dr. B.S. Konkan Krishi Vidyapeeth, Dapoli.
Wadear, P.R. 2003. Animal Based Farming Systems for Long Term Sustainability in Northern Karnataka. - A SocioEconomic Assessment. Unpublished Ph.D. Thesis, Univ. Agric. Sci., Dharwad.