International Journal of Agriculture, Environment and Biotechnology
Citation: IJAEB: 13(4): 439-446, December 2020
DOI: 10.30954/0974-1712.04.2020.8
![]()
AGRICULTURAL ENGINEERING
Land Use / Land Cover Mapping of Nahra Nala Watershed Using SENTINEL-2B Imagery
ABSTRACT
Land is a limited natural resource which restricts no further increase in a cultivated area. Moreover, due to the increasing population, the pressure on this resource is increasing day by day. Hence, land use/land cover (LU/LC) information is very much necessary for the best possible use by maximizing outputs sustainably from this diminishing resource such that good planning and management can be done to meet the demand of the ever-increasing population. Therefore, a study has been conducted for land use/land cover mapping using SENTINEL-2B satellite data having a fine spatial resolution of Nahra nala watershed, which is a tributary of Wainganga river situated in Balaghat district of Madhya Pradesh, India. Five land use/land cover classes were identified, namely water bodies, agricultural land, forest, habitation (built-up), and wasteland in the study area. The study area possesses forest as the predominant LU/LC class with 83.79 percent of the total geographical area of the watershed. Accuracy assessment was also applied to the final classified results based on the ground truth points or known reference pixels along with Google Earth imageries. The overall classification accuracy of 95.52% with the kappa value of 0.92 was achieved.
Highlights
 This study conducted in Nahra Nala Watershed of Balaghat district, Madhya Pradesh, India, to make the land use / land cover classification map through Remote Sensing and GIS approach.
SENTINEL-2B high-resolution imagery is used for achieving the higher accuracy in LU/LC classification.
Keywords: LU/LC, remote sensing and GIS, SENTINEL-2B, watershed
Land is a vital natural resource, which incorporates soil, water & vegetation involving the total ecosystem (Meshram et al. 2017; Gajbhiye et al. 2015; Sharma et al. 2011a). For long time, natural resources due to increasing population and poor management practices are degrading at a rapid pace. Increasing socio-economic development, population growth is superposed on long term balanced ecological dynamics associated with climate variability, erratic rainfalls, instantaneous floods leading to disturbance in the ecosystem (Sharma et al. 2008; Meshram and Sharma 2018; Sharma et al. 2018). Various part of the earth is modified to meet the food demands of mankind. In discriminant land use without its proper management and meager monitoring leads to degradation of land. The land use/land cover is vigorously active that undergoes numerous reshaping phenomena according to the changing socio-economic and natural environments (Patil et al. 2017; Sharma and Seth 2010; Sharma et al. 2015).
The change in any form of land use/land cover is highly related either to the external forces and the atmospheric built up within the system. So, the information of land use/land cover is necessary for planning, developing, and managing the land of any area as it is very thoughtful to understand the earth system with a special focus on regions of unutilized potentials. Such studies at a watershed scale are highly crucial to monitor resource availability and its timely supervision. Sharma and Seth (2010) defined watershed as a topographically delineated natural hydrological unit of area which drains surface runoff through a well-defined system of channels, drains, streams, or rivers resulting from past precipitation to a pre-determined single outlet. The term land use relates to the human activity or economic function associated with a specific piece of land, while the term land cover relates to the type of feature present on the surface of the earth. Satellite remote sensing can hold a substantial position in getting information about the land use/ land cover of an area and changes occurring over a time span. Moreover, remote sensing is helpful for land cover mapping in inaccessible areas like mountainous regions, swamps, and restricted forests with plantations.
How to cite this article: Patle, D., Rao, J.H. and Sharma, S.K. 2020. Land Use / Land Cover Mapping of Nahra Nala Watershed Using SENTINEL-2B Imagery. IJAEB, 13(4): 439–446.
Source of Support: None; Conflict of Interest: None ![]()
Recently, real-time information is essential for critical judgments, and therefore, the data and its investigation methodology are critical in providing the best possible latest results. In terms of data, ESA (European Space Agency) has been providing SENTINEL images for several purposes. SENTINEL-2 data can meet the analysis, which is well-matched with its properties. Spatial resolution is one of the most important characteristics of satellite sensors that varies from a few cm to several km (Demirkan and Duzgun 2017). A Geographical Information System (GIS) represents a powerful set of tools that can considerably improve the processing of spatial data (Nema et al. 2017; Pathak et al. 2018; Awasthi and Patle 2019; Bisen et al. 2019; Patle and Awasthi 2019; Rao et al. 2019; Rao et al. 2020). Spectral resolution is another essential property of a satellite sensor. Since SENTINEL-2 data is multi-spectral, the acquired data can be successfully utilized for LU/LC classification (Demirkan and Duzgun 2017).
IRS, IKONOS, LANDSAT, LISS, MODIS, NOAA-AVHRR, RADARSAT, and SPOT are several satellites that can be used for Earth Observation purposes. The spatial and spectral resolution for that operation can vary and come across many requirements. Since the SENTINEL-2 data spatial resolution differs from 10 to 30 m, it can meet several important requirements for LU/LC mapping (Manakos and Levander 2014).
In previous years diverse studies have been performed to use remote sensing tools not only for land use/land cover mapping especially but for various types of scientific studies (Gajbhiye and Sharma 2015; Sharma et al. 2012). Sharma et al. (2011b) investigated classified satellite images for LU/LC of Gusru river watershed in part of Panna and Satna district Madhya Pradesh and pointed that 88.03 percent area is under forest. A LU/LC map was prepared by Palanichamy (2018) for the Trichurapalli district of Tamil Nadu that classified six classes of LU/LC whose findings concluded that 39 percent of the area is under cultivation.
Keeping all such points in consideration a study has been undertaken at Nahara Nala watershed of Balghat district, Madhya Pradesh India for LU/ LC mapping using RS and GIS techniques. The main objective of this study was to use high spatial resolution SENTINEL-2B satellite image with subsequent assessment of its accuracy.
MATERIALS AND METHODS
Study Area
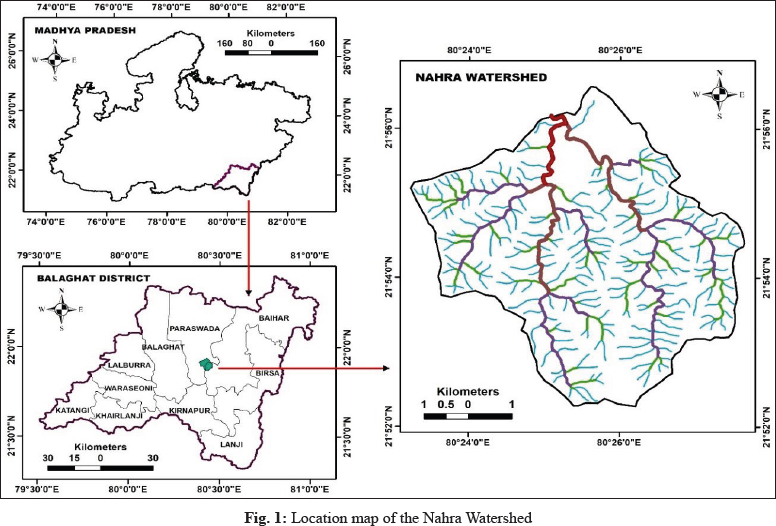
Nahra watershed lies between 21o54'00.84” & 21o55'41.49” N latitudes and 80o23'13.74” to 80o25'52.61” E longitudes in the central-eastern part of the Balaghat district. The Nahra nala watershed lies in the Wainganga basin, whose climate differs from Himalayan sub-tropical to sub-temperate. The total area of the watershed is 3490.66 ha. It receives an annual rainfall of 1295 mm as a result of the southwest monsoon from the midst of June to the midst of September. The temperature variation in watershed ranges from 43 °C during summer in the month of May to 8 °C in winters in the month of December (Patle et al. 2020). Fig. 1 shows the location map of Nahra watershed.
Geo-referencing and delineation of watersheds
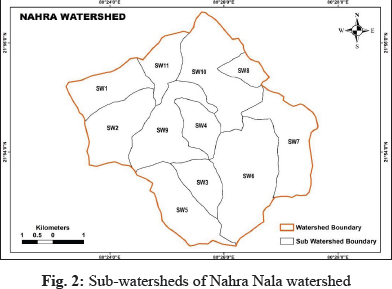
The delineation of Nahra Nala watershed was performed by employing toposheet No. 64 C/5 (OSM No. F44O5) of Nakshe Portal, Survey of India, on a scale of 1:50,000. The georeferencing of toposheet was implemented so as obtain the watershed boundary of Nahra watershed by digitizing in ArcGIS® 9.3 environment. The position of the outlet was set at the joining point of Nahra nala with the Malwara nala. The watershed was further sub-divided into 11 sub-watersheds. The categorization of these sub-watersheds for further delineation was accomplished on the basis of increasing stream order commencing from third-order stream to trunk order stream. The nomenclature of sub-watersheds was given as SW1, SW2, SW3, SW4, SW5, SW6, SW7, SW8, SW9, SW10, and SW11 (Patle et al. 2020) whose pictorial representation is depicted in Fig. 2.
Data Source / Information about Image
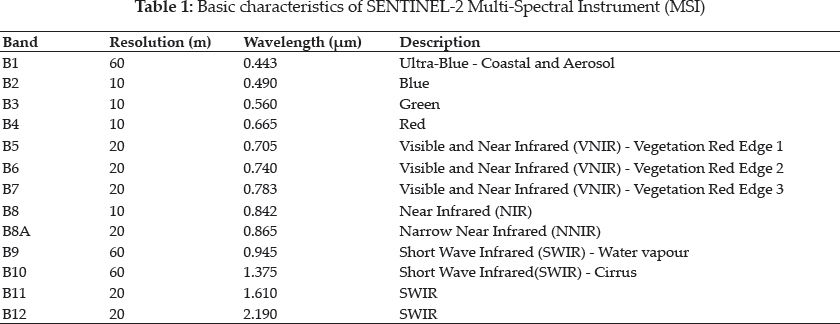
SENTINEL-2B MSI (Multi-Spectral Instrument, Level-1C) remotely sensed data were used for LU/LC classification. This satellite image was downloaded from the USGS Earth Explorer portal, having a data acquisition date of 14 January 2020. The SENTINEL-2 mission was developed by the European Space Agency (ESA) as a part of the Copernicus program. The mission's wide swath, fine spatial resolution (10 m - 60 m), multi-spectral features (13 spectral bands), and frequent revisit time (10 days at the equator with one satellite and 5 days with two satellites) support monitoring vegetation changes within a growing season, forest monitoring, land cover change detection, and natural disaster management. SENTINEL-2B carries an optical instrument payload that samples 13 spectral bands: four bands at 10 m, six bands at 20 m, and three bands at 60 m spatial resolution. The orbital swath width is 290 km. The spectrum characteristics of the Sentinel 2 images have been briefly tabulated in Table 1.
Classification Procedure
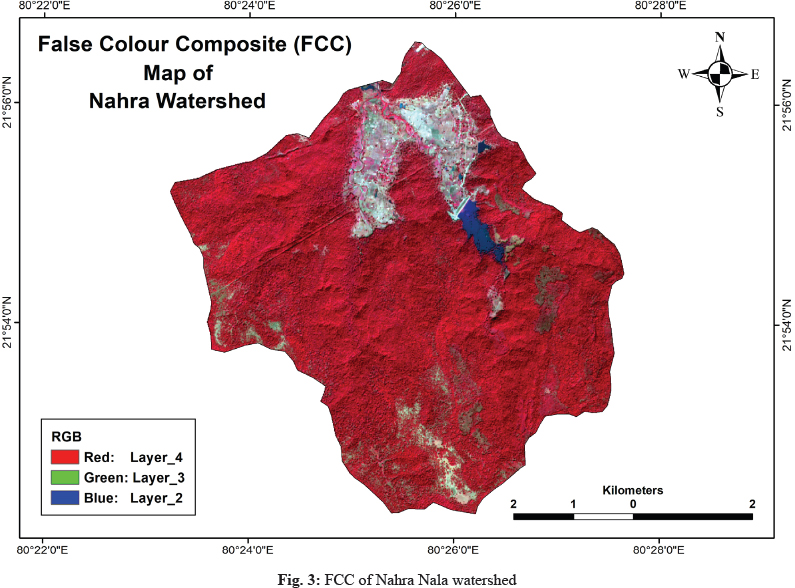
In this study, a SENTINEL-2B satellite image T44QMK with data of acquisition 14 January 2020 without any cloud cover was utilized for LU/LC mapping. Preprocessing techniques (i.e., atmospheric corrections) were applied to generate reflectance file using ERDAS IMAGINE® 2011 software. For SENTINEL-2B, band B2 (blue), B3 (green), B4 (red), and B8 (NIR) were chosen to prepare RGB composite image in such a manner that False Color Composite (FCC) image can be attained by changing its band combination. FCC image of the study area was prepared using boundary shape file to clip the study area using the area of interest (AOI) from all the adjacent scenes. Fig. 3 shows FCC of Nahra Nala watershed.
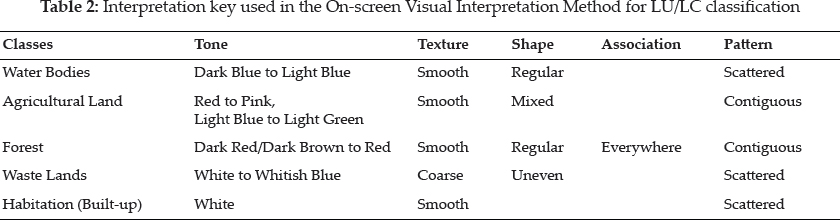
Primarily, the unsupervised classification method was used for making the broad categories, according to NRSC (2019) guidelines. Then the satellite image was classified by onscreen visual interpretation technique, based on the available ancillary data, prior knowledge, and sufficient ground truth points using ERDAS IMAGINE®2011 software. The multi-spectral characteristics of different class types i.e., variation in tone, texture, shape, association, the pattern of various objects within the satellite data, formed the basis for classification (Table 2).
After the visual interpretation, five major classes were identified, viz. water bodies, agricultural land, forest, wasteland, and habitation (built-up). Then, area of interests (AOI) of all classes (such as water bodies, agricultural land, forest, wastelands, and habitation) was prepared using ERDAS IMAGINE®2011 software linked with Google Earth Pro. Unsupervised classification was employed using FCC image. All AOI files were further applied or recoded on the unsupervised classified image so as to obtain thematically recoded raster files. Furthermore, the area beneath each class of LU/LC was assessed in units of ha.
Accuracy Assessment
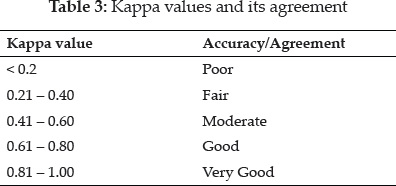
In remote sensing, a confusion matrix (error matrix) is often used to estimate the classification accuracy. A total of 134 accuracy assessment points were created over the entire study area using ArcGIS® 9.3 environment. This accuracy assessment points provided information about the classified value of the raster file. The classified value of this raster data was compared with the ground truth value (actual value) obtained from Google Earth Pro. Moreover, the confusion matrix was used to calculate the classification's accuracy. User's accuracy, Producer's accuracy, and Kappa coefficient were obtained from the error matrix. Such aforesaid parameters aided in evaluating the overall accuracy of LU/LC classification. Table 3 clearly depicts different ranges of Kappa coefficients and their corresponding characteristics.
Formula:
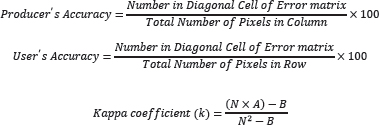
Where,
N = Total Number of Pixels Used for Accuracy Assessment; A = Total Number of Correctly Classified Pixels; B = (Total Number of Row X Total Number of Columns)

RESULTS AND DISCUSSION
Land is one of the most vibrant accepted natural resources. The study of LU/LC classification is necessary for the planning of natural resource management. Land use refers to people's activities in land for various uses which are carried out on land etc. Land cover depicts the natural vegetation, water bodies, rocks, etc., that resulted due to land transformation (Patle and Awasthi 2019). Five major classes were identified in Nahra nala watershed such as water bodies (i.e., streams, ponds, and reservoirs), agricultural land (i.e., cropland, fallow land), forest (i.e., dense/closed and open category of evergreen forest, scrub forest), wastelands (i.e., barren rocky scrubland) and habitation (i.e., built-up, rural).
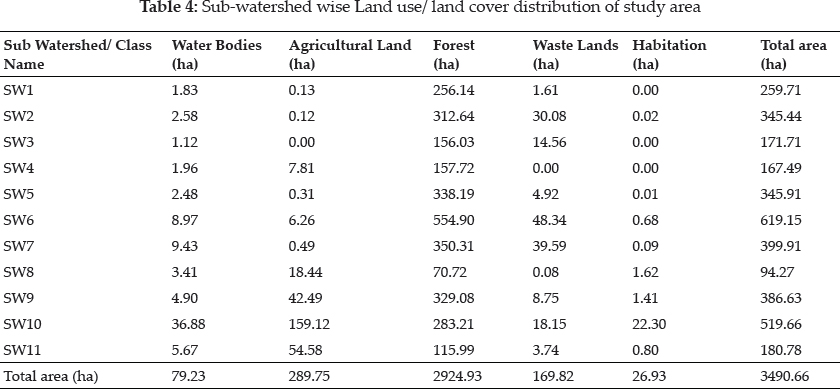
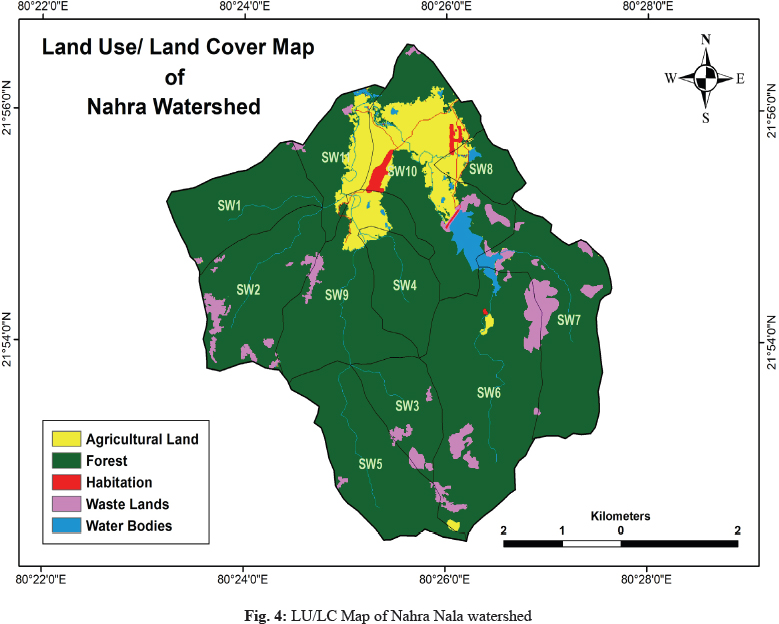
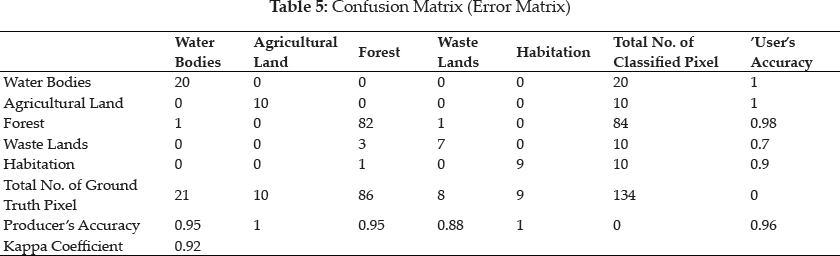
Fig. 4 depicts the land use land cover pattern of the Nahra nala watershed. LU/LC map shows that about 83.79 % area of Nahra watershed predominates under the forest category. Water bodies constitute an area of 2.27%, agricultural land with an area of 8.30%, wastelands cover an area of 4.87% and habitation (built-up) with 0.77% of the total area. Analyzing sub-watershed-wise LU/ LC mapping of study area was also executed that has been clearly depicted in Table 4. To support the results of the remotely sensed image, overall and class-wise accuracy was assessed. The overall accuracy and Kappa coefficient were found to be 95.52% and 0.92, respectively, for the Nahra Nala watershed. The producer's accuracy and user's accuracy for all classes were obtained (Table 5). Accuracy measures given in Table 5 indicated that even for a complex scene considered in the study area with water bodies, agricultural land, forest, and habitation (built-up) as different classes, high accuracy standards were obtained for classification. These numerically derived values advocated this research with a very good kappa coefficient along with excellent overall accuracy.
CONCLUSION
Satellite image with the fine spatial resolution is highly advantageous in observing the earth features, which further aids in identifying areas of improvement for maximizing the outputs from land resources. The aim of the present study was to map LU/LC in Nahra nala watershed of Balaghat district, Madhya Pradesh. The subsequent evaluation of classification using numerically derived variables such as kappa coefficient, overall accuracy, producer's accuracy and user's accuracy helped in assessing the magnificence of classification. This successful demonstration of SENTINEL-2B image for LU/LC mapping yielded an overall accuracy of 95.52 % and Kappa coefficient (k) of 0.92. The application of SENTINEL-2B data in the areas of research has also gained massive acceptance due to its fine spatial resolution and improved spectral resolution in NIR region, providing wide-ranging applicability for classification, mapping, and monitoring purposes. The SENTINEL-2B satellite image plays a vital role for policymakers and planners while investigating small-scale areas like watershed, village, block, etc. LU/LC map preparation in this study area can be further employed for inland degradation monitoring, assessment, and reclamation. This study will help to identify and synthesize LU/LC related needs and requirements. Hence, LU/LC mapping through fine resolution images will also be useful in natural resource management in habitat protection, biodiversity, agricultural dynamics, and forestry.
REFERENCES
Awasthi, M.K. and Patle, D. 2019. Water harvesting in kharif fallow for augmenting ground water recharge. 4th International Conference on Soil and Water Resources Management for Climate Smart Agriculture, Global Food and Livelihood Security. SCSI Journal. Soil Conservation Society of India, New Delhi.
Bisen, S., Choudhary, P., Awasthi, M.K. and Patle, D. 2019. Kharif Fallow Utilization for Groundwater Recharge. Int. J. Curr. Microbiol. Appl. Sci., 8(12): 284–290.
Demirkan, D.C. and Duzgun, H.S. 2017. Land Use and Land Cover Classification of Sentinel 2-A Images. Thesis.
Gajbhiye, S. and Sharma, S.K. 2015. Application of remote sensing and GIS approach for prioritization of watershed through sediment yield index. Int. J. Innov., 1.
Gajbhiye, S., Sharma, S.K., Tignath, S. and Mishra, S.K. 2015. Development of geomorphological erosion index for Shakker watershed. J. Geol. Soc. India, 86(3): 361–370.
Manakos, I. and Lavender, S. 2014. Remote sensing in support of the geo-information in Europe. Remote Sensing and Digital Image Processing, 18.
Meshram, S.G. and Sharma, S.K. 2018. Application of principal component analysis for grouping of morphometric parameters and prioritization of water shed. Hydrological Modeling, Select proceedings ICWEES-2016 (Springer). Editors: Singh V.P., Yadav Shalini and Yadav Ramnarayan, pp. 447–458.
Meshram, S.G., Sharma, S.K. and Tignath, S. 2017. Application of remote sensing and geographical information system for generation of runoff curve number. Applied Water Science, 7(4): 1773–1779.
Nema, S., Awasthi, M.K. and Nema, R.K. 2017. Spatial and temporal ground water responses to seasonal rainfall replenishment in an alluvial aquifer. Biosc. Biotech. Res. Comm., 10(3): 431–437.
NRSC. 2019. Land Use / Land Cover database on 1:50,000 scale, Natural Resources Census Project, LUCMD, LRUMG, RSAA, National Remote Sensing Centre, ISRO, Hyderabad.
Palanichamy, A. 2018. Land use / Land cover mapping in analysis of Tiruchirappali district Tamilnadu using Geoinformatics. Int. J. Latest Trends Eng. Tech., 9(4): 161–165.
Pathak, R., Awasthi, M.K., Sharma, S.K., Hardaha, M.K. and Nema, R.K. 2018. Ground water flow modelling using MODFLOW-A review. Int. J. Curr. Microbiol. Appl. Sci., 7(2): 83–88.
Patil, R.J., Sharma, S.K., Tignath, S. and Sharma, A.P.M. 2017. Use of remote sensing, GIS and C++ for soil erosion assessment in Shakker river basin, India. Hydrolog Sci J. 62(2): 217–231.
Patle, D. and Awasthi, M.K. 2019. Groundwater Potential Zoning in Tikamgarh District of Bundelkhand Using Remote Sensing and GIS. In. J. Agr. Env. Biotech., 12(4): 311-318.
Patle, D., Rao, J.H. and Dubey, S. 2020. Morphometric Analysis and Prioritization of Sub-Watersheds in Nahra Watershed of Balaghat District, Madhya Pradesh: A Remote Sensing and GIS Perspective. J. Exp. Biol. Agric. Sci., 8(4): 447–455.
Rao, J.H., Hardaha, M.K. and Vora, H.M. 2019. The Water Footprint Assessment of Agriculture in Banjar River Watershed. Cur. World Environ., 14(3): 476 - 488.
Rao, J.H., Patle, D. and Dubey, S. 2020. Implementation of Morphometric analysis in prioritizatizing sub-watersheds: A remote sensing and GIS aspect. Indian J. Pure Appl. BioSci., 8(4): 318–329.
Sharma, S.K., Tignath, S. and Mishra, S.K. 2008. Morphometric analysis of Drainage basin using GIS approach. JNKVV Res. J., 42(1): 91–95.
Sharma, S.K. and Seth, N.K. 2010. Use of Geographical Information System (GIS) in assessing the erosion status of watersheds. Sci-fronts A Journal of Multiple Science, 4(4): 77–82.
Sharma, S.K., Seth, N.K., Tignath, S. and Pandey, R.P. (2011a) Use of Geographical Information System in hypsometric analysis of watershed. J. Indian Water Resources Socie., 31(3-4): 28–32.
Sharma, S.K., Seth, N.K., Tignath, S. and Shukla, J.P. 2011b. Land use/Land cover mapping of Gusuru river using Remote Sensing & GIS technique JNKVV Res. J, 45(1): 125-128.
Sharma, S.K., Pathak, R. and Suraiya, S. 2012. Prioritization of sub-watersheds based on morphometric analysis using remote sensing and GIS technique. JNKVV Res. J., 46(3): 407-413.
Sharma, S.K., Gajbhiye, S., Tignath, S. and Patil, R.J. 2018. Hypsometric Analysis for Assessing Erosion Status of Watershed Using Geographical Information System, pp. 263–276. https://doi.org/10.1007/978-981-10-5801-1_19.
Sharma, S.K., Gajbhiye, S., Nema, R.K. and Tignath, S. 2015. Assessing Vulnerability to Soil erosion of a Watershed of Narmada basin using Remote Sensing and GIS. Int. J. Innov., 1: 295.