Economic Affairs, Vol. 65, No. 3, pp. 371-378, September 2020
DOI: 10.46852/0424-2513.3.2020.8
![]()
Inter-Temporal Production Performance of Pulse Crops: In Indian Context
ABSTRACT
The present study investigates to growth and relative contribution of area and yield in production of green gram, black gram chickpea, pigeon pea and lentil pulse crops in India. The study period (1998-99 to 2017–18) is divided into three periods viz., period-I (1998-99 to 2007–08), period-II (2008-09 to 2017–18) and period-III (1998-99 to 2017–18). Time series data on area, production and yield were collected from Directorate of Pulses Development, Bhopal, Directorate of Economics and Statistics, Department of Agriculture and Cooperation, Government of India. The semi-log model, Cuddy-Della Valle instability index and decomposition analysis models were used to analyze the CAGR, instability and relative contribution of area, yield and interaction components. The study clearly finds that area and production of green gram (Vigna radiata) is notified highest compound annual growth rate 1.84 and 1.76 percent respectively, during period-I. In case of yield highest growth rate is reported in black gram (0.26 percent) during the same period. During second period, highest CAGR in area, production and yield is found in black gram at 6.00, 10.30 and 4.10 percent respectively. During all three periods, instability in area, production and yield was very low, except total pulse in second period. The decomposition analysis of production is revealed that yield effect and area effect are major sources of output growth in kharif and rabi pulses, respectively. The Identified growth rate in individual pulse crop is a great informative work because it provides chronological background of how the cultivation of pulses persuades the life of farmers either in negative or positive way. The study also tries to know the peak or trough in past cultivation of pulses crops.
Highlights
 Less instability was reported in area, production and yield of pulse crops
Area and yield are major source of decomposition in pulses.
Keywords: Decomposition analysis, Growth rate, kharif pulses, Production, rabi pluses, Yield
Pulses are the basic ingredient in the diet of a vast majority of Indian livelihood. The country grows a wide variety of pulses crops such as Chickpea (Cicer arietinum), Pigeon pea (Cajanus cajan) green gram (Vigna radiata), black gram (Vigna mungo), cowpea (Vigna unguiculata), pea (Pisum sativum), moth bean (Vigna acontifolia), grass pea (Lathyrus sativus), horse gram (Macrotyloma uniflorum) and lentil (Lens culinaris) under rain-fed conditions, which are having poor fertility and moisture stress. Pulse crops are energy rich like proteins, vitamins, etc. but their cultivation required minimum energy such as nutrient, rainfed conditions etc. Pulses are major source of protein, fatty & essential amino acids, minerals, fibers, and vitamins. in human diet for the poor and vegetarian livelihood in the country. Therefore, pulses are popularly known as "Poor man’s meat” and “rich man’s vegetable" (Singh, et al. 2015). Pulses are a Smart Food, as these are critical for food basket (Pulse-Bread, Pulse-Rice), rich source of protein i.e. 20–25%. The United Nations, declared 2016 as “International Year of Pulses” (IYP) to heighten public awareness of the nutritional benefits of pulses as part of sustainable food production aimed at food security and nutritional (Kumar et al. 2018). When farmers include pulse crops in their cropping system, the yield of component crop increased significantly (Kumar and Bourai, 2012). Biological nitrogen fixation and improvement in soil physical condition enhance the production potential of the cropping system, which resulted pushup the gross and net monetary income of the farming community (Agarwal, et al. 2011). The rain-fed regions of the country support 40% of human population and 2/3rd of livestock, 90% of coarse cereals, 80% pulses, 74% oilseeds, 65% cotton and 48% rice are rain-fed. About 52 per cent of total net sown area (141.40 million ha) is rain-fed in India (Anonymous, 2017–18).
How to cite this article: Bairwa, K.C., Balai, H.K., Meena, G.L., Prasad, D. Kumari, Y., Singh, H. and Yadav, A. (2020). Inter-Temporal Production Performance of Pulse Crops: In Indian Context. Economic Affairs, 65(3): 371–378.
Source of Support: None; Conflict of Interest: None ![]()
It was found out from the results of the studied area that reduction in the consumption of pulses, leads to the increasing malnutrition and deficiency in protein intake (Shalendra et al. 2013). India is still a home of about 24% of undernourished people in the world (Sharma et al. 2016). The shortfall in pulses has been attributed to a number of factors, the major ones being the increasing population, rising income, socio-economic conditions and poor marketing opportunities (Srivastav et al. 2010). Thus, poor production performance has not only created an imbalance in demand and supply of pulses but also has resulted in soaring import bills, unpredictable price rises and low net profit compared to their competing crops (Joshi and Saxena, 2002). During pre-green revolution period area, yield and production of total pulses registered a positive but non-significant growth rate indicated stagnation (Jain and Singh, 1991).
During 2017–18, share of pulses in total food grain area and production were 29.36 per cent and 8.61 per cent, respectively, in the country. In total pulses production of India, about 63 percent share is contributed by rabi pulses in 2017–18 (Anonymous, 2017–18). India is the largest producer and consumer of pulses in the world. The country is not able to keep pace with the domestic demand even with cultivating 29 million hectare area under pulses. The pulses availability (54.5 gram/capita/day) in India, is less than recommended intake (65 gram/capita/day) of Indian Council Medical Research, New Delhi. Mostly pulses crops are labour intensive along with other inputs. Therefore, a major challenge in India is to provide an improved production technology for achieving sustained production of pulses. The present study is conducted to answer the research questions such as whether there is significant growth in the area, production and yield of pulses over the period, whether the area, production and yield of pulses are instable in nature, what is the contribution of area and yield towards change in total pulses production and trade performance in India.
MATERIALS AND METHODS
The present study is primarily based on secondary data collected from various published sources like Directorate of Economics and Statistics, Department of Agriculture and Cooperation, Gol, Directorate of Pulses Development, Bhopal, Gol, Various issues of Agriculture Statistical Year Book and Agricultural Statistics at a Glance, etc. The selection of study period is mainly based on availability of data. The entire study period has been divided into three periods viz., period-I (1998-99 to 2007–08) and period-II (2008-09 to 2017–18) and Overall study Period (1998-99 to 2017–18). This study is restricted to major kharif and rabi pulses crops of India viz., Green gram, Black gram, Pigeonpea, Chickpea and Lentil. Selected crops account for more than 85 per cent of total pulses cropped area and production.
Compound Annual Growth Rate: the production pattern of pulses was investigated using tabular analysis and compound annual growth rate (CAGR). The growth rate is generally calculated by using linear growth rate and Compound Annual Growth Rate (CGR) models. The major limitation of linear growth rate is performed the comparison of growth rates between periods and crops. Therefore, it is better to use the compound annual growth rate model for computing growth rate of selected pulse crops for three periods. A semi-log trend model is applied to compute the growth in acreage, output and yield of individual pulse crop:
Qt = Qo (1 + r)t
Transformed this to logarithmic form, ln Yt = ln Y0 + t ln (1 + r)
Where,
Qt is the variable for which growth is calculated at tth period
r is the compound growth rate
ln is the natural logarithm
Now, let ln Q0 = β1 and
ln (1 + r) = β2
Therefore, the above equation becomes, ln Qt = β1 + β2 t
Now, β1 and β2 will be estimated by Ordinary Least Squares (OLS) method and the CAGR will be, r = (antilog β2 - 1) x 100
Instability Analysis: The instability in area, production, yield of major pulses is calculated by using Cuddy-Della Valle instability index. It was developed by Cuddy and Della Valle in 1978 to study over the period. Cuddy-Della Valle index is worked out as:
Where,
I is the instability index (%),
CV is the coefficient of variation (%), and
R2 is the coefficient of determination from a time trend regression adjusted by the number of degrees of freedom.
This is a better measure compared to coefficient of variation, as it is innately adjusted for trend, often observed in time series. It helps to know the variability and risk in production of pulse crops.
Decomposition analysis: It is used to compute the relative contribution of factors as area and productivity in total output of individual pulse crop.
Various researchers (Devi, et al. 2017; Ruchi, 2017; Kamble and Wali, 2016 and Bastine & Palanisami, 1994) applied component analysis model to examine the growth performance of different crops. The general outline of decomposition model is given below:

Where Q = production of selected pulses crops in in India
A = area under the same crop production
P = Yield of selected pulse crop Then,
Then,


where 0 and t is time periods such that t>0 by an accounting period (usually single year)
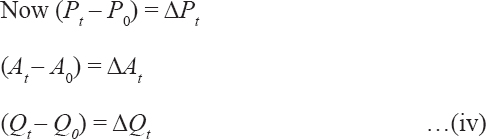
Now substituting the terms represented in (iv) equation into (iii) equation:
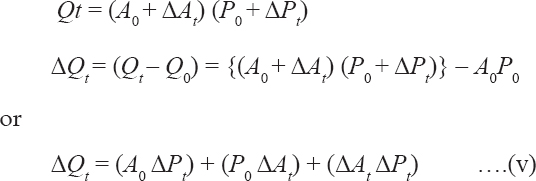
(Change in production) = Yield effect + Area effect + Interaction effect
Thus, the total change in production is attributed due to area and yield that can be decomposed into three effects viz., yield, area and interaction effects.
RESULTS AND DISCUSSION
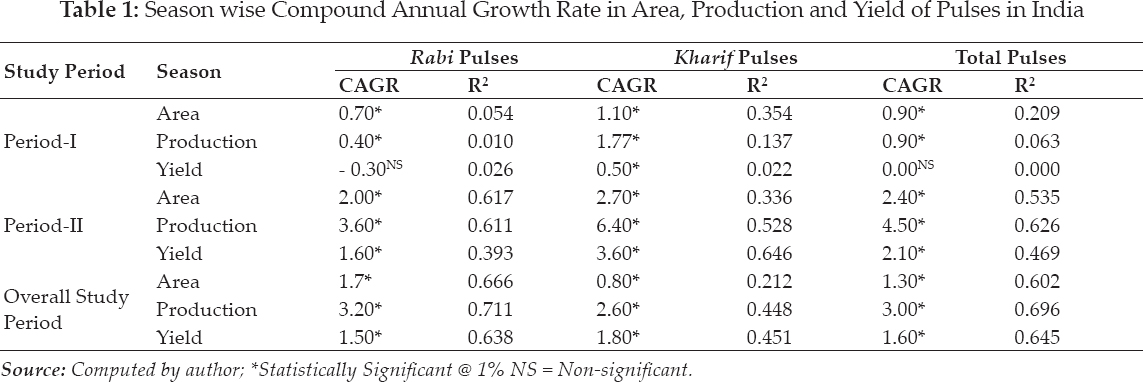
Growth rate of area, production and yield: The compound growth rate of area, production and yield of chickpea, pigeonpea, green gram, black gram and lentil for the study period from 1998–99 to 2017–18 were calculated. Season wise result of compound annual growth rate for whole country is presented in table 1 for different period namely 1998-99 to 2007–08, 2007–08 to 2017–18 and 1998–99 to 2017-18. During first period, the CAGR in area and production of total kharif pulses was 1.10 and 1.77 per cent respectively, which was higher than rabi and total pulses. During this period, the main source of growth in kharif pulses production was growth in area of kharif pulses. During 2008–09 to 2017–18, the compound annual growth rate of kharif pulses production was 6.4 per cent, which was higher than the rabi and total pulses production.
The compound annual growth rate of area, production and yield of individual pulse crop is presented for different study periods viz., period-I
However, during this period the growth in production was mainly due to growth in yield, the improved coverage of fertilizer, irrigation and institutional reforms played important role in increasing yield. During whole study period (199899 to 2017–18), the CAGR in production of rabi crops was 3.20 per cent followed by 3.00 and 2.60 per cent in total and kharif pulses production respectively. (1998-99 to 2007–08), period-II (2007-08 to 2017–18) and overall (1998-99 to 2017–18 0 in table 2. During first period, the CAGR in area and production of green gram was 1.80 followed by chickpea, pigeonpea, black gram and lentil at the same period. During this period, the main source of growth in green gram production was mainly due to growth in area of green gram. The highest growth rate was notified in production of black gram 10.30 per cent followed by green gram (8.20), pigeonpea (5.80) chickpea (3.00) and lentil (1.80) in second period (2008-09 to 2017–18). However, during this period the growth in production was contributed due to increase in area and yield of crops. Growth in minimum support price of pulses is painstaking to farmers for increasing area whereas the improved coverage of fertilizer, irrigation and institutional reforms played important role in increasing yield of pulses.
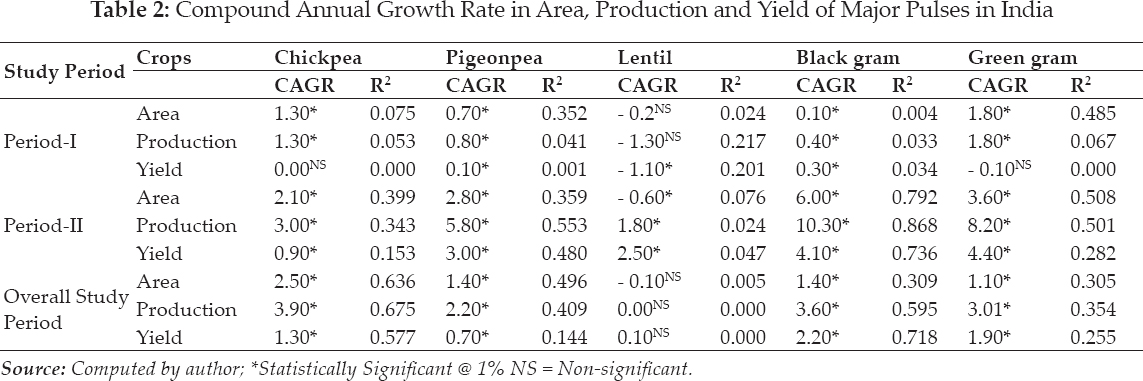
During whole study period (1998-99 to 2017–18), the CAGR in production of black gram, chickpea and green gram was more than 3 per cent. The growth in production of black gram and green gram was effective due to growth in yield and chickpea production was increased mainly growth in area.
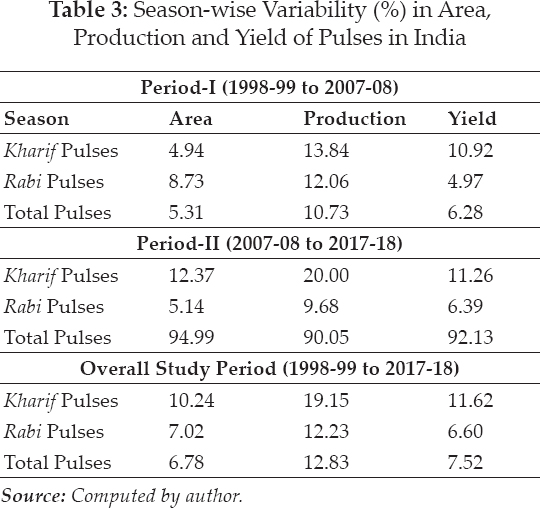
Variability in area, production and yield of major pulses: The instability in area, production, and yield of kharif, rabi total pulses was analyzed and presented in table 3. It is revealed from the table that area, production and yield of kharif, rabi and total pulses were found highly stable with very low variability indices in period-I. The highest instability of 94.99, 90.05 and 92.23 percent in area production and yield was found in total pulses for the period-II. At the same time, variability in area, production and yield of kharif and rabi pulses was also found very low. In case of overall study period, instability in area production and yield of kharif, rabi and total pulses was found to be at highly stability indicated by very low coefficient of instability indices.
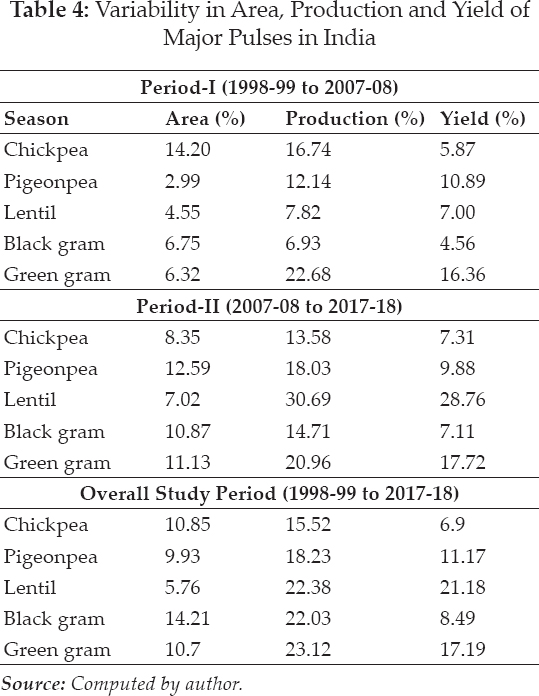
At national level, the instability in area, production and yield of chickpea, pigeonpea, lentil, black gram and green gram were computed and presented in table 4. During period-I highest instability of 22.68 per cent was found in production of green gram followed by 16.74 per cent in production of chickpea. At the same time, instability in area, production and yield of pigeonpea, lentil, black gram and green gram was recorded very low. The highest instability of 30.69 and 28.76 per cent was reported in production and yield of lentil during the period of 2007-08 to 2017-18. During 1998-99 to 2017-18, the highest instability of 23.12 per cent was recorded for production of green gram followed by 22.38 per cent in lentil production.
Sources of growth in Production: The growth rate analysis of area, production and yield of pulses revealed the normal pattern of growth and direction of changes in yield and area. However, the contribution of area and yield towards the production growth of pulses do not examine by this analysis. Therefore, it is necessary to analyze the sources of growth in production. To compute the source of output growth in different season’s viz., kharif and rabi seasons, the change in production is split up into area, yield and interaction effects. The season wise change in pulses production due to relative contribution of area, yield and interaction is presented in table 5. The results of decomposition analysis for different study periods show that during first period area and yield effects were more dominant in rabi crops than kharif pulses. The contribution of area in growth of rabi and kharif was 70.77 and 36.10 per cent while that of yield effect was 59.05 and 43.10 per cent respectively.
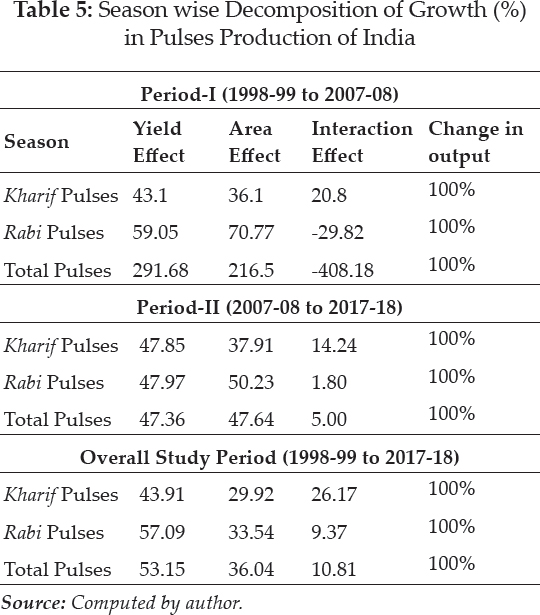
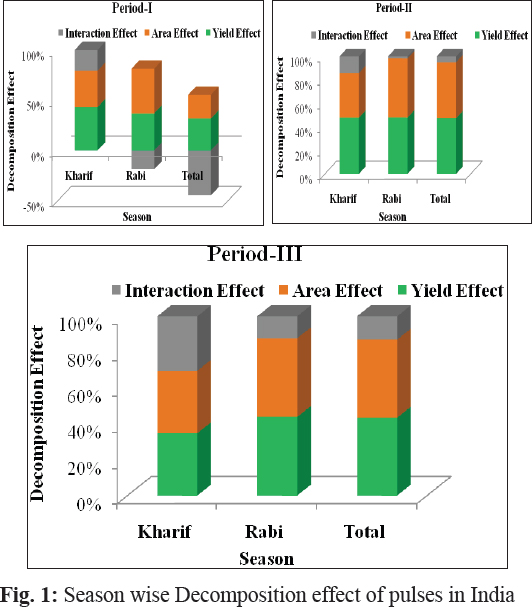
In the second period 2007–08 to 2017–18, the area effect and yield effect were dominant in rabi and kharif seasons respectively. The area effect and yield effect were 50.23 per cent and 47.97 per cent whereas yield effect was 47.85 per cent and 37.91 per cent for rabi and kharif respectively. During overall study period yield and area effect was also more dominant for rabi crops than kharif. The yield effect was 57.09 per cent and 43.91 per cent for rabi and kharif seasons respectively.
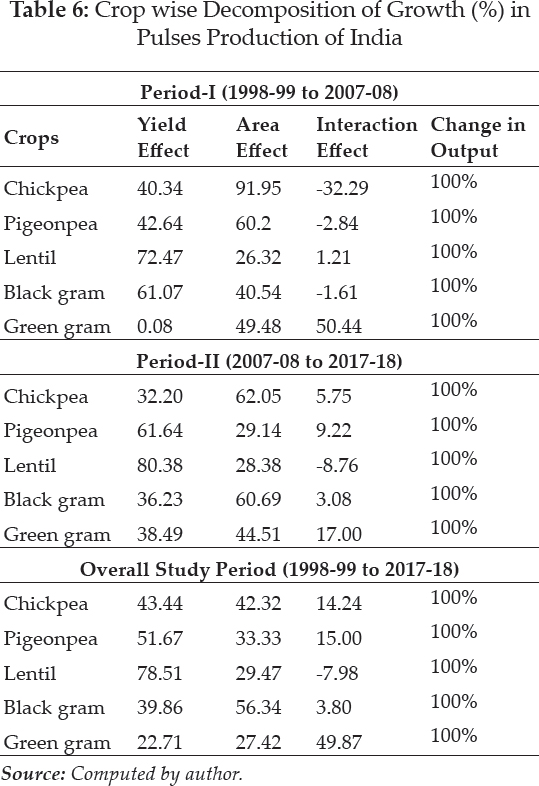
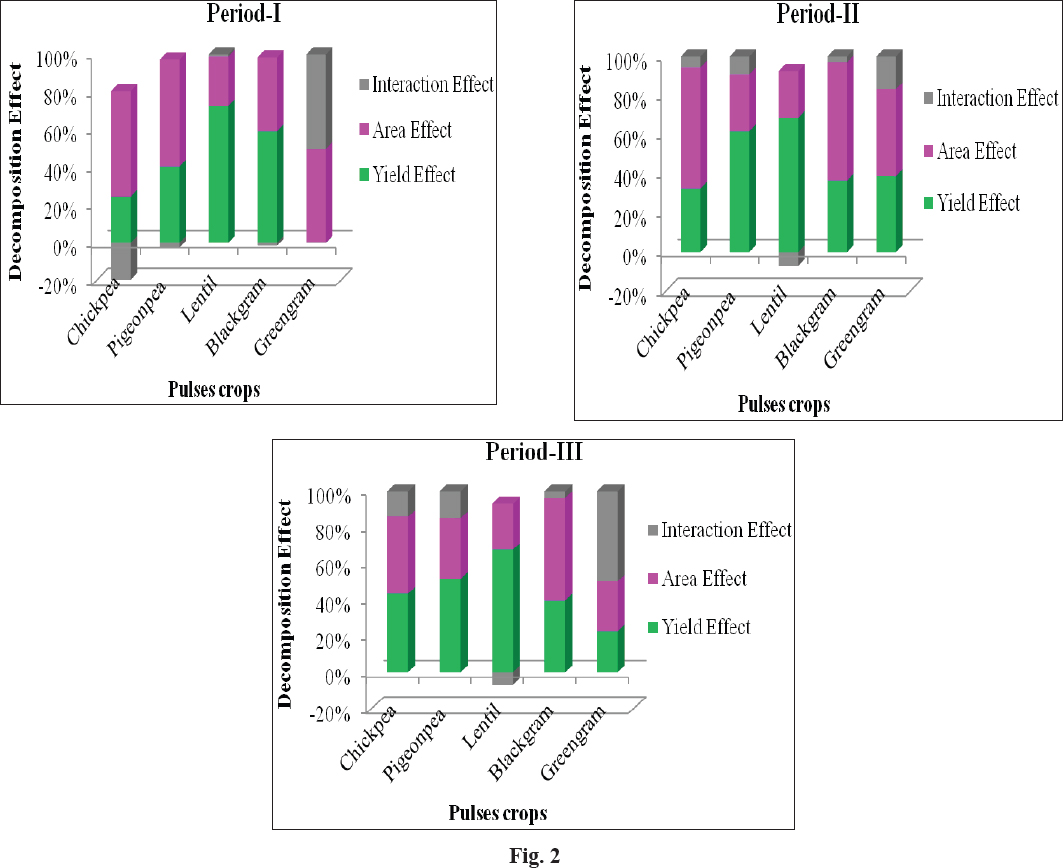
The output of decomposition analysis of major pulses is presented in table 6. It is revealed the result that during first period area effect and yield effect was more dominant in chickpea and lentil production changed than other crops. The highest contribution in production changes was observed 91.95 per cent and 72.47 per cent in chickpea and lentil respectively. Just like first period, area effect and yield effects were also more effective for chickpea and lentil crops.
The largest and lowest contribution of area in growth of chickpea and lentil was 62.05 per cent and 28.14 per cent respectively, while interaction effect was dominant for green gram (50.44 per cent). During overall selected study period; yield effect was contributed dominantly in growth for chickpea, pigeonpea, green gram and lentil while area effect was effectively contributed in growth of production of black gram.
CONCLUSIONS
The present study clearly found that highest and lowest compound annual growth rate in production is examined at 1.80 and -1.30 percent in green gram and lentil respectively, in period-I. During second period, highest growth rate in production is reported for black gram and lowest growth rate is found out for lentil as in period-I. During whole study period improved growth rate in area and production is examined at 2.50 and 3.90 per cent in chickpea. The highest growth rate for yield is reported in black gram (2.20 per cent) respectively. During the study period-I and III, instability in area, production and yield of kharif and rabi seasons was very low. The decomposition analysis of production suggested that during first and second period area effect and yield effect was major was major source of growth in production of chickpea and lentil respectively.
REFERENCES
Agarwal, P.K., Singh, O.P. Verma, D.K. Shushila, K. and Sen, C. 2011. Growth and instability of pulses in India.
Anonymous 2017–18. Directorate of Economics and Statistics, Department of Agriculture and Cooperation, Government of India.
Basitine, C.L. and Palanisami, K.P. 1994. An analysis of growth trends in principal crops in Kerala.
Constraints: A case study of sample villages of Assan valley of Uttarakhand, India.
Cuddy, J.D. and Valle, P.A.D. 1978. Measuring the instability of time series data.
Devi, Y.L., Arivelarasan, T. and Kapngaihlian, J. 2017. Pulses production in India: Trend and decomposition analysis.
Jain, K.K. and Singh, A.J. 1991. An economic analysis of growth and instability in pulses production in Punjab.
Joshi, P.K. and Saxena, R. 2002. A profile of pulses production in India: Facts, trends and opportunities.
Kamble, A.S. and Wali V.B. 2016. Dynamics of horticulutral crops in Karnataka an hazel decomposition analysis.
Kumar, N.S.P., Radha, Y., Rao, D.V.S., Rao, V.S. and Gopikrishna, T. 2018. Growth and Instability of pulses production in Andhra Pradesh.
Ruchi 2017. Food grains in India: Growth, instability and decomposition analysis.
Shalendra, K.C., Gummagolmath, Sharma, P. and Patil, S.M. 2013. Role of pulses in the food and nutritional security in India.
Sharma, P., Dwivedi, S., Singh, D. 2016. Global povery and malnutrional analysis. (in): Singh, U, Praharaj, C., Singh, S. N. (eds)
Singh, A.K., Singh, S.S., Prakash, V. Kumar, S. and Dwivedi, S.K. 2015. Pulses production in India: present status, bottleneck and war forward.
Srivastav, S.K. Sivaramane, N. and Mathur, V.C. 2010. Diagnosis of pulses performance of India.