International Journal of Agriculture, Environment and Biotechnology
Citation:
DOI: 10.30954/0974-1712.03.2020.8
![]()
GENETICS AND PLANT BREEDING
Nonparametric Measures of Stability Analysis Compared as Per BLUP & BLUE of Wheat Genotypes for Central Zone of Country
ABSTRACT
Stability for wheat genotypes had been compared in Central Zone of the country as per the BLUP and BLUE of yield values. Measures based on ranks of BLUP for 2015–16 i.e. Sis identified G1, G5, G7, G6. Corrected yield measures CSis pointed towards G1, G2, G5, G6. Values of NPi(s) identified G1, G2, G7. Overall similarity among non-parametric measures tested by Kendall’s coefficient of concordance. Positive correlations of Sis, CSis & NPi(s) observed with other measures. Biplot analysis exhibited cluster of CV with CCV, Si1, S2,’ Si4, S5, Si7 , S3, Si6, NPi(2), NPi(3) & NPi(4). Based on BLUE’s of genotypes, Sis found G1, G7, G4, G5 while CSis identified G5, G4, G2 as opposed to G7, G1, G4 genotypes as by values NPi(s). Positive and negative correlations exhibited by Sis, CSis & NPi(s) with the measures. Biplot analysis observed large cluster comprised of Yield with GAI, NPi(2), NP(3), NP(4), Si1, S2, Si4Si3, Si5, Si6 measures. Second year of study (2017-18) as per BLUP’s seen, Sis settled for G8, G7, G2 genotypes’ While NPi(s) settled for G1, G2, G8, G5. Negative correlations of yield had been observed with MR, CV, Med, NPi(2), NPi(3), NPi(4) while positive with GAI, CMR, CSi6. Measure CV expressed affinity with NPi(2), NPi(3) & NP(4), SD, Si3, Si6, Si1, S2, Si4, Si5, Si7 in Biplot analysis.- Measures Sis as per BLUE’s pointed towards G2, G5,G8, G7 whereas CSis settled for G6, G8, G7. . Wheat genotypes G8, G2, G7, G5 favoured by least values of NPi(s). Positive correlation Sis, CSis & NPi(s) with others. Large cluster of CCV, CSD, NP(1), Si1, Si2, Si4, CSi1, CSi2, CSi3, CSi4, CSi5, CSi6, CSi7 and Z1measures.
Highlights
 Stability of wheat genotypes had been compared as per the BLUP and BLUE of yield values for Central Zone of the country.
Kendall’s coefficient of concordance resulted an overall similarity among rank-based measures based on BLUP for first year. Positive correlations of rank-based measures based on BLUP viz. Sis, CSis & NPi(s) with other measures.
While both type of correlations observed among measures as per BLUE of genotypes.
First two PCA’s based on BLUP’s account for more of G*E sum of squares as compared to corresponding components by BLUE.
Keywords: BLUP, BLUE, Si(s), CSi(s), NPi(s), Coefficient of concordance, Biplot analysis
Significant genotype-by-environment (G*E) interaction had been reported in large number of multi environmental studies (Pour et al. 2019). Cross over interaction masks the correlation between genotypic and phenotypic values of genotypes and hinders the selection of the promising genotypes (Mohammadi et al. 2016). Large number of statistical approaches, based on univariate and multivariate models, have been observed in literature to estimate stable performance of genotypes (Vaezi et al. 2018). There are two major categories to interpret genotype-environment interaction by numerical analysis. The first group contains parametric methods. These are primarily used to assess genotype stability by relating observed genotypic responses to number of environmental conditions (Khalili et al. 2016). Statistical assumptions i.e. normal distribution and homogeneity of variance of the errors and their interaction effectshave presumed under Parametric stability measures. Parametric measures would provide biased results under failure to satisfy these assumptions (Hühn and Leon 1995). The second group of analytical methods includes nonparametric methods. Non-parametric measures explain environments and phenotypes relative to both biotic and abiotic factors (Mortazavian et al. 2014). Ranks of the genotypes had been considered under Nonparametric measures to judge the suitability of genotypes (Nassar and Huhn 1987). These measures had been known as distribution free and no assumptions are required to satisfy (Rasoli et al. 2015). For many applications, including selection in breeding programs, the rank order of genotypes are the most essential data. There is ample justification for the use of nonparametric measures for the stability assessment of genotypes (Zali et al. 2011). Nonparametric procedures are based on the ranks of genotypes in each environment and stable genotypes possess similar ranking across environments (Farshadfar et al. 2014). Ranking classifies observations according to their values but not to their absolute differences. Different studies had used nonparametric measures of stability in the several literatures (Delić et al. 2009; Balalić et al. 2011; Karimizadeh et al. 2012; Mahtabi et al. 2013; Ahmadi et al. 2015; Rasoli et al. 2015; Khalili and Pour-Aboughadareh 2016).
How to cite this article: Verma, A. and Singh, G.P. (2020). Nonparametric Measures of Stability Analysis Compared as Per BLUP & BLUE of Wheat Genotypes for Central Zone of Country. IJAEB, 13(3): 323–337.
Source of Support: None; Conflict of Interest: None ![]()
The three defined objectives for current study was (1) analyse stability performance by nonparametric measures based on BLUP and BLUE of wheat genotypes yield (2) differentiate the performance pattern of wheat genotypes as per BLUP and BLUE values and (3) study the relationships, similarities and dissimilarities among non-parametric measures of stability.
MATERIALS AND METHODS
Seven promising wheat genotypes were evaluated in research field trials at 14 centers of All India Coordinated Research Project on Wheat across zone during 2015–16 and a set of nine genotypes at twelve centers for 2017–18 cropping season. Randomized block designs had been laid out in field evaluation of genotypes with four replications. Recommended agronomical practices as per zone had followed in total to harvest the good wheat yield of genotypes. Parentage details and environmental conditions were reflected in tables 1 & 2 for ready reference. Huehn (1990 a & b) proposed seven nonparametric methods for assessing G x E interaction and stability analysis. For a two-way dataset with k genotypes and n environments Xij. denotes the phenotypic value of ith genotype in jth environment where i = 1, 2, …k, j = 1, 2 n and rij as the rank of the ith genotype in the jth environment, and  as the mean rank across all environments for the ith genotype. Sabaghnia et al. (2012) proposed the correction for yield of ith genotype in jth environment as (X*ij = Xij -
  . + ..) as X*ij, was the corrected phenotypic value;
  . was the mean of ith genotype in all environments and .. was the grand mean. Generally used seven statistics based on ranks of genotypes yield and corrected yield were expressed as follows:
Non parametric measures for stability analysis proposed by Thennarasu (1995) as NRi(1), NRi(2), NRi(3) and NRi(4) based on ranks of corrected means of genotypes. In the formulas, r*ij. was the rank of X*ij, and and Mdi were the mean and median ranks for original (unadjusted) grain yield, where * and M*di were the same parameters computed from the corrected (adjusted) data.

Significance of Si(1) and Si(2) non parametric measures had been explored by Nassar and Huehn (1987). Z1 and Z2 values were calculated for each genotype, based on the ranks of adjusted data and then sum of i.e. Z1 sum and Z2 sum are distributed as x2. Degree of similarity among measures had assessed by estimating correlation coefficients while considering genotypes ranking. Spearman’s rank correlation values among pairs (Piephoand Lotito 1992) estimated as follows :
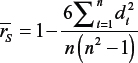
where di denotes difference between ranks for ith genotype and n is total number of pairs.
RESULTS AND DISCUSSION First year of study 2015–16
First year of study 2015-16
Analytic analysis as per BLUP's
Mean wheat yield observed, G5 as the highest yielding with 58q/ha followed by G2 and G4, though remarkable yield differences were observed among the genotypes (Table 3). Measure GAI selected G5, G2, G6 as genotypes with higher adaptable index values. The following three descriptive statistics; mean of ranks (MR), standard deviation of ranks (SD) and coefficient of variation of ranks (CV) were calculated for original ranks (Khalili et al. 2016). MR pointed towards G7, G1, G2 and SD for G1, G6, G5 whereas CV for G1, G7, G6 as genotypes of stable performance, while G5, G4 based on MR, G3, G4 based on SD and G5, G3 as per CV, would be unstable genotypes. These descriptive statistics based on ranks can be used for genotype comparative evaluation. Values of Median selected G7, G1, G2 genotypes.
Seven nonparametric measures based on original grain yield of genotypes (Si1, Si2, Si3, Si4, Si5, Si6 and Si7) indicated that (G1, G7, G6), (G1, G6, G5), (G1, G7, G6), (G1, G6, G5), (G1, G6, G5), (G1, G7, G6), (G1, G6, G5) as sets of genotypes respectively. According to corrected yield (table 8), G2, G5 & G1 by mean of corrected ranks (CMR), G5, G1 & G6 by standard deviation of corrected ranks (CSD) and G5, G1 & G2 were the stable as per coefficient of variation of corrected ranks (CCV). Nonparametric measures of stability based on corrected yield values (CSi1, CSi2, CSi3, CSi4, CSi5, CSi6, CSi7) identified stable genotypes (G5, G1, G6), ‘(G5, G1,G6), (G5, G1, G2), (G5, G1, G6), (G5, G2, G1), (G5, G2, G1), (G1, G5, G6) and G7, G3 were of unstable nature (Sabaghnia et al. 2012). NPi(1) considered genotypes G5, G1, G6 of stable yield. G1, G2 and G7 had expressed the lower values of NPi(2) whereas as per NPi(3) & NPi(4) values genotypes G1, G7, G2 would be of stable performance. Z1 and Z2 pointed for G2, G4, G6 as of suitable performance.
Calculated value of Kendall’s coefficient of concordance (W=0.40) and for the significance of W value the magnitude of x2 = 72.3 statistics was less than table of x2 (0.01, 290) = 135.8, which resulted an overall similarity among non-parametric measures (Vaezi et al. 2018). For ensuring significance of CSi1 and CSi2 measures, Z1 and Z2 values were calculated based on the ranks of adjusted data and then summed: Z1 sum = 10.3 and Z2 sum = 13.4 (Table 4). Both these statistics are distributed as x2 and were less than the critical value of x2 (0.05, 29) = 42.6. This indicated the non-significant differences among genotypes as per ranks of CSi1 and CSi2 measures. HD4728 was significantly unstable as compared to others due to Z values more than the critical value of x2 (0.05, 1) = 3.84.
Association analysis
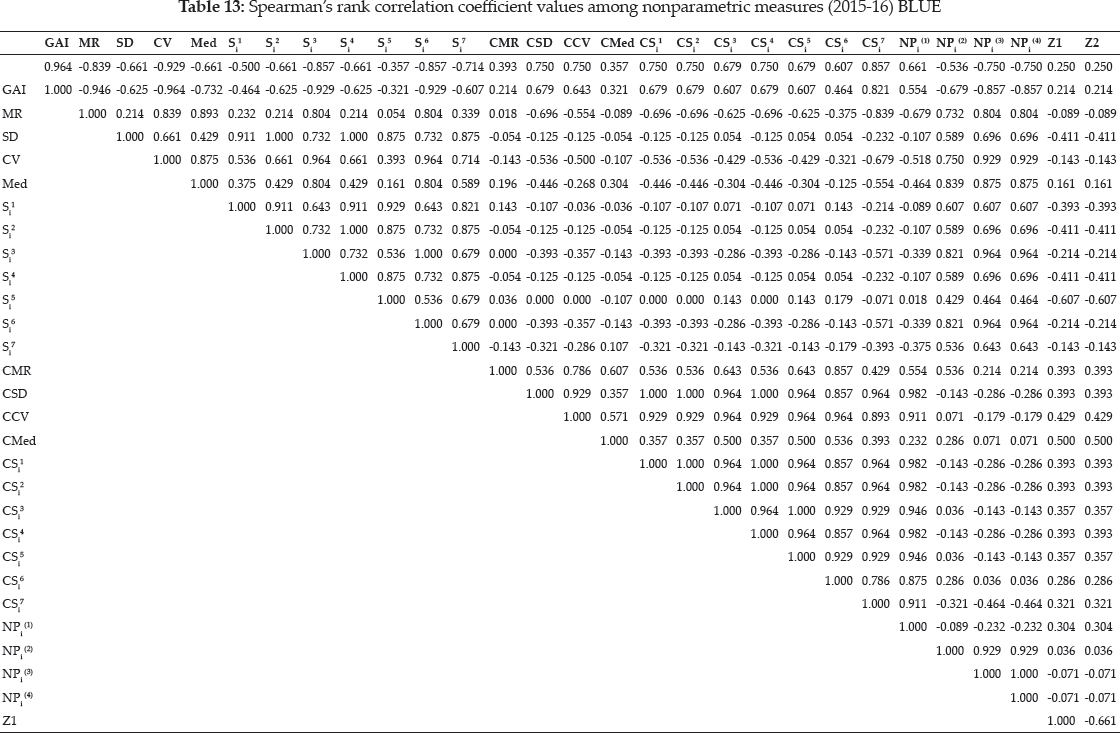
Spearman’s rank correlation analysis as per BLUP’s of genotypes yield had been reflected in table 11. Yield had positive correlation with GAI, CMR, CSD, CCV, Z1, Z2 CSi1, CSi2, CSi3, CSi4, CSi5, CSi6, NPi(1) and negative correlation with MR, CV, Med, Si1, Si3, Si6, NPi(2), NPi(3), NPi(4). GAI mentioned negative correlations with MR, CV, Med, Si1, Si3, Si6. Value of MR expressed mostly significant positive correlations with CV, Med, Si3, Si6, NPi(2), NPi(3), NPi(4). Significant positive correlation maintained by SD with Si1, Si2, Si3, Si4, Si5, Si7, CSD, CCV, CSi1, CSi2, CSi3, CSi4, CS5, CSj6, CSi7, NPi(1) values. Similar behaviour portrayed by CV values. Median had expressed significant values for positive correlations. Si1, Si2, Si3, Si4, Si5, Si6, Si7 exhibited direct relations of significant nature among themselves and with other measures. Measures CMR, CSD, CCV and CMed expressed positive correlations with most of the measures besides few weak negative correlations with NPi(2), NPi(3), NPi(4). Similar behaviour expressed by CSi1, CSi2, CSi3, CSi4, CSi5, CSi6, CSi7 and expressed only significant positive relationships. NPi(1), NPi(2), NPi(3), NPi(4) had also expressed only significant direct relationships. Z1 is related to Z2 in weak inverse manner.
Graphical analysis based on biplot
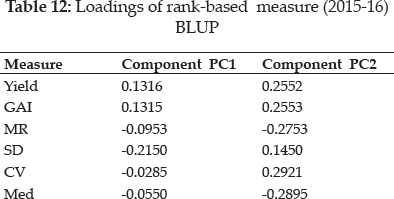
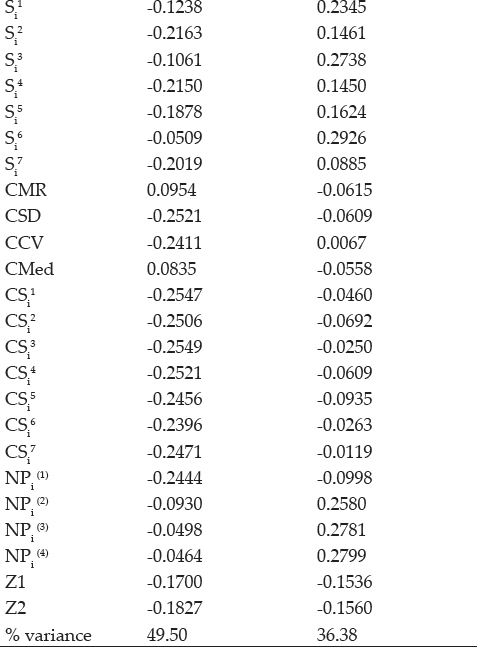
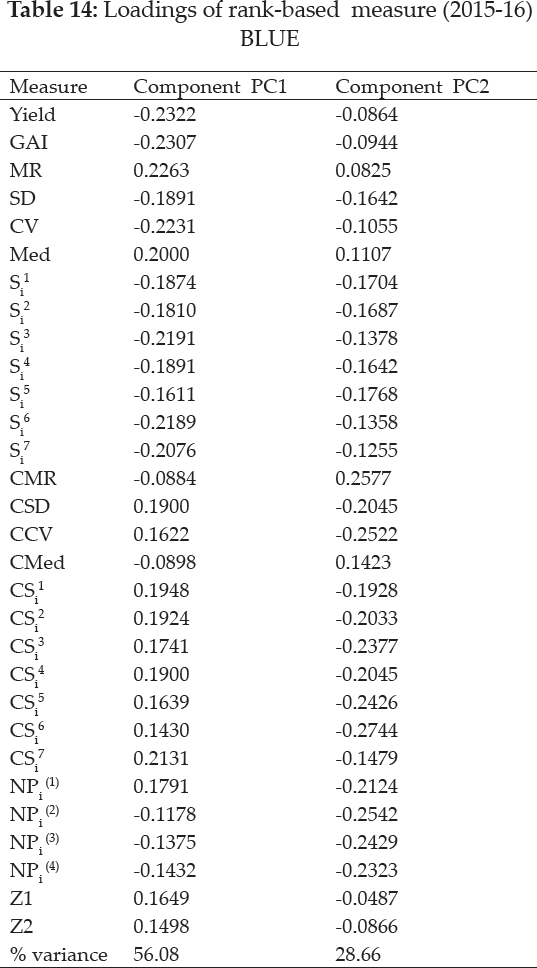
The loadings of measures based on first two significant principal components were reflected in table 12 (Mohammadi et al. 2016). Both significant PAC’s accounting for 85.9% of the variance of the original variables (Fig. 1). Grouping of Yield with GAI, MR grouped with Med in addition to affinity of CMR towards CMed. Cluster comprises of Z1 & Z2 with NPi(1), CSD, CSi1, CS2, CS3, CSi4, CSi5, CSi6 and CSi7 was observed. CV expressed affinity with CCV, Si1, Si2, Si4, Si5, Si7, Si3, Si6, NPi(2), NPi(3) & NPi(4) as separate cluster.
FIRST YEAR OF STUDY 2015–16
Analytic analysis as per BLUE’s
Average yield of genotypes showed G5 as of highest yield with 58 q/ha followed by G2 and G6, genotypes (Table 7). Measure GAI selected G5, G6, G2 based on higher adaptable index values. MR pointed towards G7, G1, G2 and SD for G7, G4, G1 whereas CV for G7, G1, G4 as genotypes of stable performance, while G5, G6 based on MR, G7, G4 based on SD and G5, G6 as large values of CV, would be unstable genotypes. Median selected G7, G1, G2 wheat genotypes for considered locations of this zone.
Si1, Si2, Si3, Si4, Si5, Si6 and Si7 indicated that (G7, G1, G5), (G7, G4, G1), (G7, G1, G4), (G7, G4, G1), (G7, G5, G4), (G7, G1, G4), (G7, G1, G4) as sets of desirable genotypes as per respective measure. G2, G5 & G1 by CMR values, G5, G4 & G2 by CSD and G5, G2 & G4 were the stable as per CCV. Median favoured G2, G6, G1 genotypes. CSi1, CSi2, CSi3, CSi4, CSi5, CSi6, CSi7 identified stable genotypes (G5, G4, G2) and G7, G3 were of unstable type as per these nonparametric measures. NPi(1) considered G5, G4 and G2 as desirable genotypes. Genotypes G7, G1 and G2 had expressed the lower values of NPi(2), while as per lower values of NPi(3) & NPi(4), G7, G1, G4 and lastly by Z1 and Z2 values selected G1, G2, G6 as suitable as well as G7 & G3 would be of unsuitable performance.
Calculated value of W (0.23) and for its significance x2 = 42.5 statistics was less than table of x2 (0.01, 290) = 135.8, which resulted an overall similarity among non-parametric measures. Values of Z1 sum = 18.9 and Z2 sum = 23.9 (Table 4) are distributed as x2 and were less than the critical value of x2 (0.05, 29) = 42.6. This indicated the non-significant differences among genotypes as per ranks of CSi1 and CSi2 measures.
Association analysis
Yield has expressed highly significant positive correlation with GAI, CSD, CCV, CSi1, CSi2, CSi3, CSi4, CSi5, CSi6, CSi7, NPi(2) along with negative correlation with other measures (table 18). GAI showed positive with CSD, CCV, CSi1, CSi2, CSi3, CSi4, CSi5, CSi6, CSi7, NPi(2). Values of MR expressed positive correlation with CV, Med, Si3, Si6, NPi(2), NPi(3), NPi(4). SD maintained only highly significant and significant positive correlations with almost all the measures. CV measure also showed significant positive correlation and negative correlation of moderate to weak nature. Same type of relations was depicted by Median. Si1, Si2, Si3, Si4, Si5, Si6, Si7 exhibited indirect relations only with CSi7, Z1, Z2, NPi(1). Negative correlations of weak nature by CMR, CSD, CCV, CMed with NPi(2), NPi(3), NPi(4) only.. CSi1, CSi2, CSi3, CSi4, CSi5, CSi6, CSi7 also expressed only weak indirect relations with NPi(2), NPi(3), NPi(4) measures. Significant positive relationships of NPi(1), NPi(2), NPi(3), NPi(4) obtained with few negative values of lower magnitude.
Graphical analysis based on biplot
Table 16 mentioned the values of loadings of measures as per the first two principal components axes (PCA) as 84.8% variations of measures accounted by these two in Fig. 3. Smaller clusters of only two measures i.e. MR with Med and CMR with CMed were observed in biplotgraphical analysis. Yield with GAI, NPi(2), NPi(3), NPi(4), Si1, S2, Si4, Si3, Si5, Si6 clustered in a group. Z1, Z2expressed affinity with, SD, CCV, CSD, NPi(1), CSi1, CSi2, CSi3, CSi4, CSi5, CSi6, CSi7 inlarge cluster.
SECOND YEAR OF STUDY 2017–18
Analytic analysis as per BLUP’s
High yield achieved by G3 followed by G6, G7 wheat genotypes, whereas GAI selected G3, G6, G7 genotypes, large values of mean ranks selected G2, G5, G8 more over the consistent yield of G8, G7, G2 expressed by least values of standard deviation (Table 9). Values of coefficient of variation anticipated G8, G5, G2 would be genotypes of least variations; Median observed suitability of G2, G5, G9 wheat genotypes for studied locations of central zone. Si1 and Si2 measures selected G8, G7, G2 as opposed to G8, G2, G7 by Si3 measure. Next two measures Si4 & Si5 settled for G8, G7, G2 and remaining two measures Si6 and Si7 favoured G8, G2, G7 wheat genotypes.
Average mean of ranks as per corrected yield values selected G7, G5, G6 and corrected standard deviation observed suitability of G8, G1, G7 genotypes. Coefficient of variation as per corrected yield values exhibited G7, G5, G8 while median values for G5, G6, G7 and G8, G1, G7 by CSi1 & CS2, CSi3 pointed for G8, G7, G5 & as per CS4 wheat genotypes G8 G1 G7, G1 G8 G7 by criterion of CSi5 & CSi6 settled for G7 G6 G5 and lastly by values of CSi7 genotypes G8, G5, G6 (table 10). NPi(1) selected (G1, G6, G8); NPi(2) identified (G8, G2, G1) , NPi(3) & NPi (4) settled for (G8, G2, G5), whereas G4 along with G6 would be of unsuitable type. Z1 and Z2 favoured G2, G5, G6 wheat genotypes.
Concordance coefficient W=0.46 and for its significance x2 = 110.8 statistic was less than table of x2 (0.05, 290) = 124.3 (135.8), which resulted an overall similarity among non-parametric measures. Values of Z1 sum = 14.4 and Z2 sum = 18.6 (Table 10) were less than the critical value of x2 (0.05, 29) = 42.6. This indicated the non-significant differences among genotypes as per ranks of CSi1 and CSi2 measures. Unstable performance of HI1544 & UAS 465 judged by larger values as compared to the critical value of x2 (0.05, 1) = 3.84.
Association analysis
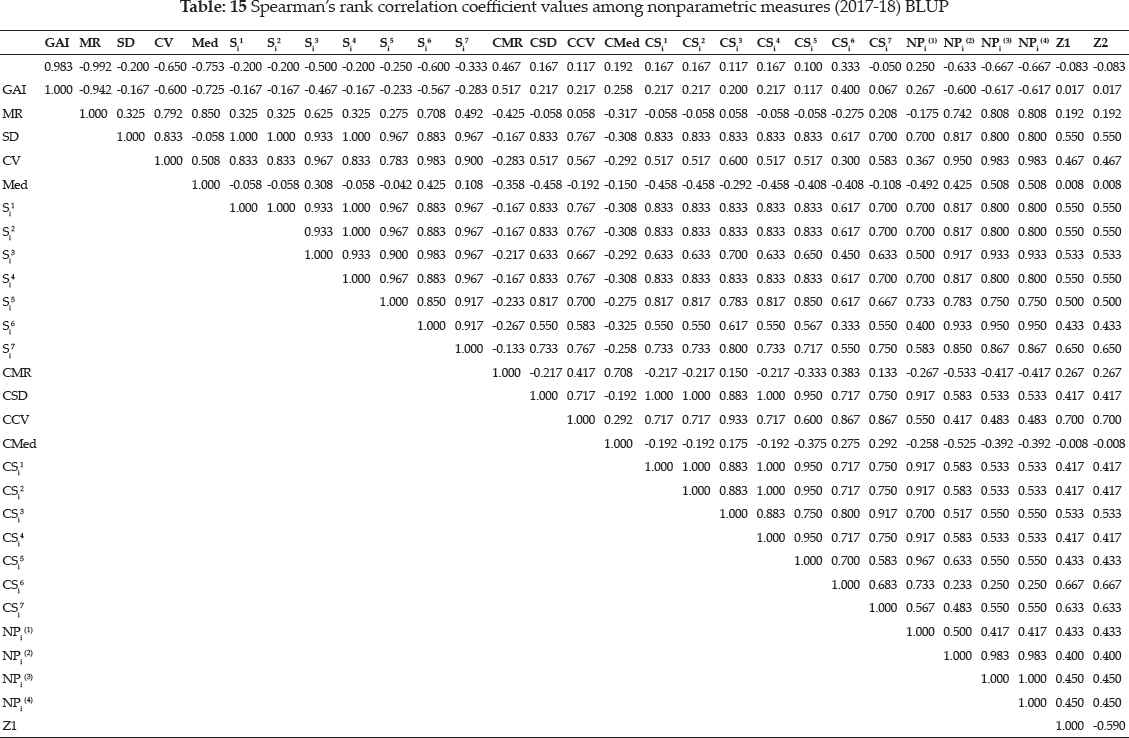
Spearman’s rank correlation analysis observed highly significant negative correlations of yield with MR, CV, Med, NPi(2), NPi(3), NPi(4) and positive with GAI, CMR, CSi6 (Table 15). GAI showed mostly significant negative correlations and positive values with CMR, CSD, CCV, CSi6. Significant direct relations maintained by MR along with few negative values of low magnitude. SD & CV maintained highly significant direct relations with almost all the measures. Median reflected both types of correlations. S.1, S.2, S:3, S.4, S.5, S.6 , S.7 exhibited highly significant to significant positive correlations with exception of CMR &CMed. Negative relationships maintained CMR with most of the measures. CSD had maintained only significant and perfect positive relationships with CSi1, CSi2, CSi4. Only direct relationships showed by CCV. While indirect relations of CMed had observed. CSi1, CSi2, CSi3, CSi4, CSi5, CSi6, CSi7 behaved in similar manner and exhibioed only direct relations with other and themselves. Values of NPi(1), NR(2), NR(3), NPi(4) had expressed positive correlations. Z1 is related to Z2 in inverse manner.
Graphical analysis based on biplot
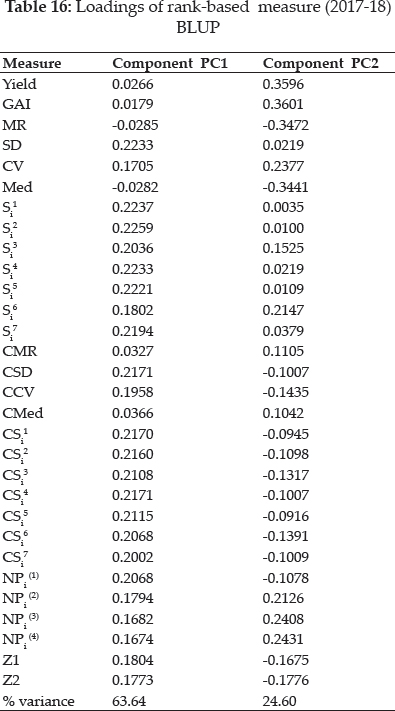
Five clusters among 30 rank-based measures had been expressed Biplot analysis and the loadings of measures were shown in table 16. Both significant PAC’s accounting for 88.2% of the variance of the original variables (Fig. 3). Grouping of Yield with GAI, MR with Med and CMR with CMed were observed in graphical analysis. CV expressed affinity with NPi(2), NPi(3) & NPi(4), SD, Si3, Si6, Si1, Si2, Si4, Si5, Si7 as grouped in cluster. Another large cluster comprised of Z1, Z2, CCV, CSD, Z1, Z2, NPi(1), CSi1, CS2, CS3, CSi4, CSi5, CSi6 and CSi7 measures.’
SECOND YEAR OF STUDY 2017-18
Analytic analysis as per BLUE’s
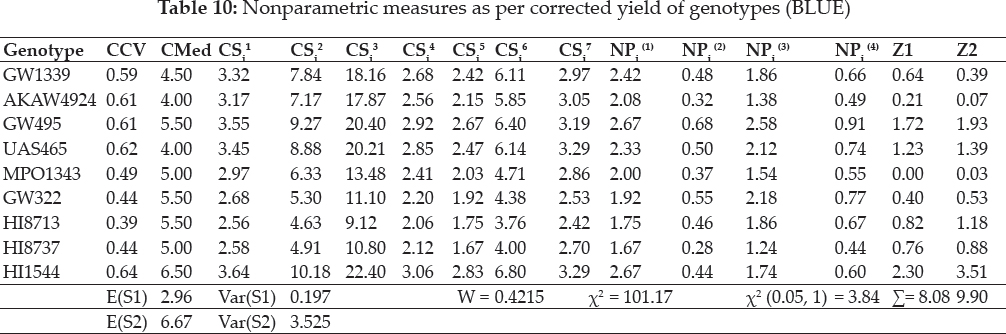
Higher average yield had expressed by G3, G6, G7 wheat genotypes, whereas G3, G6, G7 for possessed higher adaptability index values, mean of ranks selected G2, G9, G8 more over the consistent yield of G2, G8, G5 expressed by least values of standard deviation (Table 9). CV identified as G2, G8, G5 genotypes; Median found G9 G8 G2 as suitable genotypes as per considered locations of the zone. Si1 & Si2 measures selected G2, G8, G7 opposed to G2, G8, G5 by Si3 values. Genotypes G2, G8, G7 considered by Si4 as well as by Si5, genotypes G2, G8, G5 favoured by Si6 whereas Si7 settled for G2, G8, G7 genotypes.
CMR selected G7, G6, G5 and CSD observed suitability of G7, G8, G6 genotypes. CCV exhibited genotypes G7, G6, G8 while median values for G9, G7, G6 and genotypes G7, G8, G6 by CSi1, CS2 , CSi3 CSi4 measures whereas as per least values of CSi5 genotypes were G8, G7, G6 & for CSi6 values G7, G8, G6 while G7,G6, G8 by CSi7 (table 10). NPi(1)favoured (G8, G7, G6); while (G8, G2, G5) by NPi(2, NPi(3) & NPi (4). Measure Z1 settled for G5, G2, G6 and while genotypes G5, G2, G1 by Z2 values.
W=0.42 and x2 =101.2 statistic was less than table of x2 (0.05, 290) = 124.3 (135.8), which resulted an overall similarity among non-parametric measures. Values of Z1 sum = 8.08 and Z2 sum = 9.9 (Table 10) were less than the critical value of x2 (0.05, 29) = 42.6. This indicated the non-significant differences among genotypes as per ranks of CSi1 and CSi2 measures.
Association analysis
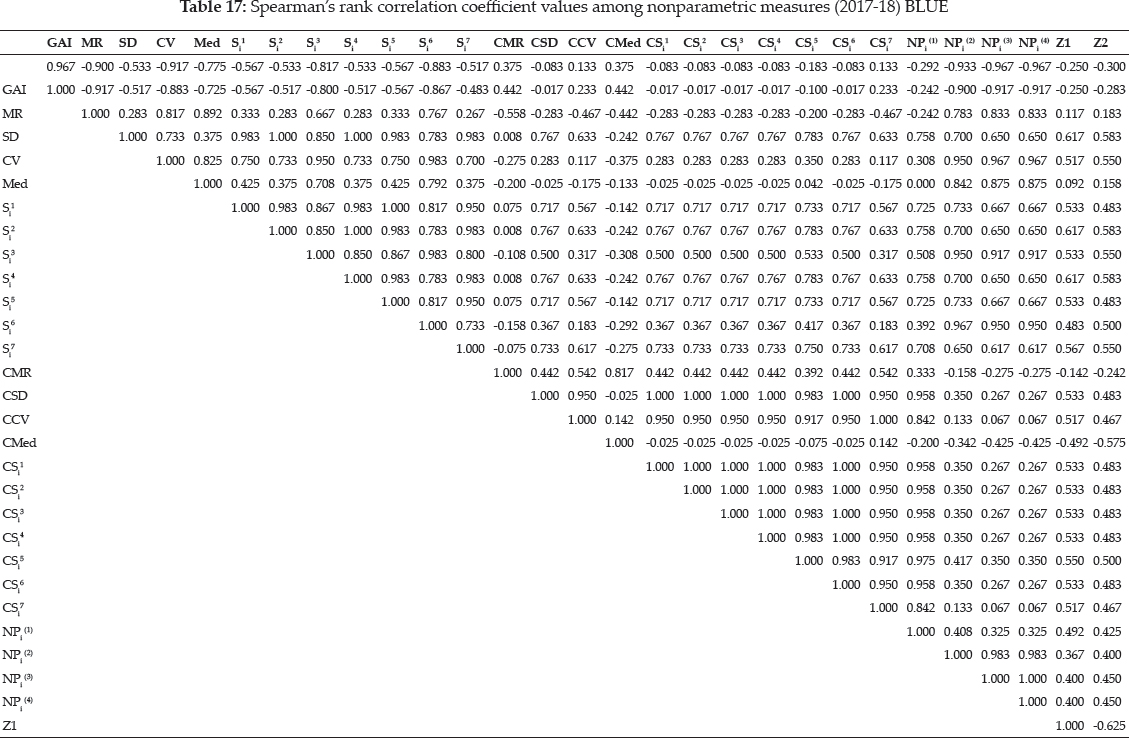
Majority of highly significant negative correlations of yield had evident from table. At the same time yield expressed positive values observed with GAI, CMR, CCV, CMed and CS7 (Table 17). GAI showed negative correlations with most of the measures. MR expressed significant positive correlation with CV, Med, Si3, Si6, NPi(2), NPi(3), NPi(4). SD and CV depicted same type of correlations with measures. Median had maintained highly significant and significant direct relations with the measures. Si1, Si2, Si3, Si4, Si5, Si6, Si7 exhibited significant positive correlation with other measures. CMR measure maintained both type of relationships. CSD, CCV had expressed positive correlations with measures & CMed maintained only negative values of correlation. CSi1, CSi2, CSi3, CSi4, CSi5, CSi6 and CSi7 expressed only significant positive relationships with others and themselves. NPi(1), NPi(2), NPi(3), NPi(4) had expressed only direct relationships. More over Z1 was related Z2 values by an inverse relationship.
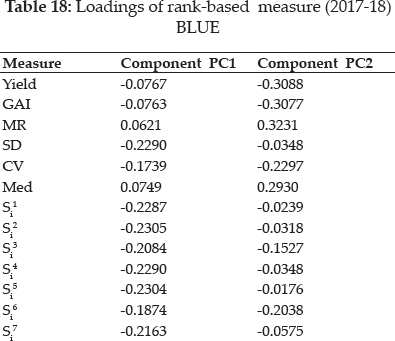
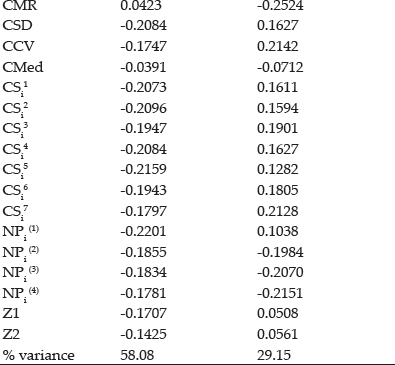
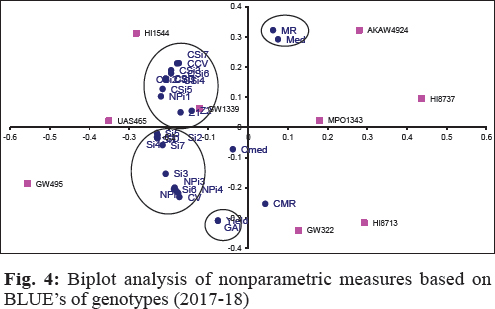
Graphical analysis based on biplot
Values of the loadings for measures as per first two significant principal components axes (PCA) were shown in table 18. Both significant PAC’s accounting for 78.4% of the variations in the variables (Fig. 4). Smaller clusters of only two measures i.e. Yield with GAI and MR with Med are observed in graphical analysis. CV along with CMR expressed affinity with, SD, CMed, NPi(2), NPi(3), NPi(4), Si3, Si5, Si6. Large cluster comprises of CCV, CSD, NPi(1), Si1, Si2, Si4, CSi1, CSi2, CS3, CSi4, CS5, CSi6, CSi7 and Z1measures.
CONCLUSION
BLUP’s of wheat genotypes provide more valid estimates of yield in multi environment trials and more variations accounted by first two significant principal components of nonparametric measures. More affinity among measures had reflected by a smaller number of clusters in biplot analysis based on BLUP's. Association of Sis, CSis, NPi(s) with other measures is independent of ranks as per BLUP or BLUE of genotypes. Positive and direct relationships exhibited by these measures with other nonparametric measures.
ACKNOWLEDGEMENTS
Authors sincerely acknowledge the training by Dr. J. Crossa and financial support by Dr. A.K. Joshi & Dr. R.P. Singh CIMMYT, Mexico along with hard work of the staff at coordinating centers of AICW & BIP project to carry out the field evaluation and data recording.
REFERENCES
Ahmadi, J., Vaezi, B., Shaabani, A., Khademi, K.,Ourang, S. and Pour-Aboughadareh, A. 2015. Non-parametric Measures for Yield Stability in Grass Pea (Lathyrus sativus L.) Advanced Lines in Semi Warm Regions. Journal of Agricultural Science and Technology, 17: 1825–1838.
Balalic, I., Zoric, M., Miklic, V., Dusanic, N., Terzic, S. and Radic, V. 2011. Nonparametric stability analysis of sunflower oil yield trials. Helia, 34: 67–77.
Delic, N., Stankovic, G. and Konstatinov, K. 2009. Use of nonparametric statistics in estimation of genotypes stability. Maydica, 54: 155–160.
Farshadfar, E., Mahmudi, N. and Sheibanirad, A. 2014. Nonparametric methods for interpreting genotype * environment interaction in bread wheat genotypes. Journal of Biodiversity & Environmental Sciences, 4: 55–62.
Huehn, M. 1990a. Non-parametric measures of phenotypic stability. Part 1: Theory. Euphytica, 47: 189–194.
Huehn, M. 1990b. Non-parametric measures of phenotypic stability: Part 2. Application. Euphytica, 47: 195–201
Hiihn, M. and Leon, J. 1995. Nonparametric analysis of cultivar performance trials: experimental results and comparison of different procedures based on ranks. Agronomy Journal, 87: 627–632.
Karimizadeh, R., Mohammadi, M., Sabaghnia, N. and Shefazadeh, M.K. 2012. Using Huehn’s nonparametric stability statistics to Investigate Genotype * Environment interaction. Notulae Botanicae Horti Agrobotanici Cluj-Napoca, 40: 293–301
Khalili, M. and Pour-Aboughadareh, A. 2016. Parametric and nonparametric measures for evaluating yield stability and adaptability in barley doubled haploid lines. Journal of Agricultural Science and Technology, 18: 789–803.
Mahtabi, E., Farshadfar, E. and Jowkar, M.M. 2013. Non parametric estimation of phenotypic stability in chickpea (Cicer arietinum L.). International Journal of Agriculture and Crop Science, 5: 888–895.
Mohammadi, R., Farshadfarar, E. and Amri, A. 2016. Comparison of rank-based stability statistics for grain yield in rainfed durum wheat. New Zealand Journal of Crop & Horticulture Science, 44: 25–40.
Mortazavian, S.M.M. and Azizinia, S. 2014. Nonparametric stability analysis in multi-environment trial of canola. Turkish Journal Field Crops, 19(1): 108–117.
Nassar, R. and Huehn, M. 1987. Studies on estimation of phenotypic stability: tests of significance for non-parametric measures of phenotypic stability. Biometric, 43: 45- 53.
Piepho, H.P. and Lotito, S. 1992. Rank correlation among parametric and nonparametric measures of phenotypic stability. Euphytica, 64: 221–225.
Pour-Aboughadareh, A., Yousefian,M., Moradkhani, H., Poczai, P. and Siddique, K.H.M. 2019. STABILITYSOFT: A new online program to calculate parametric and non-parametric stability statistics for crop traits. Applications in Plant Sciences, 7(1): e1211.
Rasoli, V., Farshadfar, E. and Ahmadi, J. 2015. Evaluation of Genotype * Environment Interaction of grapevine genotypes (Vitis vinifera L.) by nonparametric method. Journal of Agricultural Science and Technology, 17: 1279–1289.
Sabaghnia, N., Karimizadeh, R. and Mohammadi, M. 2012. The use of corrected and uncorrected nonparametric stability measurements in Durum wheat multi-environmental Trials. Spanish Journal of Agricultural Research, 10: 722–730
Thennarasu, K. 1995. On certain non-parametric procedures for studying genotype-environment interactions and yield stability. Unpublished Ph.D Thesis PG School IARI, New Delhi.
Vaezi, B., Pour-Aboughadareh, A., Mehraban, A., Hossein-Pour, T., Mohammadi, R.,Armion, M. and Dorri, M. 2018. The use of parametric and non- parametric measures for selecting stable and adapted barley lines. Archives of Agronomy and Soil Science, 64: 597–611.
Zali, H., Farshadfar, E. and Sabaghpour, S.H. 2011. Non-parametric analysis of phenotypic Stability in chickpea (Cicer arietinum L.) genotypes in Iran. Crop Breeding Journal, 1(1): 89–100.