![]()
International Journal of Agriculture, Environment and Biotechnology
Citation: IJAEB: 13(2): 155-162, June 2020
DOI: 10.30954/0974-1712.02.2020.6
ENTOMOLOGY
Pesticides Use Pattern and Handling Practices among Cucumber (Cucumis sativus L.) Growing Farmers of Parsa District of Nepal
ABSTRACT
Pesticide is one of the major inputs for commercial vegetable farming in Nepal. The study examined pesticides use pattern and farmers’ knowledge, perception, awareness about pesticides and the handling practices. The study is based on survey data consisting of 150 samples collected randomly from Parsa district of Nepal. The results show that 54.7% of the cucumber farmers used pesticides as control measure of insect and fungus in Parsa district. Out of which insecticides was found to be applied more i.e.68% followed by the fungicides i.e. 22.33% of total application volume sprayed. Regarding toxicity level farmers were found to use Moderately Hazardous Pesticides (II). The research identified that farmers do 2 times spray as mandatory frequency of application however, nearly half of farmers were found to spray pesticide four to five times. Regarding their knowledge 53% of farmers found to read label on pesticide bottle/packages. More than half (57%) of the farmers has found to receive Integrated Pest Management (IPM) training but only 7% practiced alternative pest control measures. Regarding the disposal only 6% found to bury the empty bottles, packages after use and others throw the containers anywhere. The results show that, in Nepal, pesticide was mostly applied for the vegetable farming. If area under vegetable farming increases by 1% the probability of the pesticide application by household is increased by the 22%.
Highlights
![]() Study revealed that 54.7% of the respondents used pesticides.
Study revealed that 54.7% of the respondents used pesticides.
![]() Insecticides were dominant pesticides in use by volume.
Insecticides were dominant pesticides in use by volume.
![]() Mostly respondents used Moderately Hazardous Pesticides (II).
Mostly respondents used Moderately Hazardous Pesticides (II).
![]() Increase in area under cultivation by 1% increased pesticide application by 22%.
Increase in area under cultivation by 1% increased pesticide application by 22%.
Keywords: IPM, knowledge, Agriculture, Pesticides
Commercial vegetable production in Nepal heavily relies on chemical pesticides. Pesticides though don’t increase the output directly, but are one of the major inputs in agriculture. According to EPA, pesticides are the chemicals used to prevent, destroy, repel and mitigate the insects and pests. Pesticides are of two types: chemical based and biological products based; later one is much more sustainable solution for pest control. In Nepal, Dichloro Diphenyl Trichloro ethane (DDT) was for the first time introduced as a pesticide for malaria eradication program in 1950s, followed by other pesticides like Gammexene and nicotine sulfates and new kinds of pesticides like Organochlorines, Organophosphates and Carbamates (Sushma et al. 2015). The total economic costs of pesticide use for farmers amounted to 15% of agricultural cash income, or 5% of total household cash income (Atreya 2007). According to the latest estimate, the annual imports of pesticides in Nepal is 636 tons (a.i.) with 54.69% fungicides, 26.64% insecticides, 16.58% herbicides, 1.89% rodenticides, 0.177% biopesticides and 0.001% others fig. 1. Three thousand Thirty five types of pesticides by trade name, one hundred and one seventy types of pesticides by common name have been registered in December, 2018 under Pesticides Act 1991 and Rules 1993 (PQPMC, 2018). But less than 0.1% of pesticides applied for pest control reach their target pests (Pimentel & Burgess 2012). Thus, more than 99.9% of pesticides used move into the environment where they adversely affect soil biota, water and atmosphere of ecosystems. Improved pesticide application technologies therefore, can improve pesticide use efficiency and protect public health and the environment.
In Nepal, use of pesticide is growing at alarming rate. The nation is among those countries using the least amount of pesticides, but having high health impact in the world (Prasain 2020). The use of outdated, non-patented, more toxic, and environmentally persistent pesticide are the leading causes of higher toxicity (Ecobichon 2001). The southern plain region (Terai), also called the ‘food basket’ of the country, uses the highest amount of pesticide per unit area followed by the mid-hills and high-mountains regions (CBS 2011). Majority of pesticide is used in off season vegetable productions, which are expensive but are prone to insects. Parsa district is one of the major vegetable producers of the country. The district is popular for vegetable production in 2017/18, vegetables being produced in 3687 ha of land with production of 55402 mt. doubtlessly, it’s among the one that uses tons of pesticides. The study was carried out to examine pesticides use pattern and farmers’ knowledge, perception, awareness about pesticides and the handling practices in this district.
MATERIALS AND METHODS
Sample size and Sampling techniques
The study constitutes 150 random sample collected from Parsa districts. For sampling purpose the two municipalities Bahudramai and Pokhariya were purposively chosen. Within the municipalities the 150 sample were selected using simple random sampling technique.
Methods of data collection
Primary data were collected using semi-structured interview schedule developed by panel of agricultural economist and agronomist. To increase validity and reliability, farmers were interviewed by researchers and experience extension officers. The information gathered was verified by focus group discussion (FGD) and 1 Key Informant Interview (KII). Secondary data were obtained from DADO annual reports, newsletters, bulletins and relevant articles, Department of Agriculture, Ministry of Agriculture and Cooperatives (MOAC). The survey was collected between January and June of 2019.
Data Analytical techniques
The information collected was arranged systematically. Before entering the data codes were designed and units were standardized. Different analytical software like STATA, SPSS, MS-EXCEL have been used to analyze acquired information. Probit regression analysis was done to determine that factor affecting application of pesticides. In this regression model, status of pesticide use (Yes =1 or No =0) is used as dependent variable. The adoption of new agricultural technology is influenced by three factors like (i) farm and farmers’ associated attributes like farmer’s education, age, family size and farm size (ii) attributes associated with the technology (Adesina & Zinnah 1993) and the farming objectives (CIMMYT, 1988).
Econometric model used

i = 1 if farmers Spray pesticide; j = 0 otherwise where
Pij = Status of Pesticide spray
Xij = Age, gender dummy, Year of schooling, family size, ethnicity, Family Type (Nuclear = 1 Otherwise = 0), Household Size (Numbers), Family Involved in Agriculture (Numbers)
Total Owned Land (Bigha), Total Vegetable Grown Land (Bigha), Total Income (In NRS), Income From agriculture (In NRS), Income From Livestock (In NRS).
RESULTS AND DISCUSSION
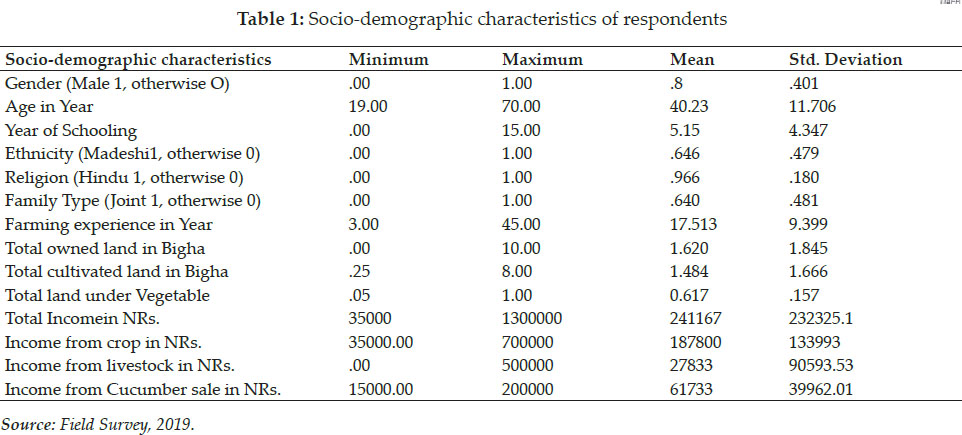
Socio-demographic characteristics of respondents
The table 1 shows the socio economic profile of the respondent household. The results showed that majority of the respondent were madeshi (64.6%), hindu (96.66%) and male (80%). The majority of them were economically active age group i.e. mean age 40.23% having long farming experience (17 yr). But they were found to be illiterate i.e. mean year of schooling 5%. Farming size and nature of the commodity affect the farmer’s decision to apply pesticide. The average size of land owned by farmers was found to be 1.62 bigha out of which 91% of land is cultivated. Within the cultivated area vegetable farming is done on 41.58 % of area. In the research area major source of income is cucumber production. It covers 17.2% of total income from agriculture.
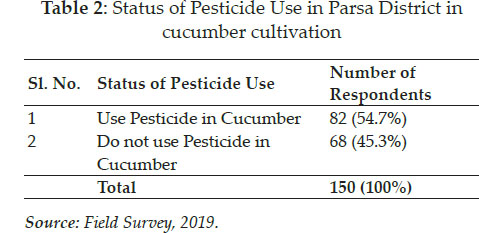
Status of pesticide use among the cucumber growing farmers
Status of pesticide use in Districts
Result showed that, out of 150 respondents surveyed, 54.7% of the respondents were involved in pesticide spray rest of the farmers do not use any type of pesticide in the cucumber table 2.
Source: Field Survey, 2019.
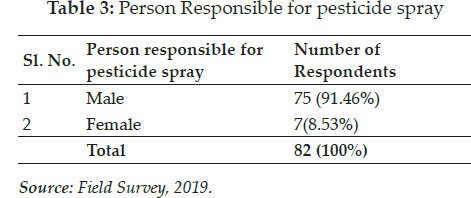
Among the pesticide user 80% of the farmers have husband or son for the spray of pesticide. Very few woman i.e. 7.5% spray pesticide by themselves shown in table 3.
Type of Pesticide used
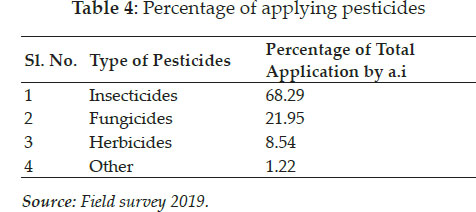
Research revealed that farmer mostly use insecticides (68%) in cucumber farming followed by fungicides (22.33%), herbicides (8.65%) and other (0.33%) as shown in Table 4.
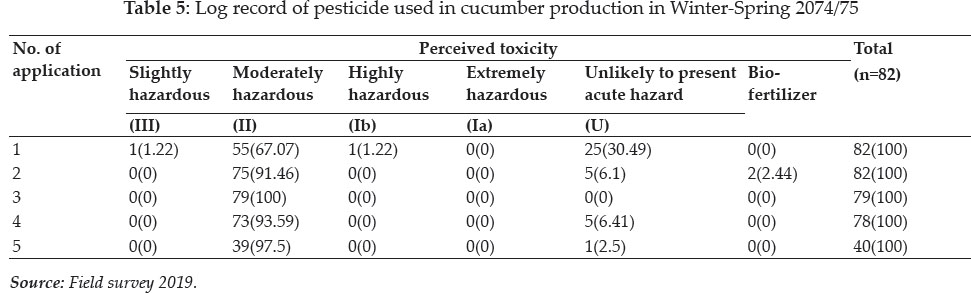
Toxicity Level of Used Pesticide
According to World Health Organization pesticides were classified into 6 classes as listed in table 5. The result shows that almost all farmers spray pesticides two times as mandatory basis. However about 50% farmers go upto 5 times spray. Moderately Hazardous Pesticides (II) was found as major choice of farmers during spray during all application frequency. However, 30.49% of farmers during 1stspray and 6% of farmers during second and fourth spray found to use Unlikely to present acute hazard (U) pesticide. Very few farmers were found to use bio-fertilizers i.e. 2.44% during second application (Table 5).
Training on Integrated Pest Management (IPM)
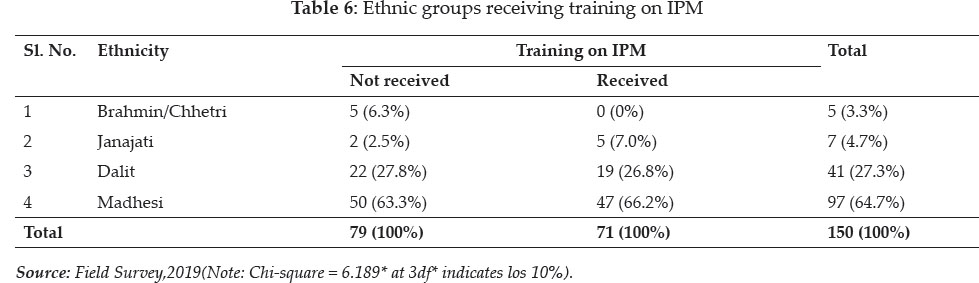
Integrated pest management is an eco-friendly solution which can minimize the use of pesticides reducing the cost of production. Result showed that out of 150 farmers, 47% of the respondents had received IPM training. If we analyse the data comparing with ethnic groups, it was observed that majority of madhesi group i.e. 79% received training fallowed by Dalit 26.8%. Whereas Brahmin/Chettri haven’t got any type of training (Table 6).
Change in brands of pesticides
The research revealed that among the pesticide users 17.7% of farmers used same brand of pesticides whereas the 34.16% change the brand regularly. Similarly majority of the farmers i.e. 48.78% change brand sometimes table 7.
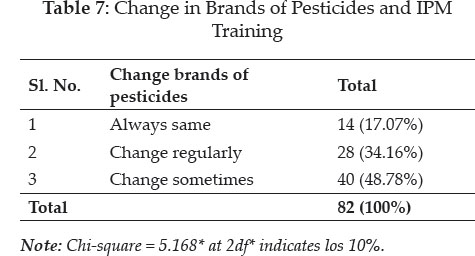
Note: Chi-square =61; 5.168* at 2df* indicates los 10%.
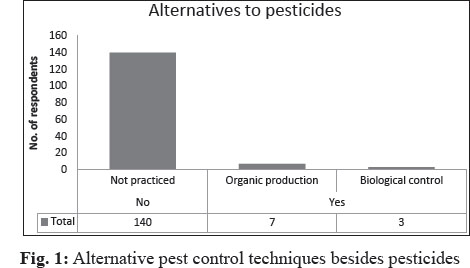
Alternative pest control techniques
Respondents were asked if they had been practicing any other pest control techniques besides pesticides. It was found that 93.33% didn’t practice any alternatives to pesticide spray whereas 4.67% had been practicing organic production (cattle urine) and remaining 2% had been practicing biological control measures (natural enemies) for pest control (Fig. 1).
Pesticide application practices among the farmers
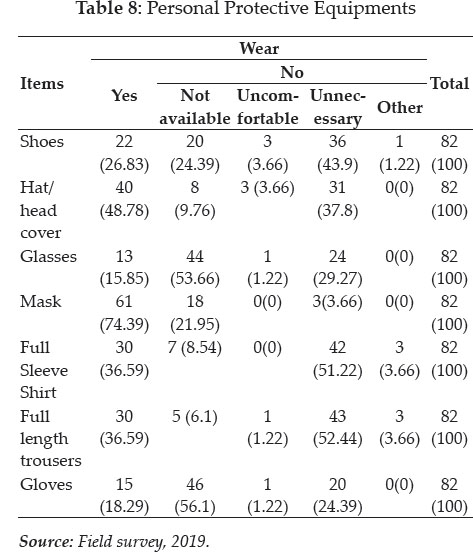
Use of Personal Protective Equipments
Among the respondents; 26.83% wore shoes, 48.78% wore hat/head cover, 15.85% wore glasses, 74.39% wore mask, 36.59% wore full sleeve shirt, 36.59% wore full length trousers, 18.29% wore gloves and none of them used other personal protective equipments during spraying pesticides (Table 8). Most of the farmers reported that non availability of these equipment were major factor for not using.
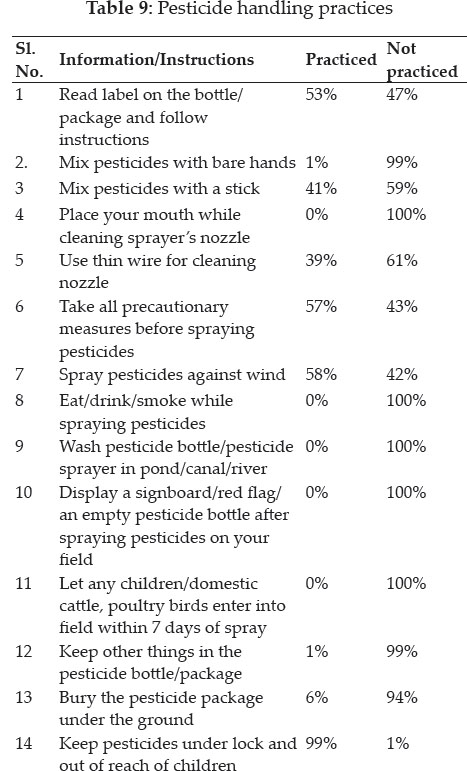
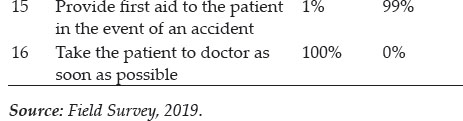
Pesticide handling practices
Among the respondents; 53% of them read the instructions on the pesticide bottle/packages, only 1% mixed pesticides with bare hands, 41% mixed with stick, none (0%) placed their mouth while cleaning sprayer’s nozzle, 39% cleaned using a thin wire, 57% took all the precautionary measure before spraying pesticides, only 42% were aware about the wind direction, none of them eat/drank/smoked during spray, none washed the pesticide bottle in pond/canal/river, none displayed signboard/ red flag/an empty pesticide bottle to make other understand about the pesticide sprayed, none would let children/domestic cattle/poultry birds enter field within 7 days of spray, only 1% kept other things in the bottle, only 6% buried the packages/bottles after use, 99% kept pesticides under lock so that children wouldn’t reach, only 1% provided first aid treatment immediately after an accident and 100% took the patient to the doctor as soon as possible (Table 9).
Farmers’ perception, knowledge about pesticide
Waiting period to re-enter the field
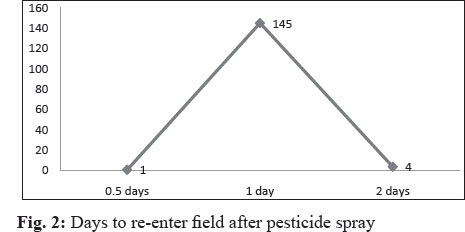
Ninety six percent (96.6%) of the respondents reenter their field after 1 day of the pesticide spray, two percent (2.66%) of them re-enter after 2 days of the spray whereas, 0.66% re-enter the field after 0.5 days of the pesticide spray (Fig. 2).
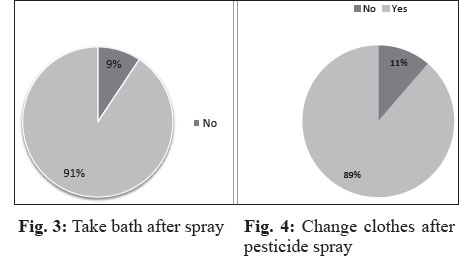
Activity carried by farmer after pesticide spray The research shows that 91% of the respondents took bath after spraying pesticides but remaining 9% didn’t take bath after the spray (Fig. 3) and about 89% of the respondents changed clothes after spraying pesticides whereas remaining 11% didn’t change their clothes after the spray (Fig. 4).
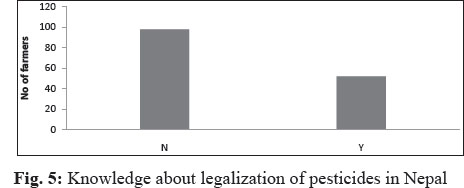
Farmers’ knowledge about pesticides legalization in Nepal
Most of the respondents didn’t have any knowledge about the legalization of pesticides in Nepal. 66% respondents were unknown about the banned pesticides whereas remaining 34% had some knowledge and the source of knowledge was pesticide retailers (Fig. 5).
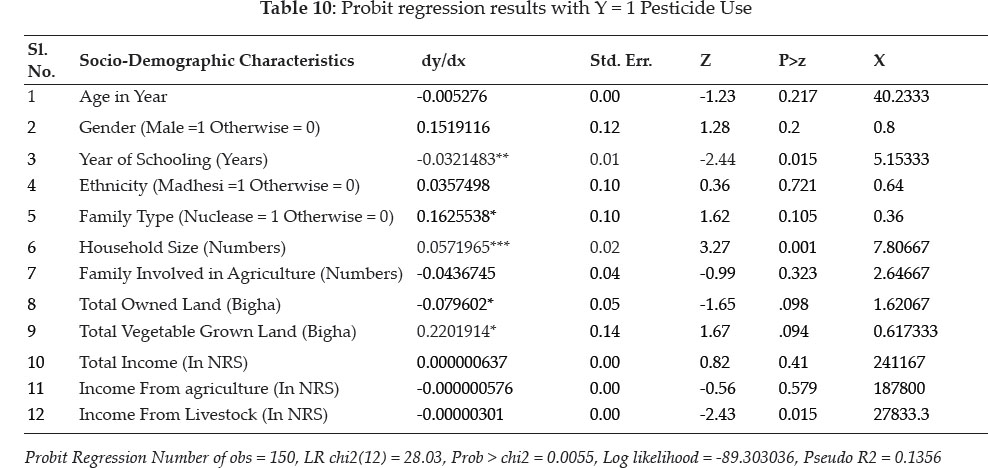
Factor Affecting the Pesticide Use
The results show that use of the pesticides affected by the Year of schooling, family type household income from livestock sector table. The research shows that if year of schooling increased by the 1% the probability of using pesticides decreased by the 3%. The result is highly significant at 5%. Similarly if the family is nuclear type then probability of pesticide application increased. Also if household size increases by 1% than probability of the pesticide use increased by 5%. Regarding the land holding the pesticide is negatively affected by the land ownership but it positively effects on the area allocated for the vegetable farming. According to (GC & Ghimire, 2018) highest share of pesticides is of vegetables. It accounts for 89% of the total pesticide use. If land allocated for vegetable farming increased by 1% the probability of the pesticide application by household increased by the 22%. Income from the livestock sector also discourages the application of pesticide on farm land.
CONCLUSION
The study was carried out to investigate farmers’ knowledge and perception about pesticides use; and to know how they handle pesticides before, during and after the spray. The results show that, in Nepal pesticide was mostly applied for the vegetable farming. If area under vegetable farming increase by 1% the probability of the pesticide application by household increased by the 22%. Butmost of the farmers are still unknown about the safety measures to be adopted during the pesticide spray. The study shows that moderately hazardous pesticides are being used by cucumber growers. Only few of the growers are known about the banned pesticides in Nepal. Though more than half of them have received training on IPM, very few are using alternative pest control measures. Most of the growers were not using PPE during pesticide application in cucumber. Quite a high figure of growers don’t consider waiting period to re-enter their field and harvest the product. Thus, the result calls for a need to correct the pesticide use pattern and raising awareness among the farmers about use of protective measures while using the pesticides. All the sectors including producers, consumers, government, development organizations should join hand in hand to work out the problem.
ACKNOWLEDGMENTS
Authors would like to thank Prime Minister Agriculture Modernization Project (PMAMP) for funding the project. We heartily express our sense of gratitude and profound appreciation to the Mahendra Ratna Multiple Campus (MRMC), Ilam, Nepal team for the constant support and guidance during the research project. We owe our gratitude to the entire team of PMAMP, Parsa for bridging the gap between us and the farmers’ group. We wish to give special thanks to Prof. Dr. Dharma Raj Dangol, President of ISERN for continuous encouragement and guidance. We are very thankful to Mr. Ananta Mani Bhattarai for his valuable advice and suggestions during the entire period of study. Special acknowledgement is also due all the respondents for their active participation during the survey and providing reliable information and cooperation.
REFERENCES
Adesina, A.A. and Zinnah, M.M. 1993. Technology characteristics, farmers’ perceptions and adoption decisions: A Tobit model application in Sierra Leone. Agricultural Economics,9(4): 297-311.
Atreya, K. 2007. Pesticide Use in Nepal : Understanding Health Costs from Short-term Exposure. Sandee Working Paper No. 28-07, 28. http://www.sandeeonline.org/uploads/documents/publication/748_PUB_working_paper_28.pdf
CBS. 2011. National Sample Census of Agriculture Nepal 2011/12. http://www.fao.org/fileadmin/templates/ess/ess_test_folder/Workshops_Events/APCAS_24/PPT_after/APCAS- 12-12-Agriculture_Census__of_Nepal_2011.pdf
CIMMYT. 1988. From Agronomic Data to Farmer Recommendations: An Economics Training Manual. Completely. https://repository.cimmyt.org/xmlui/bitstream/han- dle/10883/859/25152.pdf
Ecobichon, D. 2001. Pesticide use in developing countries. Toxicology, 160, 27-33. https://doi.org/10.1016/S0300- 483X(00)00452-2
GC, A. and Ghimire, K. 2018. Trend of Pesticides Uses in Nepal. 5: 32-43.
Pimentel, D. and Burgess, M. 2012. Small amounts of pesticides reaching target insects. Environment, Development and Sustainability, 14. https://doi.org/10.1007/s10668-011-9325-5
PQPMC. 2018. List of Registered Pesticides and Pesticide Consumption Data 2076/076. http://www.npponepal.gov.np/downloadsdetail/2/2018/39799637/
Prasain, S. 2020. Nepal continues to import pesticides at an alarming rate, government’s own data shows. Kantipure Online. https://kathmandupost.com/national/2019/07/10/ nepal-continues-to-import-pesticides-at-an-alarming-rate-governments-own-data-shows
Sushma, D., Dipesh, R., Lekhendra, T. and Shalik Ram, S. 2015. A Review on Status of Pesticides Use in Nepal. Research Journal of Agriculture and Forestry Sciences Res. J. Agriculture and Forestry Sci,3(3): 2320-6063.