Economic Affairs, Vol. 65, No. 3, pp. 323-331, September 2020
DOI: 10.46852/0424-2513.3.2020.2
![]()
Seasonal Price Variability and Temporal Business Opportunities for Lime and Sweet Oranges in Nepal
ABSTRACT
The price of agricultural commodity shows seasonal nature with low price immediately after harvest which increases gradually to reach maximum just prior to next harvest. The price of sweet orange and lime also exhibits strong seasonality due to their seasonal nature of production and higher perishability which may exacerbate the poverty of small holding farmers but also can increase the profit of farmers if it can be properly utilized. However, the knowledge about seasonal price movement of these fruits in Nepal is inadequate. Thus, this study was conducted to analyze the seasonal price variation and business opportunities of Lime and Sweet oranges in Nepal which may be useful in developing appropriate policy response for price stabilization. The ratio-to-moving average method was used to study the seasonal price variation and business opportunities. The results from this study revealed the strong seasonal nature of price movement with the highest seasonal index in Baishakh for lime and Ashad for sweet orange whereas the lowest seasonal index for lime and sweet orange in Poush and Kartik respectively. The magnitude of price variability was high and the gross storage return for both lime and sweet orange was also higher. Similarly, the wholesale price of sweet orange and lime showed significant and increasing trend. This concludes that the earning from sale of lime and sweet orange is highly unstable due to the seasonal nature of their prices and the storage and sale of these commodity during the lean season of production would be profitable.
Highlights
 The price of both Lime and Sweet orange showed strong seasonal variation as well as significantly increasing trend during the study period.
The storage of both lime and Sweet Orange would be profitable as indicated by the gross storage return.
Keywords: Price Stabilization, Ratio-to-Moving average, Seasonal Index, Variability
Seasonal fluctuation is one of the most important and well-known features of agriculture. Seasonal variation is regularly recurring pattern which is completed every 12 months (Sahu, 2018). Seasonal price variability is the change in price level over time and it is one of the major problems affecting agriculture sector (Barmon & Chaudhury, 2012). The price of agricultural commodity is determined by production and availability (Camara, 2013). The nature and supply of Agricultural commodity generally results in instable price and income in agriculture sector (Sahu, 2018). Most of the agricultural produce; especially fruits and vegetables are highly perishable in nature and requires immediate marketing after harvest. Timely marketing of such commodities is essential to ensure freshness and quality to the consumers as well as return good price to the growers (Kumar, Sharma, & Singh, 2005). Price Variability in agricultural produce is mainly caused due to its inelastic demand, strongly seasonal nature of production and long production cycles (Barmon & Chaudhury, 2012; Camara, 2013). Timmer (2011) also argued that the price variability of agricultural commodity is influenced by factors such as supply limitation, emerging markets, increased demand and unrealized potential.
How to cite this article: Dahal, S. (2020). Seasonal Price Variability and Temporal Business Opportunities for Lime and Sweet Oranges in Nepal. Economic Affairs, 65(3): 323–331.
Source of Support: None; Conflict of Interest: None ![]()
Farm price vary periodically and the price movement is similar from year to year (Rahn, 1968). The seasonal variation is the short time fluctuation occurring within a year in a time series data. Thus, the measurement of seasonal price variation is required to measure this fluctuation and determine the effect of season on price which in-turn help farmers for planning future production (Moniruzzaman, Islam, Sabur, Alam, & Alamgir, 2008).
Crop prices follow a general seasonal pattern with seasonal low at harvest followed by post-harvest increase. The price increases after harvest because of fixed supply and consumption depletes that supply causing price rise (Noonari et al. 2015). Sharma and Burark (2015) revealed that the price of maize followed seasonal pattern with high price during off season of production and lowest price during harvest season. Similar result was reported by Meera and Sharma (2016), who showed that the price of wheat was highest during off season and lowest during harvest season. Moniruzzaman et al. (2008) also revealed that there was seasonal variation in price of raw jute with above average price during lean period of production and below average price during peak period of production.
The seasonal nature of price variation was also reported in vegetables by many authors. Noonari et al. (2015) concluded that the price of agricultural commodity including vegetables was lower in post-harvest season and higher in lean season of production. Similarly, Mani et al. (2018) revealed the existence of seasonality in the price of tomatoes and ginger and concluded that the price was low at 1–2 months following the harvest and it rose to reach maximum just prior to next harvest. Mishra and Kumar (2012) found the wholesale price of vegetable was high during lean period and low during post-harvest period due to seasonal and perishable nature of vegetable and concluded that there was high seasonality in wholesale price of vegetable in Nepal.
The perishability and seasonality of fruits is very high compared to other crops which leads to price uncertainty as the producer has no control over the price (Singh et al. 1967, as cited in Bhat, Kachroo, & Singh, 2014). The production of fruits is risky as they are exposed to pressure from extreme weather and pest/disease in orchard which leads to change in both quantity and quality of produce and ultimately price variation is inevitable (Thornsbury, et al. 2020). Godara and Bhonde (2006) revealed that the arrival of fruits including orange, lemon and sweet orange to market was lower in lean season and thus price was high during this lean period of production. Bhat, Kachroo and singh (2014) found that the seasonal nature of citrus fruits like oranges and lemon leads to sharp fall in price immediately after harvesting. Sani and Farahani (2011) also reported that tree fruits including oranges showed high price variation due to their perishable nature and their increased demand during peak season caused the decrease in their price.
Horticulture produce in Nepal are marketed through different types of markets, the most common being rural haat bazars where the producers and consumers are in direct relationship. The price of agricultural commodity including citrus changes with time. The price of citrus fruits is highly unstable and depends on the quantity supplied (Sulaiman, Doucha, & Kandakov, 2014). Citrus price varies with season due to seasonal nature of its production. The wholesale and retail price of lime and hill lemon also showed temporal and spatial variation in Nepal (Dhakal & Tripathi, 2005).
The high and unpredictable seasonal price variability creates uncertainty and increases risk for farmers traders, consumer and government and leads to poor decisions (Barmon & Chaudhury, 2012). This price variability may increase poverty among small land holding farmers (FAO, 2011). But it also can increase the profit of farmers if they decide to sell the price of their harvest when the price goes up (Kilima, Mbiha, Erbaugh, & Larson, 2013).
Price variation is an important component of profit which impact commodity investment behavior, farm income and food security and thus needs to be quantified. The fluctuation in price cannot be forecasted by farmers and the fluctuation of high magnitude has negative impact in farmers. When price of a commodity remains abnormally high for some time, the area under that commodity tends to increase as farmers are attracted towards it with the hope of getting high income which leads to oversupply and thus reduces price (Nsumba, 2017).
Thus, this study was conducted to evaluate the seasonal nature of price movement of citrus fruits viz. Lime and Sweet Orange and to identify the temporal business opportunity in Nepal. The findings of this study will help farmers to understand seasonal pattern of citrus price and enable them to adopt appropriate production, storage and sale strategies as well as assist policy makers to identify seasonal change in price and prepare appropriate policy response.
MATERIALS AND METHODS
Source of Data
The monthly wholesale price of lime and sweet orange from 2057 BS to 2076 BS was collected from Kalimati Fruits and Vegetable Market, the leading terminal wholesale market in Nepal for this study.
Data Analysis Technique
There are different methods to measure Seasonal nature of price variability. Ratio to moving average method to find seasonal index is the most widely used method of measuring seasonal price variation (Meera & Sharma, 2016). A seasonal price index indicates a typical price movement pattern i.e. the average seasonal price variation of commodities over a period of years and can be used as standard for comparison (Rahn, 1968). This method incorporates price effect of inflation, cyclic changes in production, technology change and thus eliminates variations other than seasonal factors such as trend, cyclical and irregular components (Rahn, 1968; Flaskerud & Johnson, 2000). It helps in making better buying, selling and storage decision and can be used to estimate profitability of crop storage (Rahn, 1968; Jayaramu, 2015).
For the estimation of seasonal index, a 12-month moving average was calculated as follows:


And the Center Moving Average (CMA) was calculated as:

Seasonal index is the ratio of observed value of price (Yt) to centered moving average.

Where,
E = Seasonal Factor or index
Yt = Observed price in period t
CMA = Centered Moving average.
Seasonal Price Variation was examined by calculating average seasonal index using monthly data where each month’s price/seasonal index (EA) was computed as the average of the same month’s seasonal index for all years included in the moving average time series. This is obtained by arranging the seasonal indices month-wise for each year and calculating the average for each month.
The indices are expressed as a percentage of the moving average price and adjusted to the base of 100 and is called Adjusted Seasonal Index or Grand Seasonal index (GSI). This can be done by multiplying each month’s average seasonal index by a correction factor as:

Where,  is the correction factor and, EA = Average Seasonal index for a month
The magnitude of price variability was calculated as percentage of difference between highest and lowest de-seasonalized price in each year, as shown in following equation:
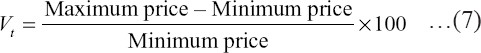
Where,
Vt = magnitude of price variability in year t.
The de-seasonalized price was calculated by taking the ratio of actual price (Yt) to the average seasonal index (EA) for that month. The variability of price was analyzed by calculating the average of price variability of each year from 2057 BS to 2076 BS. Also, the trend of price was observed by using the average of the monthly de-seasonalized price for each year. Mann-Kendal test and Sen’s slope method were used for identifying and quantifying trend of wholesale price.
Furthermore, temporal business opportunity was identified using Gross real storage return (GRSR). Gross storage return is the price margin that exists between the seasons (Mani, Hudu, & Ali, 2018). This method does not take into consideration for the cost of storage (Nsumba, 2017). Return to storage is the difference between price today and the price for delivering on some future dates called forward price or future price (Alexander & Kenkel, 2012). Gross storage return (GSR) can be used to evaluate the feasibility of storage. Higher value of GSR indicates that the return to storage is higher in market and hence farmers can store commodity for future sale (Ngare, Simtowe, & Massingue, 2014).
The GSR can be calculated by computing the percentage increase from seasonal low to seasonal high of Gross seasonal Index (Ngare et al. 2014; Mani et al. 2018). Mathematically, it can be computed as:
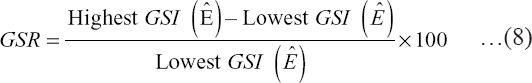
The higher percentage of GSR meant the return to storage for lime and sweet orange was higher in market.
RESULTS AND DISCUSSION
Seasonal Price Variation
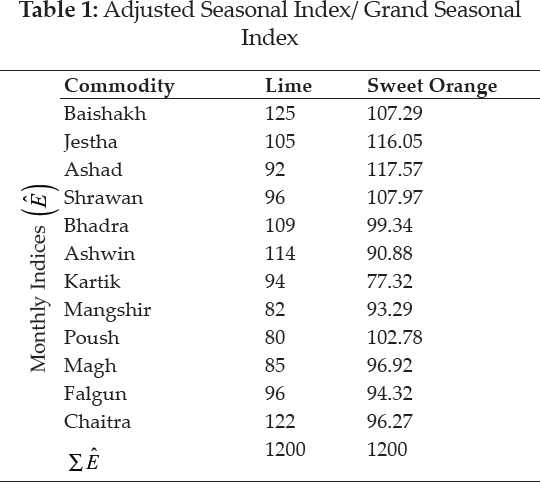
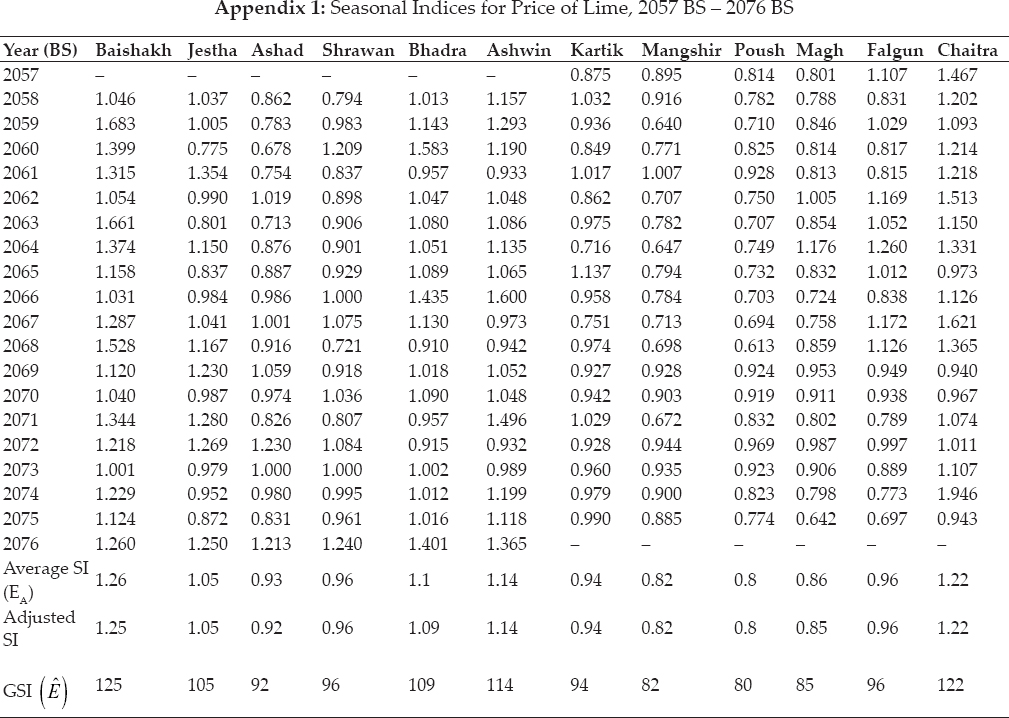
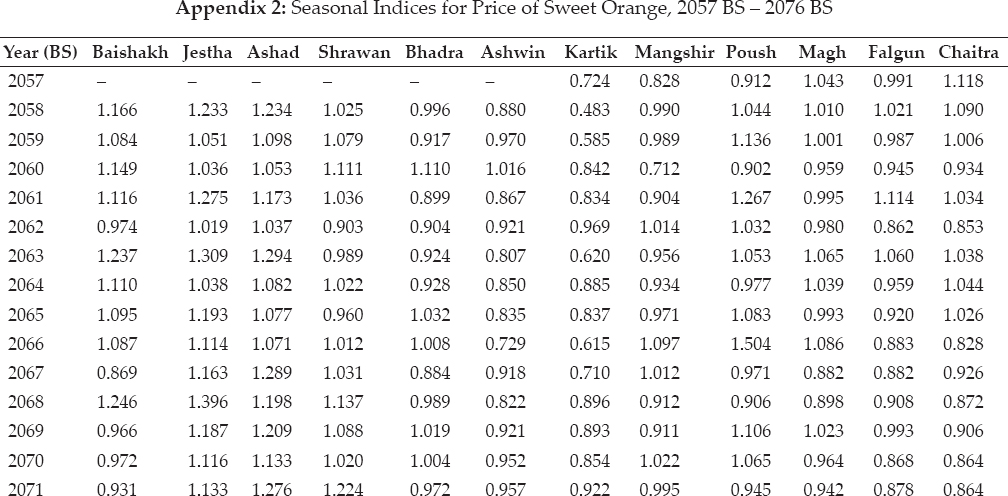
Appendix 1 and 2, that shows the results from seasonal analysis of price of limes and sweet oranges in Nepal, were used to create Table 1, which shows the monthly average seasonal factor (Grand Seasonal Index) for each commodity. The finding from the table shows that the values of average seasonal factor for both lime and sweet orange deviate from average values, that indicate the seasonal nature of price for both commodity in the study area. Furthermore, the seasonal price pattern of lime and sweet orange as indicated by Grand Seasonal Index for 20 years period from 2057 BS to 2076 BS is represented by Fig. 1.
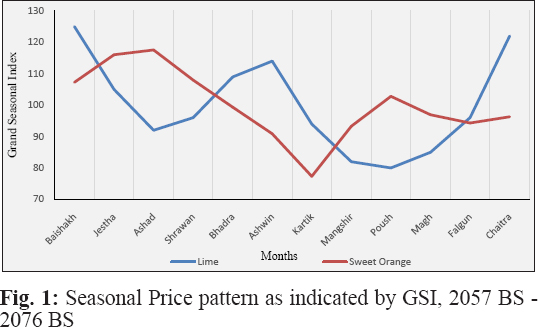
The Grand Seasonal Index  for price of lime were above average in Chaitra, Baishakh, Jestha, Bhadra and Ashwin with the highest GSI in Baishakh (125). However, the Grand Seasonal Index were below average in remaining months with the lowest GSI in Poush (80). This indicates that the price of lime was high in the months of Chaitra, Baihsakh, Jestha, Bhadra and Ashwin with the highest price in Baishakh whereas the price was low in remaining months with the lowest price in Poush.
The result of ANOVA applied to seasonal indices of lime revealed that there was significant difference among the months (p = 2 x 10-16) but no significant difference was observed among the years (p = 0.335) at 5 % level of significance.
The above findings corroborate with that of Dhakal and Tripathi (2005) which revealed the higher price of lime during off season of production that corresponds to summer seasons and further concluded that the wholesale price of lime was highest in April (Chaitra-Baishakh).
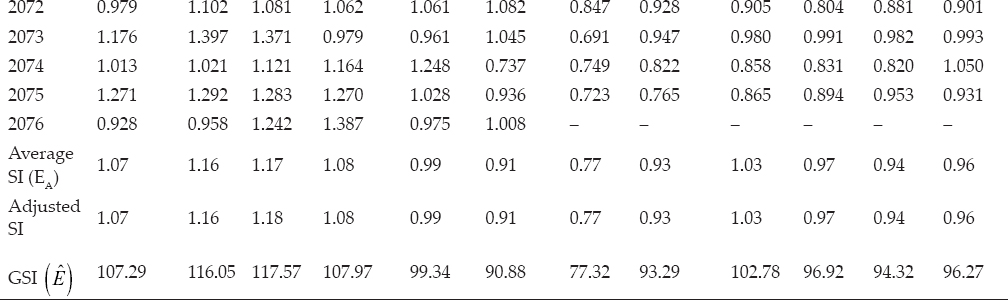
Similarly, the Grand Seasonal Index for price of sweet orange were above average in Baishakh, Jestha, Ashad, Shrawan and Poush with the highest GSI in Ashad (117.97). Whereas the Grand Seasonal Index were below average in remaining months with the lowest GSI in Kartik (77.32). This indicates that the price of sweet orange was high in the months Baishakh, Jestha, Ashad, Shrawan and Poush with the highest price in Ashad and the price was low in remaining months with the lowest price in Kartik.
The result of ANOVA applied to seasonal indices of sweet orange revealed that there was significant Seasonal Price Variation of Lime and Sweet Orange difference among the months (p = 2 x 10-16) but no significant difference was observed among the years (p = 0.83) at 5 % level of significance.
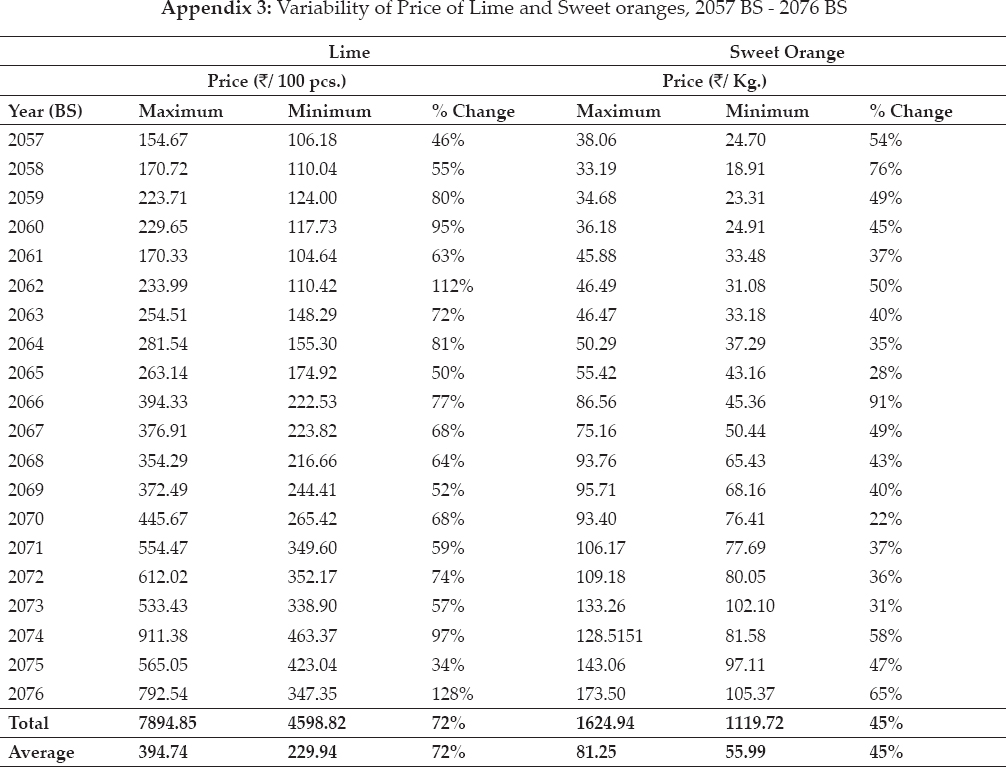
Magnitude of Price Variability
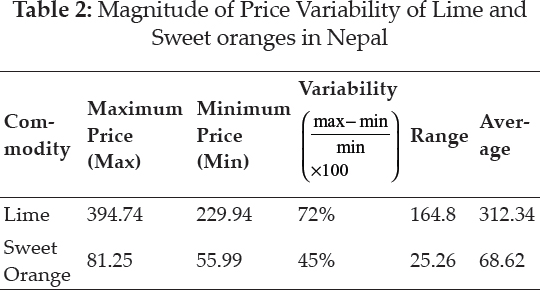
Different pattern of de-seasonalized wholesale price of lime and sweet orange in Nepal is showed in Appendix 3. It showed the occurrence of low and high prices in different period. The price variability of lime and sweet orange in Nepal is summarized in Table 2 which revealed that the magnitude of price variability for lime and sweet orange are about 72% and 45% respectively. The magnitude of price variability is relatively low for sweet orange than for lime. This finding suggested that farmers are more likely to have unstable income from the sale of lime and sweet oranges.
Trend of Wholesale Price
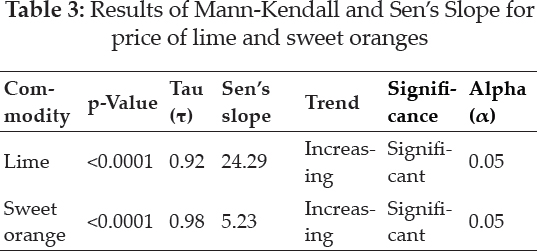
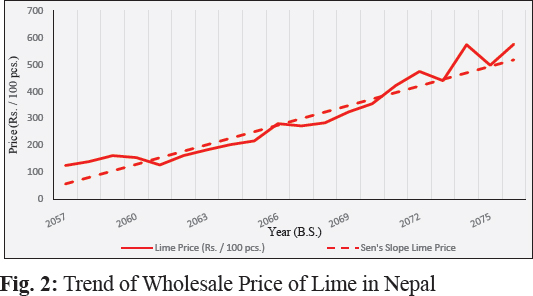
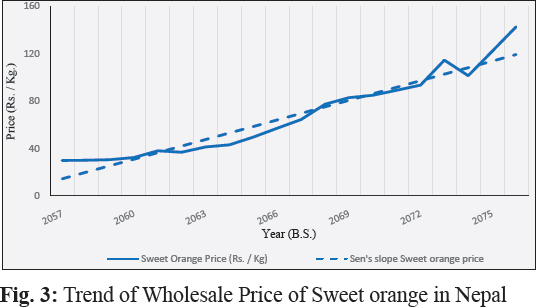
The result of Mann-Kendall test and Sen’s slope for variation in wholesale prices of lime and sweet orange is presented in Table 3, which shows that the trend of wholesale price for both lime and sweet orange was increasing, as indicated by positive tau (T), and was statistically significant at 95% confidence level, as indicated by p-values. It also showed that the wholesale price of lime was increasing at the rate of ₹ 24.29 / 100 pieces per year and the wholesale price of sweet orange was increasing at the rate of ₹ 5.23 / Kg. per year during 20 years period from 2057 BS to 2076 BS. Furthermore, the value of tau (τ) showed very strong correlation of wholesale price with time for both the commodity.
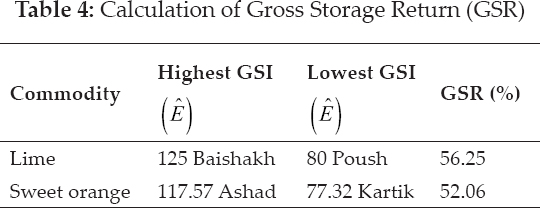
Gross Storage Return
Gross Storage Return (GSR) was computed for lime and sweet orange using information presented in Table 1 and shown in Table 4. It was calculated in order to determine if storing and selling of lime and sweet orange during off season when the prices were expected to rise was profitable.
The result of GSR revealed that it was feasible to store both lime and sweet orange during the peak period of production and sell it when the price rises. It further revealed that there was a gross return of 56.25 % from storage of lime and sale when the price reach maximum. Similarly, there was about 52.06 % gross return from storage of sweet orange and sale during maximum price. This also showed that for a constant cost of storage, it was more profitable to store lime than to store sweet orange.
CONCLUSION
The study of the seasonal pattern and magnitude of wholesale price variability for sweet orange and lime was conducted using a ratio to moving average method. The findings from this study revealed that the monthly average seasonal indices for both lime and sweet orange were significantly different indicating the strong seasonal nature of their prices. It further showed that the seasonal indices for lime were above average in Chaitra, Baishakh, Jestha, Bhadra and Ashoj with the highest in Baishakh, which means that the wholesale price of lime was higher in these months with the highest in Baishakh and farmers are likely to earn more by selling lime during these months. However, the seasonal indices for lime were below average for remaining month with the lowest in Poush, which illustrates that the wholesale price of lime was lower in these months with the lowest in Poush and farmers are likely to earn low by selling their produce during this time. The variability of wholesale price for lime was 72 % which further concludes that farmers are more likely to have unstable earnings from the sale of lime during different months.
Similarly, the seasonal indices for sweet orange were above average in Baishakh, Jestha, Ashad, Shrawan and Poush with the highest in Ashad, that implies that the wholesale price of sweet orange was high during these months with highest in Ashad and farmers will make more earnings by sale of their produce during these months. However, the seasonal indices were below average in the remaining months with the lowest in Kartik, which means the wholesale price was lower during these months with lowest in Kartik and farmers are likely to make low earnings by selling sweet oranges during these months. The variability of wholesale price for sweet orange was 45 % concluding that farmers are likely to have unstable earnings from the sale of sweet orange. Also, it is evident from the highest percentage of wholesale price variability of lime compared to sweet orange, that the earnings from lime is likely to be more unstable that that from sweet orange.
Furthermore, the findings from the study of Gross Storage Return revealed that the storage of both lime and sweet orange was profitable and would yield a return of 56.25 % and 52.06 % respectively if they were to be stored and sold during the months of maximum price.
It is also evident from the study that the wholesale price of lime and sweet orange showed significant and increasing trend during the study period of 20 years from 2057 BS to 2076 BS.
Appendix
REFERENCES
Alexander, C. and Kenkel, P. 2012. Economics of Commodity Storage, p. 305–315. In D.W. Hagstrum, T. W. Phillips, and G. Cuperus, Stored Product Protection. Kansas State University.
Barmon, B.K. and Chaudhury, M. 2012. Impact of Price and Price Variability on Acreage Allocation in Rice and Wheat Production in Bangladesh.
Bhat, A., Kachroo, J. and Singh, S. 2014. A study on behaviour of arrivals and prices of citrus in Narwal market of Jammu, India.
Camara, O. 2013. Seasonal price variability and the effective demand for nutrients: Evidence from cereals markets in Mali.
Dhakal, D. and Tripathi, K.M. 2005. Marketing Survey of Acid Lime and Hill Lemon in Nepal.
FAO. 2011. Safeguarding Food Security in Volatile Global Markets. Rome: Food and Agriculture Organization of the United Nations (FAO).
Flaskerud, G. and Johnson, D. 2000. Seasonal Price Patterns for Crops. Fargo, North Dakota: NDSU Extension Service.
Godara, C.P. and Bhonde, S.R. 2006. Market arrivals and price trend of important fruits at Azadpur mandi, Delhi.
Jayaramu, N. 2015. Impact of Seasonality on Agricultural Commodity Price Behavior. Thesis. Northern Missouri State University, Maryville, Missouri, United States of America.
Kilima, F.T., Mbiha, E.R., Erbaugh, M. and Larson, D. 2013. Seasonal variability of Sorghum and Pearl Millet Price in Drought Prone Areas of Tanzania Eastern and Southern.
Kumar, V., Sharma, H. and Singh, K. 2005. Behaviour of Market arrivals and price of selected vegetable crops: A Study of Four Metropolitian Markets.
Mani, J.R., Hudu, M.I. and Ali, A. 2018. Price Variation of Tomatoes and Ginger in Giwa Market, Kaduna State, Nigeria.
Meera, and Sharma, H. 2016. Trend and seasonal analysis of wheat in selected market of Sriganganagar district.
Mishra, R. and Kumar, D. 2012. Price Behaviour of Major Vegetables in Hill Regions of Nepal: An Econometric Analysis.
Moniruzzaman, S., Islam, M., Sabur, S., Alam, A.M., and Alamgir, M. 2008. Seasonal Price Variation and Problem Faced By The Growers and Traders of Raw Jute Production and Marketing in Bangladesh.
Ngare, L., Simtowe, F. and Massingue, J. 2014. Analysis of price volatility and Implications for price Stabilization Policies in Mozambique.
Noonari, S., Irfana, N., Raiz, A., Muhammad, I. and Shahbaz, A. 2015. Price Flexibility and Seasonal Variation of Major Vegetables in Sindh Pakistan.
Nsumba, T.I. 2017. Seasonal variability of rice prices, temporal and spatial business opportunities in the major rice production areas of Tanzania. Doctoral dissertation. Sokoine University of Agriculture, Morogoro, Tanzania.
Rahn, A.P. 1968. Seasonal Price Pattern of Selected Agricultural Commodities. Iowa State University. Disponible en http://lib.dr.iastate.edu/specialreports/56.
Sahu, C.R. 2018. A statistical study of variation in arrivals and prices of paddy in Chhattisgarh. Doctoral Dissertation. Department of Agriculture Statistics and social Science, College of Agriculture, Raipur; Faculty of Agriculture; Indira gandhi krishi vishwovidyalaya, Raipur.
Sani, B. and Farahani, H.A. 2011. Determination of seasonal price variations for some food crops in Iran at Karaj zone to achieve Sustainable Agriculture.
Sharma, H. and Burark, S. 2015. A Study in Seasonal Price Behaviour and Market Concentration of Maize in Rajasthan.
Sulaiman, H., Doucha, T. and Kandakov, A. 2014. Characteristics of citrus fruit price developments on the Latakia markets, the Syrian Arab republic, as preconditions for a functional marketing information system. Engineering for Rural Development (Jelgava).
Thornsbury, S., Buzby, J., Hitaj, C., Kantor, L., Kuchler, F., Ellison, B., . . . Mishra, A. 2020. Economic Drivers of Food Loss at the Farm and Pre-Retail Sectors: A Look at the Produce Supply Chain in the United States. United States Department of Agriculture.
Timmer, P. 2011. Managing Price Volatility: Approaches at the global, national, and household levels. Stanford Symposium Series on Global Food Policy and Food Security in the 21st Century. Bechtel Conference Center, Stanford University: Center on Food Security and the Environment.