International Journal of Agriculture, Environment and Biotechnology
Citation: IJAEB: 13(4): 371-381, December 2020
DOI: 10.30954/0974-1712.04.2020.1
![]()
GENETICS AND PLANT BREEDING
Stability Index Based on Weighted Average of Absolute Scores of AMMI and Yield of Wheat Genotypes Evaluated Under Restricted Irrigated Conditions for Peninsular Zone
ABSTRACT
Highly significant effects of environment (E), G×E interaction and genotypes (G) were observed by AMMI analysis during 2018–19 and 2019–20 study years for wheat genotypes evaluated at major locations of Peninsular zone of the country. WAASB measure observed suitability of HI 1605, HI 8805 & HI 8802 genotypes. Superiority index while weighting 0.65 and 0.35 for yield & stability found MACS 6695, HI 1605 & NIAW 3170 as of stable performance with high yield. PRVG and MHPRVG measures observed suitability of NIAW 3170, MACS 6695 & MACS 6696 wheat genotypes. Moreover, the average yield of genotypes ranked NIAW 3170, MACS 6695 & MACS 6696 as of order of choice. SI expressed only negative values of correlations most of other stability measures except of MHPRVG, PRVG, yield. WAASB measure exhibited direct relationships with other measures analogous of negative values with MASV, SI, MHPRVG, PRVG, yield. Analytic measures MHPRVG & PRVG had only positive values with SI, and yield remaining stability measures maintained negative values. MP1358, NIDW1149 & NIAW3170 would be suitable genotypes as per WAASB measure during second year of study. Superiority index found MP1358, NIAW3170 & MACS4087 as of stable performance with high yield. PRVG and MHPRVG measures observed suitability of MP1358, HI1605 & MACS4087 wheat genotypes. More over the average yield of genotypes ranked MP1358, MACS4087 & HI1605 as of order of choice. SI expressed mostly negative values other measures except of weak direct relation with MASV1, MASV along with strong with yield, MHPRVG & PRVG measures. WAASB measure exhibited direct relationships with other measures and indirect with only MASV1& SI.
Highlights
 Stability measure WAASB based on all significant interaction principal components observed suitability of wheat genotypes associated with lower values of measure.
Superiority index provided variable weighting mechanism between stability and yield of genotypes under multi environment trials. Assigning 0.65 and 0.35 weights to yield & stability respectively selected wheat genotypes of stable performance with high yield.
Recent analytic measures of stability PRVG and MHPRVG measures expressed strong association with superiority index.
Keywords: AMMI analysis, ASV, SIPC, Za, EV, SI, SSI, Biplot graphs
Additive main effects and multiplicative interaction (AMMI) model had been most widely used analytic tool to analyse and estimate GxE interaction in multi environmental trials (Zhang et al. 1998; Gauch 2013; Veenstra et al. 2019). Cross over genotype-by-environment interactions hinder the selection process of breeders (Bocianowski et al. 2019). Biased interpretation of stability of genotypes observed for instances where low proportion of the variance explained by first interaction principal component IPCA1 (Zali et al. 2012; Ajay et al. 2019; Olivoto et al. 2019). Stability measure (WAASB) considered the weighted average of all the significant IPCA scores based on the sum of absolute values of the IPCA scores (Olivoto 2018). The stable genotype judged the lower value of WAASB measure. Ranking of genotypes based on yield as well as stability in multi-environment-trials is essential as it can assist breeders in choosing best genotype for a location. The simultaneous consideration of yield and stability in a single measure by adding the corresponding ranks had been advocated (Kang 1993; Farshadfar 2008; Farshadfar et al. 2011). WAASBY i.e. superiority index allowed variable weighting between yield and stability (WAASB) (Olivato 2019). The present study was planned to validate the relationships between SI and other AMMI based stability measures for wheat genotypes evaluated under multi environmental trials in the Peninsular Zone of the country under restricted irrigated timely sown trials in recent past.
How to cite this article: Verma, A. and Singh, G.P. 2020. Stability Index Based on Weighted Average of Absolute Scores of AMMI and Yield of Wheat Genotypes Evaluated Under Restricted Irrigated Conditions for Peninsular Zone. IJAEB, 13(4): 371–381.
Source of Support: None; Conflict of Interest: None ![]()
MATERIALS AND METHODS
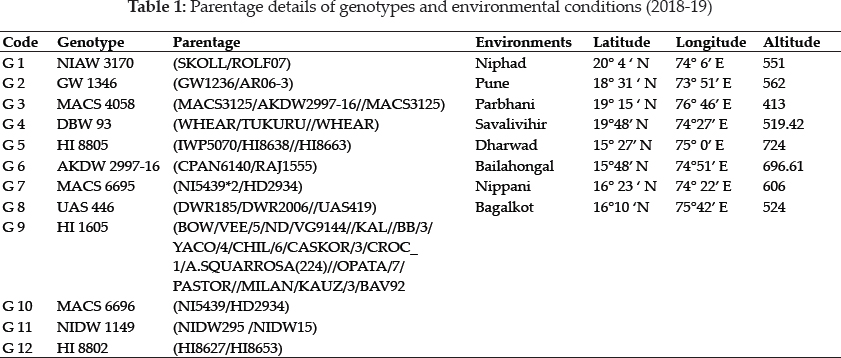
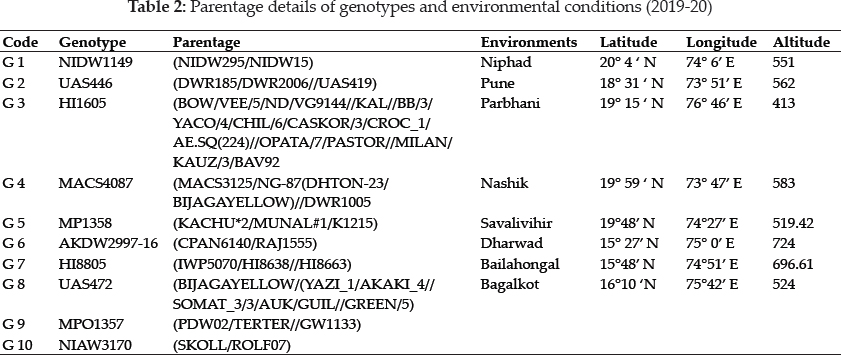
Mainly Maharashtra and Karnataka states represents the Peninsular zone of our country. All three species of wheat viz T. aestivum, T. durum, and T. dicoccum are cultivated in this zone. Bread wheat cultivation is concentrated under irrigated environments, whereas, the cultivation of durum and dicoccum wheat is generally confined to rainfed/ restricted irrigation situation. Twelve advanced promising wheat genotypes eight major locations and ten genotypes at eight locations were evaluated under field trials during 2018–19 and 2019–20 cropping seasons respectively. Field trials were conducted at research centers in randomized complete block designs with three replications. Recommended agronomic practices were followed to harvest good yield. Details of genotype parentage along with environmental conditions were reflected in tables 1 & 2 for ready reference. Stability measure Weighted Average of Absolute Scores has been calculated as

where WAASBi. is the weighted average of absolute scores of the ith genotype (or environment); IPCAk is the score of the ith genotype (or environment) in the kth IPCA, and EPk is the amount of the variance explained by the kth IPCA. Superiority index allowed variable weights to yield and stability measure (WAASB) to select genotypes that combine high performance and stability as,
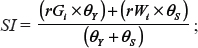
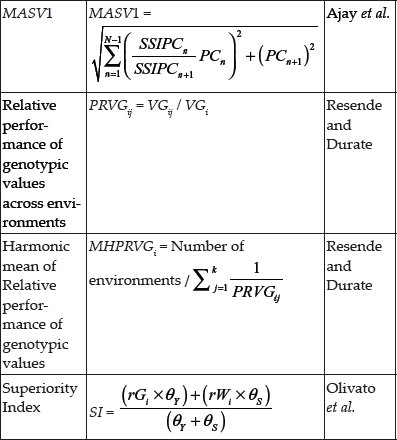
where, rGi and rW. are the rescaled values for yield and WAASB, respectively, for the ith genotype; G. and Wi are the yield and the WAASB values for ith genotype. SI superiority index for the ith genotype that weights between yield and stability, and θY and θS are the weights for yield and stability assumed to be of order 65 and 35 respectively in this study, AMMI analysis was performed using AMMISOFT version 1.0, available at https://scs.cals.cornell.edu/ people/ hugh-gauch/ and SAS software version 9.3. Stability measures had been compared with recent analytic measures of adaptability calculated as the relative performance of genetic values (PRVG) and harmonic mean based measure of the relative performance of the genotypic values (MHPRVG) for the simultaneous analysis of stability, adaptability and yield (Resende and Durate 2007).
RESULTS AND DISCUSSION
First year of study (2018-19)
AMMI analysis of genotypes
The AMMI model is comprised of additive main effects of genotype and environment, and the multiplicative effect of GxE interaction, and thus can explain more information compared to other methods (Gauch 2013). AMMI analysis as such does not make provision for a quantitative stability measure that is deemed useful to quantify the ranking of studied genotypes according to their yield stability. AMMI stability parameters permit to evaluate yield stability after reduction of the noise from the G×E interaction effects (Zhang et al. 1998). Highly significant effects of environment (E), G×E interaction and genotypes (G) had been observed by AMMI analysis (Table 3). Environment explained about significantly 21.6% of the total sum of squares due to treatments indicating that diverse environments caused most of the variations in genotypes yield (Table 3). Significant proportion of G>E interaction deserves the stability estimation of genotypes over environments (Veenstra et al. 2019). Genotypes explained only 18% of total sum of squares, whereas GxE interaction accounted for 21.5% of treatment variations in yield. More of GxE interaction sum of squares as compared to genotypes indicated the presence of genotypic differences across environments and complex GxE interaction for wheat yield. Further partitioning of GxE interaction revealed that the first six multiplicative terms (IPCA1, IPCA2, IPCA3, IPCA4, IPCA5 and IPCA6) explained 47.1%, 17.9% , 14.7%, 9.4%, 8.2% and 1.9 % of interaction sum of squares, respectively. Total of significant components were 99.3 % and remaining 0.7% is the residual or noise, which is not interpretable and thus discarded (Adjebeng et al. 2017).
Stability analysis
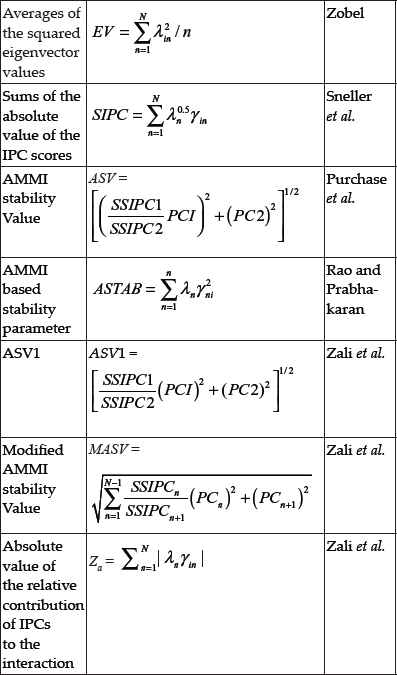
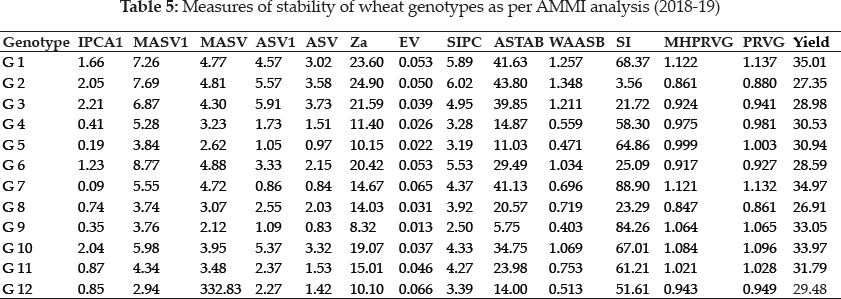
Low absolute value of IPCA1 expressed by G7, G5, G9 and higher value achieved by G3 (Table 5). Minimum values of (EV) associated with stable genotype accordingly, the genotype G9 followed by G5 G4 and G12 had the maximum value of EV measure. SIPC measure identified G9 followed by G5, G4 possessed lower value, whereas G2 would be of least stable behaviour. Za measure considered absolute value of the relative contribution of IPCs to the interaction revealed G8, G12 and G5 genotypes as most stable in descending order of stability, whereas G2 genotype with the least stability. ASTAB measure observed genotypes G9 G5 and G12 as most stable and genotype G2 was least stable in this study (Rao and Prabhakaran 2005). ASV measure showed that genotypes G9, G7, G5 possessed lower values would express stable performance and G3 be of least stable type. Values of ASV1 selected G7 G5 G9 for their stable behaviour whereas G3 would express unstable performance. Measures MASV and MASV1 consider all significant IPCAs. Values of MASV showed that the genotypes, G9,G5 and G8 were most stable and G12 G8 & G9 would be stable by MASV1measure respectively (Ajay et al. 2019). The lower values of WAASB associated with stable nature of genotypes as G9, G5, G12 for considered locations of the zone at the same time maximum value obtained by G2, that is, the one that deviates maximum from the average performance across environments. Lower value of Superiority index had observed for G2 G3 and G8 whereas large value by G7. Genotypes G8 G2 and G6 were identified for their more stable yield performance by MHPRVG as well as by PRVG measures and G1 with least stable yield. Maximum yield expressed by G1 G7 followed by G2 and G10 as good variation had been observed from 26.9 to 35 q/ha among genotypes.

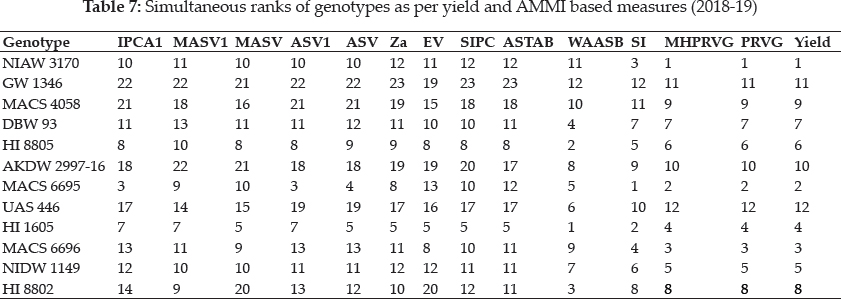
Ranking of wheat genotypes as per AMMI based measures and yield
Stability alone is not a desirable selection criterion as stable genotypes may not be a high yielders, simultaneous use of yield and stability in a single measure is essential (Kang 1993; Farshadfar et al. 2008). Simultaneous Selection Index also referred to as genotype stability index (GSI) or yield stability index (YSI) (Farshadfar et al. 2011) was computed by adding the ranks of stability measure and average yield of genotypes. Ranks for IPCA1 measure selected MACS 6695, HI 1605 & HI 8805 for stable high yield performance, whereas high values suggested as least stable yield for GW 1346 (Table 7). EV measure identified HI 1605, HI 8805 & MACS 6696 whereas by SPIC favoured genotypes were HI 1605, HI 8805 & DBW 93. Genotypes HI 1605, MACS 6695 & HI 8805 possessed lower value of Za measure. WAASB measure observed suitability of HI 1605, HI 8805 & HI 8802 genotypes. Superiority index while weighting 0.65 and 0.35 for yield & stability found MACS 6695, HI 1605 & NIAW 3170 as of stable performance with high yield. Analytic measures MASV and MASV1 consider all significant principal components of interactions. MASV HI 1605, HI 8805, MACS 6696 genotypes of choice for these locations of the zone as and MASV1 settled for HI 1605, HI 8802. MACS 6695. Least magnitude of ASV and ASV1 pointed towards MACS 6695, HI 1605 and HI 8805 wheat genotypes (Oyekunle et al. 2017). PRVG and MHPRVG measures observed suitability of NIAW 3170, MACS 6695 & MACS 6696 wheat genotypes. Moreover, the average yield of genotypes ranked NIAW 3170, MACS 6695 & MACS 6696 as of order of choice. In the present study, all measures identified genotypes HI 1605, MACS 6696 and HI 8805 as stable and high yielders.
Biplot graphical analysis
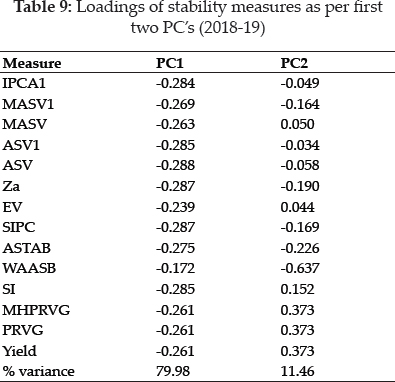
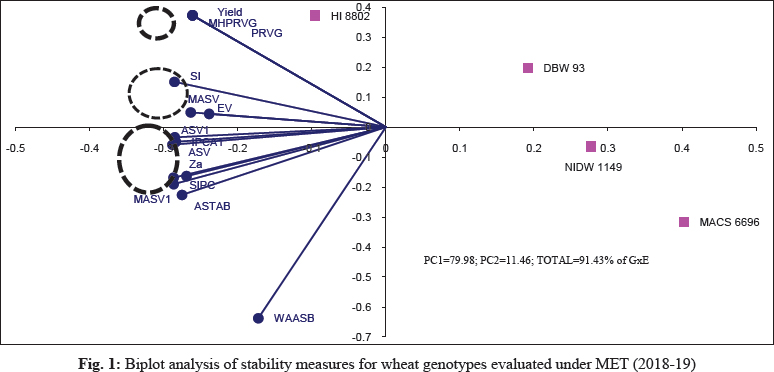
Loadings of stability measures as per first two significant principal components for evaluated wheat genotypes were reflected in table 9. Biplot graphical analysis based on two significant principal component analysis (PCA) as these PCAs accounted for 91.4% of variation of the original variables (Balestre et al. 2019). The stability measures of wheat genotypes grouped into three major groups (Fig. 1). SI clubbed with MASV and EV. Yield clubbed with PRVG & MHPRVG measures. Large group consisted of ASTAB, ASV, IPCA1, ASV1, SIPC, Za, MASV1. Measure WAASB maintained distance from stability measures and observed as outlier in graphical analysis.
Association analysis
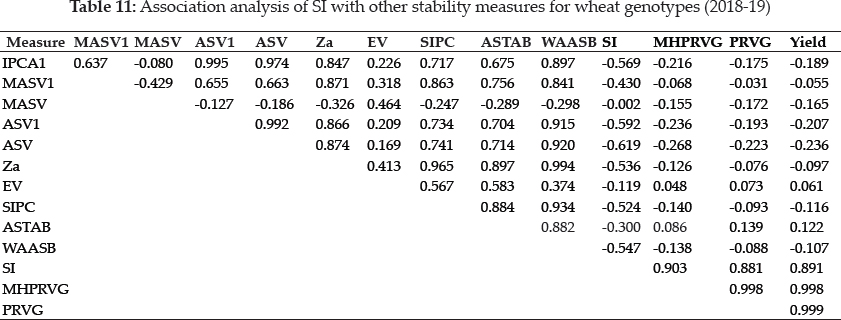
Average yield expressed only significant positive correlations with SI, ASTAB, MHPRVG, PRVG & EV (Table 11). SI expressed only negative values of correlations most of other stability measures except of MHPRVG, PRVG, yield. Only indirect relations were observed with stability measures (EV, SIPC) by SI measure otherwise positive values of correlation were seen. WAASB measure exhibited direct relationships with other measures analogous of negative values with MASV, SI, MHPRVG, PRVG, yield.
Analytic measures MHPRVG & PRVG had only positive values with SI, and yield remaining stability measures maintained negative values. AMMI based measures Za, SIPC, SV, ASV1, MASV1 and ASTAB achieved only positive correlation values among themselves and with others (Ajay et al. 2019). More over MASV had maintained only negative relationships with all measures. Negative correlations of SIPC with SI, PRVG, MHPRVG and yield were of low magnitude. Indirect relations of Za observed with PRVG, MHPRVG and yield of moderate negative values. Same behaviour of negative correlations had displayed by IPCA1, ASV1, MASV1, ASV, MASV also.
Second year of study (2019-20)
AMMI analysis of genotypes
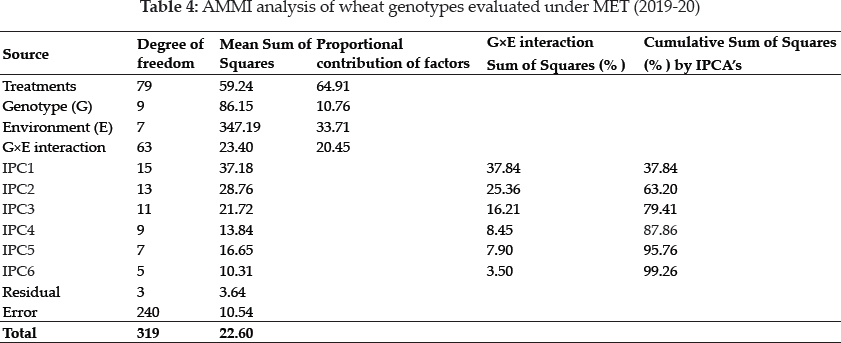
Highly significant effects of environment (E), G×E interaction and genotypes (G) had been observed by AMMI analysis. Environment explained about significantly 33.7% of the total sum of squares due to treatments indicating that diverse environments caused most of the variations in genotypes yield (Table 4). Significant proportion of G×E interaction deserves the stability estimation of genotypes over environments (Veenstra et al. 2019). Genotypes explained only 10.7% of total sum of squares, whereas GxE interaction accounted for 20.5% of treatment variations in yield. Partitioning of GxE interaction revealed that the first six multiplicative terms (IPCA1, IPCA2, IPCA3, IPCA4, IPCA5 and IPCA6) explained 37.8%, 25.4% , 16.2%, 8.5%, 7.9% and 3.5 % of interaction sum of squares, respectively. Total of significant components were 99.3 % and remaining 0.7% is the residual or noise, which is not interpretable and thus discarded (Adjebeng et al. 2017).
Stability analysis
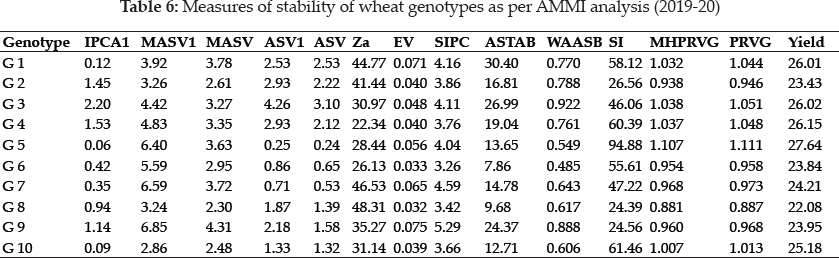
Wheat genotypes G5, G10, G1 expressed least value of IPCA1 and higher value achieved by G3 (Table 6). The genotype G8, G6 followed by G10 had expressed lower and G9 showed the maximum value of EV measure. The lower value SIPC measure identified G6 followed by G8, G10 as the most stable genotypes, whereas G9 would be of least stable behaviour. Za measure revealed G4 G6 and G5 would be stable genotypes in descending order of stability, whereas G8 genotype with the least stability. ASTAB measure observed genotypes G7 G8 and G10 as most stable and genotype G1 was least stable in this study (Rao and Prabhakaran 2005). ASV and ASV1measures showed that genotypes G5, G7, G6 possessed lower values would express stable performance as compared to G3. Analytic measures MASV and MASV1 consider all the significant IPCAs. Values of MASV showed that the genotypes G8 G10 and G2 were most stable while MASV1 measure suggested the stable behaviour of G10, G8 & G2 genotype (Ajay et al 2019). Stable nature of genotypes as G6, G5, G10 confirmed with the lower values of WAASB measure for considered locations of the zone at the same time G3 deviated maximum from the average performance across environments. Lower value of Superiority index had observed for G8 G9 and G2 whereas unstable performance of G5 by large value. Genotypes G8 G2 and G6 were identified by MHPRVG and PRVG measure along with least stable yield of G5. Maximum yield expressed by G5 followed by G4 and G3 as good variation had been observed from 22 to 27.5 q/ha among genotypes.
Ranking of wheat genotypes as per AMMI based measures and yield
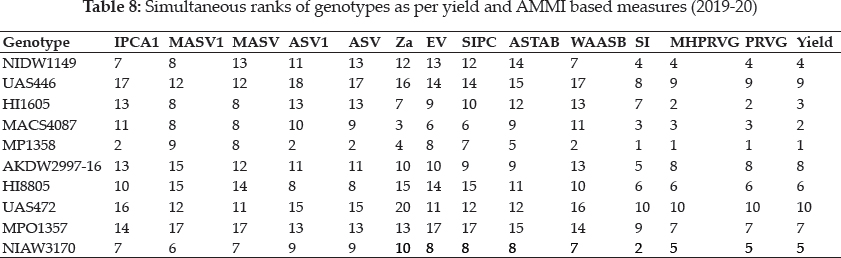
Least ranks of IPCA1 measure considered MP1358, NIAW3170 & NIDW1149 were as stable with high yield, whereas high values suggested as least stable yield for UAS446 (Table 8). EV measure identified MACS4087, MP1358 & NIAW3170 whereas SPIC favoured MACS4087, MP1358 & NIAW3170 genotypes. MACS4087, MP1358 & HI1605 possessed lower value of Za measure. WAASB measure observed suitability of MP1358, NIDW1149 & NIAW3170 genotypes. Superiority index while weighting 0.65 and 0.35 for yield & stability found MP1358, NIAW3170 & MACS4087 as of stable performance with high yield. Composite measures MASV as well as MASV1 selected NIAW3170, HI1605, MACS4087 genotypes of choice for these locations of the zone. Values of least magnitude of ASV and ASV1 pointed towards MP1358, HI8805 and NIAW3170 wheat genotypes (Oyekunle et al. 2017). PRVG and MHPRVG measures observed suitability of MP1358, HI1605 & MACS4087 wheat genotypes. More over the average yield of genotypes ranked MP1358 , MACS4087 & HI1605 as of order of choice. In the present study, all measures identified genotypes MACS4087, MP1358 & NIAW3170 as stable and high yielders.
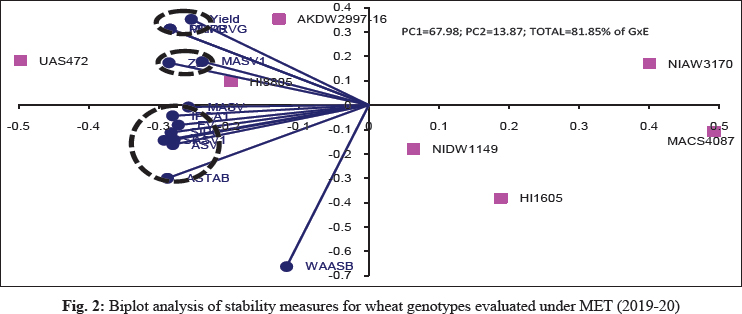
Biplot graphical analysis
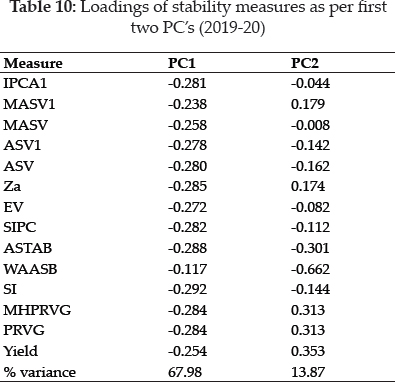
Loadings of stability measures as per first two significant principal components for evaluated wheat genotypes were reflected in table 10. Biplot graphical analysis based on two significant principal component analysis (PCA) the simultaneous ranks (Fig. 2). These two PCAs accounted for 81.8% of variation of the original variables (Balestre et al. 2019). The stability measures of wheat genotypes grouped into three major groups. MASV1 clubbed with Za and yield grouped with PRVG & MHPRVG measures. Larger group comprises of ASTAB, MASV, ASV, IPCA1, ASV1, SIPC. Measure WAASB maintained distance from stability measures and observed as outlier in analysis.
Association analysis
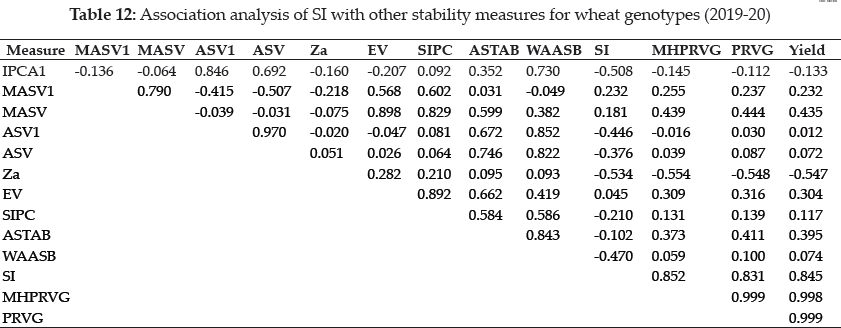
Mean yield showed mostly positive correlations and only negative values expressed towards Za and IPCA1. Similar behaviour of MHPRVG & PRVG measures seen with other stability measures (Table 12). SI expressed mostly negative values other measures except of weak direct relation with MASV1, MASV along with strong with yield, MHPRVG & PRVG measures. WAASB measure exhibited direct relationships with other measures and indirect with only MASV1 & SI. AMMI based measures SIPC, SV, MASV1, MASV and ASTAB achieved only positive correlation values among themselves and with others (Ajay et al. 2019). More over Za and EV had maintained positive relationships with other non AMMI based measures. ASTAB, ASV, ASV1, SIPC, Za had indirect relation with SI measure.
CONCLUSION
AMMI model is an effective tool to study GxE interaction in multi-environment yield trials. Stability measures by simultaneous use of AMMI model and yield would be more meaning full and useful as compared to measures consider either the AMMI or yield of genotypes only. The stability measures found to be correlated well with each other. Measures MASV, MASV1, WAAB and SI could be used to identify stable high-yielding genotypes. Stability measures by simultaneous use of AMMI model and yield would be more meaning full and useful as compared to measures consider either the AMMI or yield of genotypes only.
ACKNOWLEDGEMENTS
The wheat genotypes were evaluated at research fields at coordinated centers of AICW&BIP across the country. First author sincerely acknowledge the hard work of all the staff for field evaluation and data recording of wheat genotypes.
REFERENCES
Adjebeng-Danquah, J., Manu-Aduening, J., Gracen, V.E., Asante, I.K. and Offei, S.K. 2017. AMMI stability analysis and estimation of genetic parameters for growth and yield components in cassava in the forest and guinea savannah ecologies of Ghana. Int. J. Agron., pp. 1–10.
Ajay, B.C., Aravind, J., Fiyaz R Abdul, Kumar Narendra, Lal Chuni, Gangadhar, K., Kona Praveen, Dagla, M.C. and Bera, S.K. 2019. Rectification of modified AMMI stability value (MASV). Indian J. Genet., 79(4): 726–731.
Balestre, M., Von Pinho, R.G., Souza, J.C. and Oliveira, R.L. 2009. Genotypic stability and adaptability in tropical maize based on AMMI and GGE biplot analysis. Genet. Mol. Res., 8: 1311–1322.
Bocianowski, J., Niemann, J. and Nowosad, K. 2019. Genotype-by environment interaction for seed quality traits in interspecific cross-derived Brassica lines using additive main effects and multiplicative interaction model. Euphytica, 215(7): 1–13.
Bornhofen, E., Benin, G., Storck, L., Woyann, L.G., Duarte, T., Stoco, M.G. and Marchioro, S.V. 2017. Statistical methods to study adaptability and stability of wheat genotypes. Bragantia, 76: 1–10.
Farshadfar, E. 2008. Incorporation of AMMI stability value and grain yield in a single non-parametric index (GSI) in bread wheat. Pak. J. Biol. Sci, 11: 1791–1796.
Farshadfar, E., Mahmodi, N. and Yaghotipoor, A. 2011. AMMI stability value and simultaneous estimation of yield and yield stability in bread wheat (Triticum aestivum L.). Aust. J. Crop Sci., 5: 1837–1844.
Gauch, H.G. 2013. A simple protocol for AMMI analysis of yield trials. Crop Sci., 53: 1860–1869.
Kang, M.S. 1993. Simultaneous selection for yield and stability in crop performance trials: Consequences for growers. Agron. J, 85: 754–757.
Olivoto, T. 2018. WAASB data, Mendeley Data, v2. doi. org/10.17632/2sjz32k3s3.2
Olivoto, T. 2019. Metan: multi environment trials analysis. R package version 1.1.0. https://github.com/TiagoOlivoto/metan.
Olivoto, T., Lucio A Dal'Col, Gonzalez, Silva JA da, and Marchioro, V.S. 2019. Mean performance and stability in multi-environment trials I: Combining features of AMMI and BLUP techniques. Agron. J., 111: 1–12.
Oyekunle, M., Menkir, A., Mani, H., Olaoye, G., Usman, I.S. and Ado, S.G. 2017. Stability analysis of maize cultivars adapted to tropical environments using AMMI analysis. Cereal Res. Commun., 45: 336–345.
Purchase, J.L., Hatting, H. and Deventer C.S. van. 2000. Genotype < environment interaction of winter wheat (Triticum aestivum L.) in South Africa: II. Stability analysis of yield performance. S. Afr. J. Plant Soil, 17: 101–107.
Ramburan, S., Zhou, M. and Labuschagne, M. 2011. Interpretation of genotype < environment interactions of sugarcane: Identifying significant environmental factors. Field Crops Res., 124: 392–399.
Rao, A.R. and Prabhakaran, V.T. 2005. Use of AMMI in simultaneous selection of genotypes for yield and stability. J. Ind. Soc. Agri. Stat., 59: 76–82.
Resende, M.D.V. and Duarte, J.B. 2007. Precision and Quality Control in Variety Trials. Pesquisa Agropecuaria Tropical, 37: 182–194.
Sneller, C.H., Norquest L Kilgore and Dombek, D. 1997. Repeatability of yield stability statistics in soybean. Crop Sci, 37: 383–390.
Veenstra, L.D., Santantonio, N., Jannink, J.L. and Sorrells, M.E. 2019. Influence of genotype and environment on wheat grain fructan content. Crop Sci., 59: 190–198.
Zali, H., Farshadfar, E., Sabaghpour, S.H. and Karimizadeh, R. 2012. Evaluation of genotype < environment interaction in chickpea using measures of stability from AMMI model. Ann. Biol. Res., 3: 3126–3136.
Zhang, Z., Lu, C. and Xiang, Z.H. 1998. Analysis of variety stability based on AMMI model. Acta Agronomica Sinica, 24: 304–309.