Economic Affairs, Vol. 65, No. 3, pp. 309-321, September 2020
DOI: 10.46852/0424-2513.3.2020.1
![]()
The Politics of Rice Production in Nigeria-Can Nigeria Become Net Exporter or Will Remained Net Importer?
ABSTRACT
Of recent, the government of Nigeria has been keen in changing the narrative of rice production viz. striving to make the country self-sufficient in rice production. To achieve this, various efforts viz. import ban, credit support programmes etc were embarked upon to boost domestic production in order to meet its demand and possibly engage in exportation soonest. It is in view of this that this research was conceptualized to see whether this goal is feasible or the country would remain a net importer. Time series data which spanned for a period of 58 years (1961-2018) and covered production, area, yield and producer prices were used. The data source was FAO data bank and the collected data were analyzed using both descriptive and inferential statistics. The empirical evidence showed that growth rate in the production of rice through the economic reform periods was driven majorly by area expansion with technological effect been marginal. In addition, the current acreage allocation was governed by price, area and institutional factors. Furthermore, rice production has been marked by virulent instability across all the reform periods, thus the country’s rice production has not been in the comfort zone. In addition, the empirical evidence showed area risk and uncertainty-climate change to be the major factors responsible for production variability across the reform periods. Besides, area effect predominates in determining the production growth of rice throughout the economic periods. The future food security of rice in the decade ahead is not promising given that the production trend of rice would be fluctuating, thus a threat to the country’s economic viz. rice food security and foreign reserve. Therefore, realistic and holistic policies are needed to change the future narrative of the country’s rice food security; otherwise the country will remained a net importer.
Highlights
 Achieving self-sufficiency in rice production will help the country to contain economic pilfering viz. foreign reserve depletion, thus enhance Nigeria’s GDP.
Production growth of rice owed majorly to area expansion with area risk and uncertainty been the major factors that caused production variability.
Keywords: Growth, Instability, Forecast, Production, Rice, Nigeria
Nigeria is the continent’s leading consumer of rice, one of the largest producers of rice in Africa and simultaneously one of the largest rice importers in the world. In Nigeria, rice still remains a staple food; approximately 7 million metric tonnes is been consumed annually (Russon, 2019), thus, creating a supply deficit of approximately 3 million MT (KPMG, 2019). This is a lot of demand, and in order to meet this demand the country has imported large volume of the grain. However, according to the African Development Bank (ADB), the import is not only peculiar to Nigeria as approximately $35 billion has been spent on food import across the Africa continent annually. This is despite the fact that two-thirds of the world’s most arable uncultivated land is located in Africa (Russon, 2019). As well as an important food security crop, it is an essential cash crop for its mainly small-scale producers who commonly sell 80 percent of total production and consume only 20 per cent.
How to cite this article: Sadiq, M.S., Singh, I.P. and Ahmad, M.M. (2020). The Politics of Rice Production in Nigeria-Can Nigeria Become Net Exporter or Will Remained Net Importer?. Economic Affairs, 65(3): 309–321.
Source of Support: None; Conflict of Interest: None ![]()
In 2015, Nigeria’s Central bank banned the use of its foreign exchange to pay for rice imports and has provided loans of at least 40 billion naira ($130 million) to help small-holder farmers boost output (George, 2020). Besides, it banned rice imports across all its land borders and kept hefty 70 percent tariffs on imports coming through ports, all aimed at encouraging domestic production, thus boosting its food security. Despites these measures, in the markets where most Nigerians buy their foods, sacks of home-grown rice are piled high but imported rice is still available, even though some traders keep the foreign grain under wraps to prevent it being confiscated by customs agents. George (2020), reported that Agricultural data specialist viz. Gro-Intelligence, put Nigeria’s rice output at 4.9 million tonnes in 2019; up 60% from 2013 but well below local consumption of 7 million tonnes. Meanwhile, the USDA expects Nigeria’s 2020 rice imports to increase by 9% i.e. 2.4 million tonnes, in part due to the high cost of unprocessed Nigerian paddy rice and elevated operating costs at mills.
According to KPMG (2020), the Nigerian agricultural landscape is changing, with increased government policies aimed at stimulating private sector involvement and boosting local production of key products. In line with the diversification drive of the present dispensation as well as fulfillment of one of its cardinal pillars of food security, it is expected that the government will continue to priorities activities within the Agriculture sector through targeted policies to attract investments. With the rapid growth in the country’s population which is estimated to exceed 200 million by 2019; it is expected that the demand for rice will be sustained and increased in the foreseeable future. But the question is, can the country become a net exporter or will remained a net importer? It is in the light of the foregoing that this research aimed at examining the production pattern of rice in Nigeria. The specific objectives were to: examined the production trend and growth pattern of rice production; determined the extent and magnitude of production instability; determined the factors influencing farmers’ acreage allocation decision; and, forecast the production trend of rice in Nigeria.
RESEARCH METHODOLOGY
Time series data for production, area, yield, producer prices of both studied crop and competing crop, that spanned between 1961 to 2018; and sourced from FAO data bank were used. The production trend of rice was examined based on the reform periods viz. pre-Structural Adjustment Period (SAP)(1961-1984), SAP (1985-1999) and post-SAP (2000-2018) which marked the country’s economy. The collected data were analyzed using descriptive and inferential statistics. The first objective was achieved using descriptive statistics and compound growth model; the second objective was achieved using instability index and Hazell’s decomposition model; while the third and last objectives were achieved using Nerlove’s distributed lag model and ARIMA model respectively.
Model specification
Growth rate: The compound annual growth rate calculated using the exponential model is given below:


Where, CAGR is compound growth rate; t is time period in year; γ is area/yield/production; α is intercept; and, β is the estimated parameter coefficient.
Instability index: Coefficient of variation (CV), Cuddy-Della Valle Index (CDII) and Coppock’s index were used to measure the variability in the production, area and yield.

(Sandeep et al. 2016; and Boyal et al. 2015)
Where, σ is standard deviation and  is the mean value of area, yield or production

Where CDII is the Cuddy-Della instability index; CV is the coefficient of variation; and, R2 is the coefficient of multiple determination (Cuddy-Della Valle, 1978). The instability index classification is low instability (≤20%), moderate instability (21-40%) and high instability (>40%) (Shimla, 2014; and Umar et al. 2019).
Unlike CV, Coppock’s instability index give close approximation of the average year-to-year percentage variation adjusted for trend (Coppock, 1962; Ahmed and Joshi, 2013; Kumar et al. 2017; Umar et al. 2019).

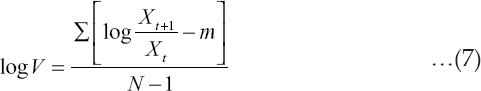
Where, Xt = Area or Yield or Production in year ‘t’, N = number of year(s), CII = Coppock’s instability index; m = mean difference between the log of Xt+1 and Xt; and, log V = Logarithm Variance of the series.
Source of change in production
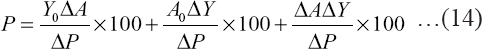
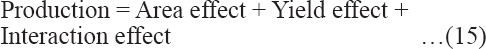
Instantaneous change: The instantaneous decomposition model as used by Sandeep et al. (2016) is given below:


Where, P, A and γ represent the production, area and yield respectively. The subscript 0 and n represent the base and the nth years respectively.


From equation (8) and (12) we can write

Therefore,
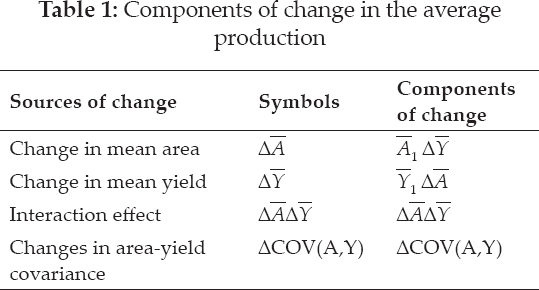
Hazell’s decomposition model: Following Hazell’s (1982) as adopted by Umar et al. (2017; 2019), the model is presented below:
(i) Changes in average production


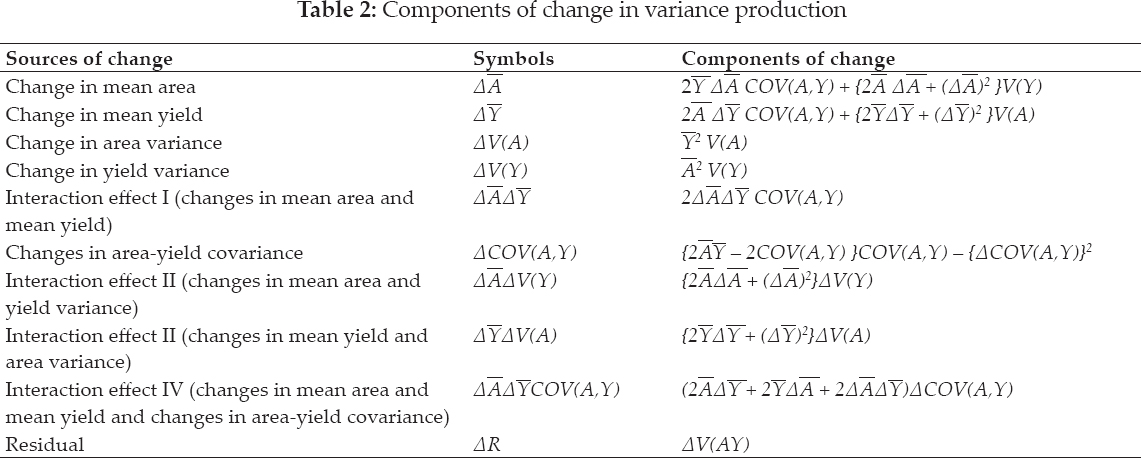
(ii) Change in variance decomposition

Nerlovian’s model: The Nerlove’s response model as used by Sadiq et al. (2017) is presented below:
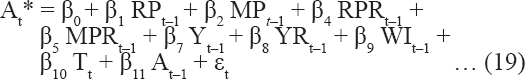
The first equation is a behavioural equation, stating that desired acreage (At*) depend upon the following independent variables:
Where,
At = current area under rice;
RPt-1 = one year lagged price of rice;
MPt-1 = one year lagged price of maize (competing crop);
RPRt-1 = one year lagged price risk of rice
MPRt-1 = one year lagged price risk of maize;
Yt-1 = one year lagged yield of rice;
YRt-1 = one year lagged yield risk of rice;
WIt-1 = weather index for rice;
Tt = time trend at period t;
At-1 = one year lagged area under rice;
β0 = intercept;
β1-n = parameter estimates; and,
εt = Disturbance term.
Price and yield risks were measured by the standard deviation of the three preceding years. For the weather index, the impact of weather on yield variability was measured with a Stalling’s index (Stalling, 1960; Ayalew, 2015).
…(20)
The number of years required for 95 percent of the effect of the price to materialize is given below (Sadiq et al. 2017):

Where;
r = coefficient of adjustment (1-coefficient of lagged area); and, n = number of year.
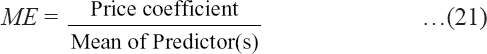
Marginal effect and price elasticities for semi-logarithm functional form are given below:


ARIMA
ARIMA in general form is as follows (Gujarati et
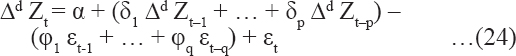
Where, Δ denotes difference operator like:


Here, Zt-1… …, Zt-p are values of past series with lag 1………, p respectively.
Forecasting Accuracy
For measuring the accuracy in fitted time series model, mean absolute prediction error (MAPE), relative mean square prediction error (RMSPE), relative mean absolute prediction error (RMAPE) (Paul, 2014), Theil’s U statistic and R2 were computed using the following formulae:


Where, R2 = coefficient of multiple determination, At = Actual value; Ft = Future value, and T = time period.
RESULTS AND DISCUSSION
Trend and Growth Pattern of Rice Production
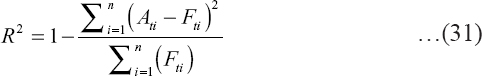
A cursory review of the overall period showed the production trend of rice to be on the increase with yield increase been the major driving force as its effect is more pronounced than the area effect (Fig. 1).
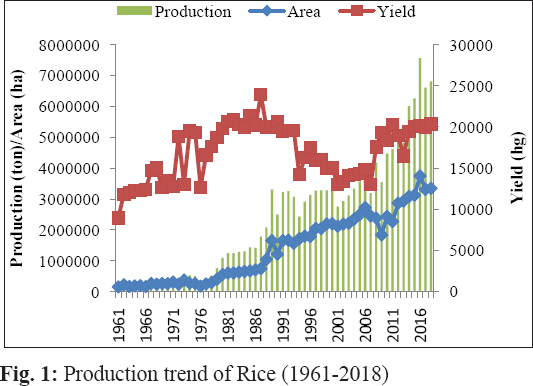
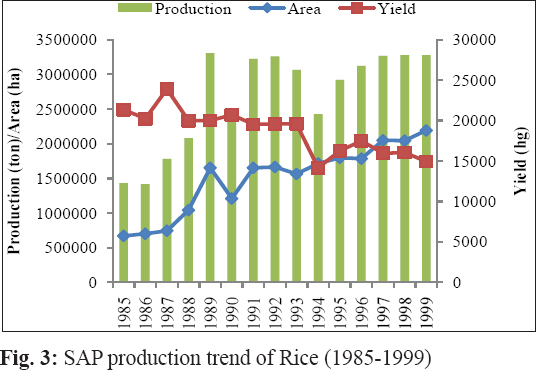
It was observed that the increase in the production trend of rice was marginal from 1961 to 1979 and thereafter, sprouts significantly from 1980 till the end of the studied period. Thus, it can be suggested that the production trend of rice has been driven mostly by technology alongside area expansion in the country. Furthermore, decomposition details showed yield effect to be more pronounced in determining increase in the production trend of rice during the pre-SAP period (Fig. 2). However, during the SAP transition, yield effect has minimal effect in driving the production trend of rice as gentle expansion in area effect dominate in determining the gentle rise in the production trend of rice (Fig. 3).
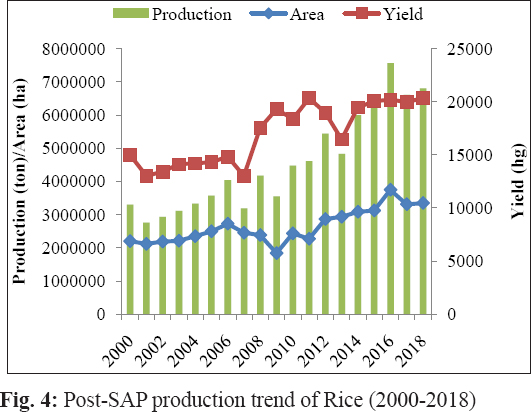
For the post-SAP era, the production trend of rice was marked by a gentle-to-steep rise in the production of rice with yield increase been gentle from year 2001 to 2006; then slightly declined in the year 2007; thereafter exhibited a cyclical trend with a steep rise between year 2008 to 2012 and 2014 to 2016. Though, it was noticed that the effect of yield in driving the production trend upward became slight at the end of the studied period (Fig. 4). Thus, it can be inferred that yield effect dominates in driving the production trend of rice upward during the pre-SAP and post-SAP transitions while area expansion dominates in driving rice production trend during the SAP period in the country. Thus, policy effects of the government intervention viz. technological advancement, credit policy, moral suasion, input subsidies and targeted programmes impacted positively on rice production before and aftermath of the SAP period.
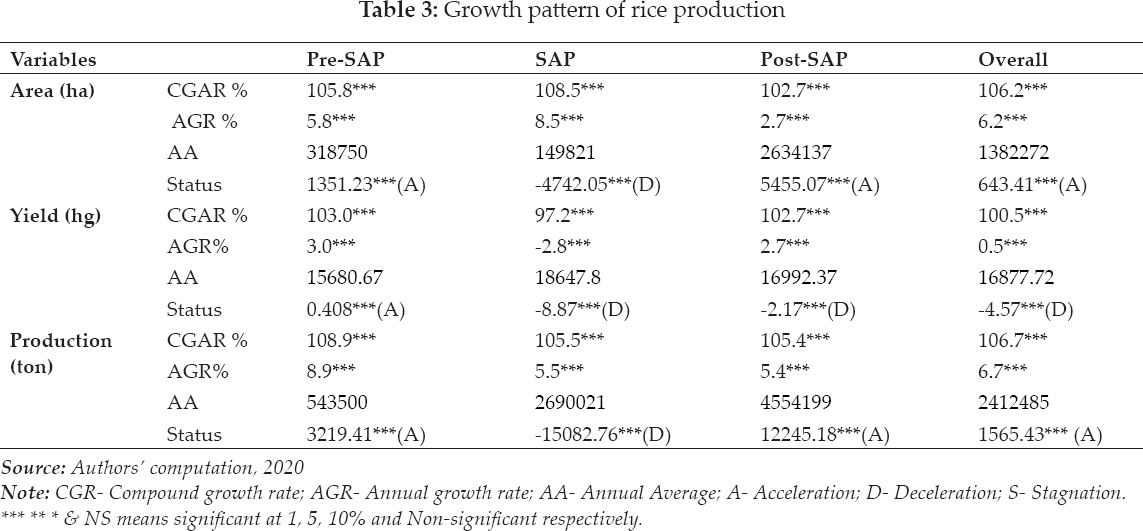
It was observed that the annual average production and area of rice increased hyperbolically through the transitional periods while yield observed increase between pre-SAP and SAP periods and thereafter it declined (Table 3). The results of the growth trend of rice showed the production to be marked by a positive annual growth rate of 8.9% during the pre-SAP era with the influence of annual growth rate of area (5.8%) been more pronounced than the yield annual growth rate (3.0%). During the SAP period, production and area of rice witnessed an annual positive growth rate of 5.5% and 8.5% respectively, while yield was marked by an annual negative growth rate of -2.8%. For the post-SAP transition, production, area and yield of rice witnessed positive annual growth rates of 5.4%, 2.7% and 2.7% respectively (Table 3). Thus, it can be inferred that area growth predominates in driving the production growth of rice during the pre-SAP and SAP while both area and yield growth simultaneously determined the positive growth rate witnessed by the production. In addition, area expansion transient through the transition periods as against yield growth which witnessed positive growth rate during the pre-SAP and post-SAP and plummeted during the SAP period. Generally, for the overall period, the growth trends of production and area were almost at par i.e. 6.7% and 6.5% respectively, while yield growth rate was 0.5%. This revealed the overwhelming influence of area expansion in driving the production growth rate of rice with influence of yield growth been minimal.
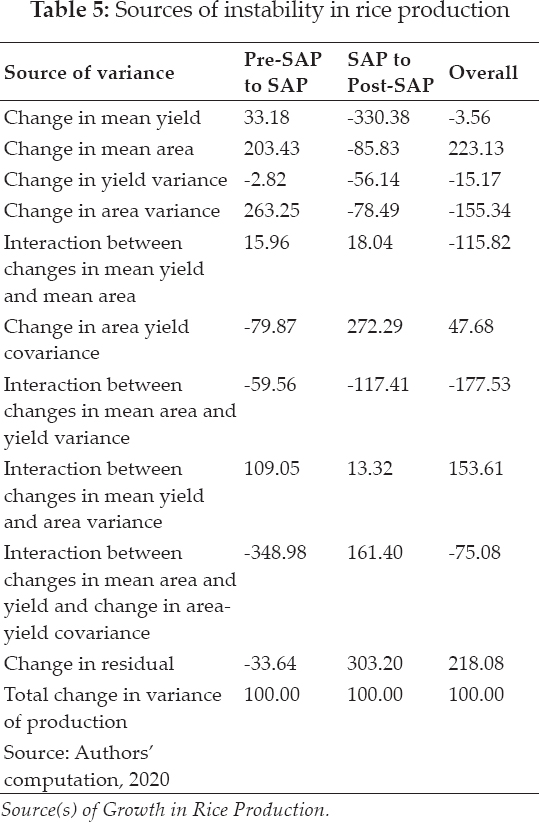
Extent and Sources of Instability
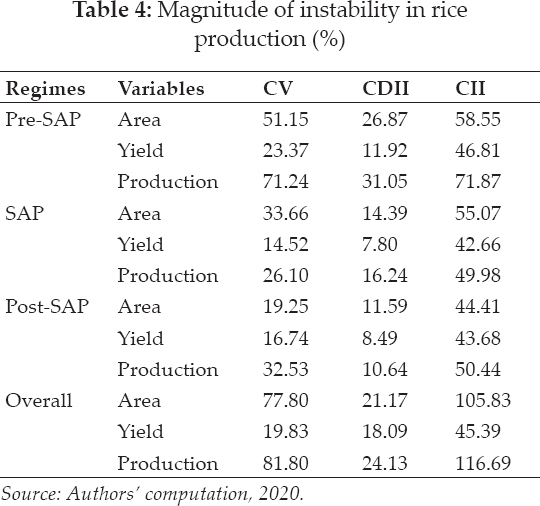
The CV index showed instability of production to be high during the pre-SAP (71.24%) and thereafter, the shock declined to a moderate status during the succeeding transitional periods i.e. SAP and post-SAP periods, as indicated by the CV index which is within the range of 20–40%. Though, for the overall period, the production level of rice fluctuated at an extreme high rate as indicated by the CV index of 81.80%. It was observed that the heightened shock in the production volatility during the pre-SAP and the overall periods was triggered by high fluctuation in area expansion as shocks emanating from yield was moderate for the former and low for the latter. While the moderate shock that marked the production level during the SAP and post-SAP periods owed to moderate fluctuation in area expansion, as yield volatility was low for the former while a simultaneous low volatility in both area expansion and yield accounted for the moderate shock for the latter (Table 5). Furthermore, in determining the exact direction of the instability in the production of rice viz. CDII, it was observed that the production of rice witnessed moderate shock during the pre-SAP and the overall period; and, low shock during the SAP and post-SAP periods (Table 5). The moderate shock which marred the production during the pre-SAP and the overall periods owed to the moderate shock which emanates from area expansion, as yield effect transmits low shock. However, for the low instability in the production of rice which was witnessed by SAP and post-SAP regimes, a simultaneous low shock transmitted by both area and yield effects were the driving factors.
Examining the effect of price fluctuation on production instability (CII), instability in production across the regime shifts were observed to be high and both area and yield were responsible, as shocks emanating from them were both virulent (Table 4). Therefore, it can be inferred that market imperfection due to imbalance between supply and demand caused high instability in the production of rice in the country.
Furthermore, it was observed that the source of production variability vis-a-vis pre-SAP and SAP was largely due to ‘change in mean area’ and ‘change in area variance’. Between the SAP and post-SAP transitional shift, ‘residual effect” i.e. uncertainty alongside ‘change in area yield covariance’ were the dominant factors which caused variability in the production of rice in the studied area. In addition, for the overall period, ‘change in mean area’ and ‘residual effect’ were found to be the major sources of instability in the production trend of rice in the studied area (Table 5). Thus, it can be inferred that variability in the production level of rice owed to area risk which is concerned with area expansion and uncertainty which has to do with weather variability. Innovation viz. introduction of technologies had minimal effect on rice output recorded in the country, thus the need for realistic intervention so as to ensure food security of rice production in the studied area.
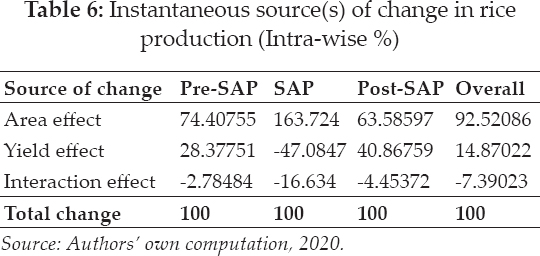
The results of the instantaneous source of growth in the production level showed ‘area effect’ to be the major source of increase in the production level of rice across the transitional periods. However, yield showed a minimal effect in increasing the production level of rice across the regime shifts while the ‘interaction effect’ caused a decline in the production level across the transitional periods under consideration. In addition, for the overall period, ‘area effect’ dominates in increasing the production level of rice alongside minimal influence of ‘yield effect’, while ‘interaction effect’ caused a decline in the production level of rice in the studied area (Table 6).
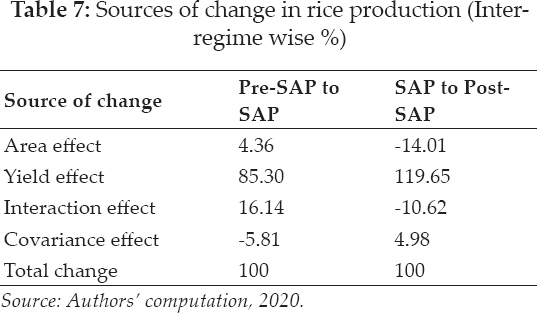
Furthermore, a cursory review of the source of growth in the production between two transitional periods showed ‘change in area’ to be the major factor that caused an increase in the production level between pre-SAP and SAP periods; and, also between SAP and post-SAP periods (Table 7). Thus, it can be inferred that area expansion was responsible for the production level of SAP to be higher than that of the pre-SAP; likewise that of post-SAP over the SAP regime. The concurrent rise in the production of rice through the transitional periods was mainly due to area expansion with the effect of productivity been marginally. This obviously did not come as a surprise as for almost two decades, the country heavily relied on importation of rice to bridge the wide gap between demand and supply as the local production cannot meet the country’s rice food security.
Source: Authors' computation, 2020.
Farmers’ Acreage Response
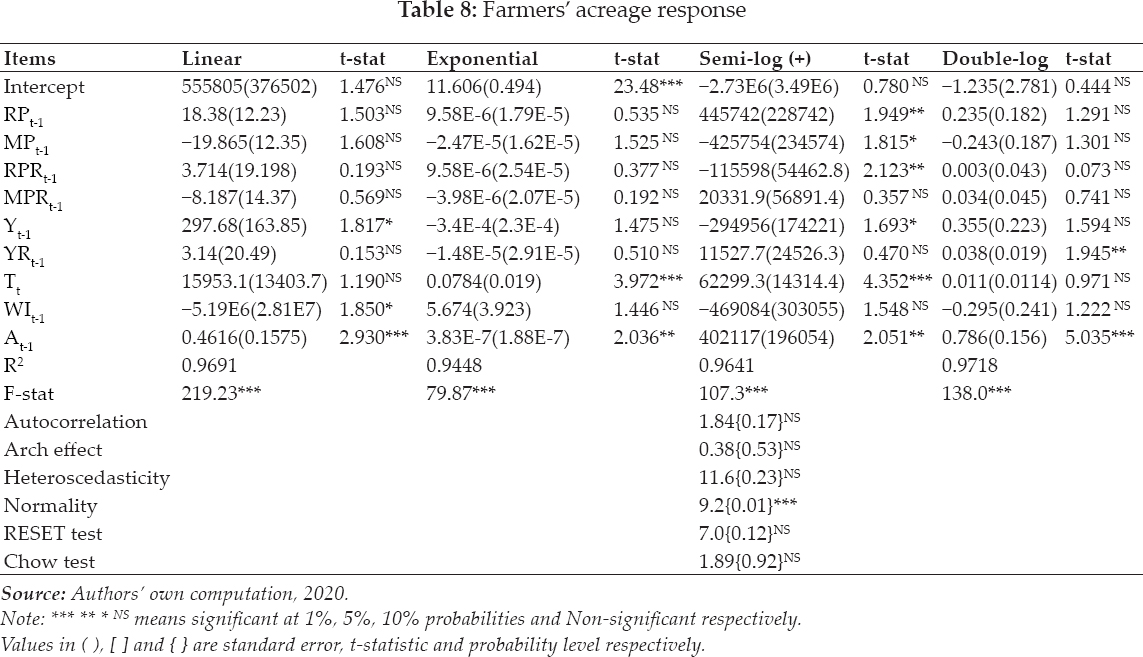
Of the four functional forms subjected to the Nerlove’s regression model, the semi-logarithm functional form was found to be the best fit as it satisfied tri-aggregates criteria viz. economic theory, statistical criterion and econometric criterion. In addition, the model passed the requisites diagnostic tests: the residual is devoid of serial correlation, heteroscedasticity and Arch effect as indicated by the test statistics which were outside the plausible margin of 10% degree of freedom. However, the residual was found not to be normally distributed as evident by the chi-square statistic which is below the plausible margin of 10% degree of freedom. Though, non-normality is not considered a serious problem as data in their natural form are mostly not normally distributed. Evidences of structural break in the equation, inadequate specification of the model, non-stability of the parameter estimates were absent as indicated by chow test, RESET test and CUSUM test statistics respectively, which were not different from 10% error gap (Table 8). Thus, it can be inferred that the parameter estimates are reliable for future prediction with certainty and efficiency.
The value of the coefficient of multiple determination (R2) being 0.9617 reveals that 96.17% variation in the current acreage under rice cultivation is been influenced by the technical, price and institutional factors included in the model. The empirical evidence showed that farmers’ acreage allocation decision was influenced by lagged yield, lagged price of rice, lagged price of the competing crop (maize), lagged rice price risk and time as evident by their respective parameter estimates which were within the acceptable margin of 10% degree of freedom.
The significant of lagged yield implied that poor yield owing to inadequate technological advancement plummeted productivity in the studied area, thus a disincentive on farmers’ acreage allocation decision. The lagged price of rice turn-out to be an incentive which encouraged the farmers to increase the current area allocated to rice as revealed by its estimated coefficient which is within the acceptable margin of 10% degree of freedom. The short-run and long-run elasticities of acreage responsiveness to price changes were 0.31 and 0.43 respectively (Table 9). Thus, based on the reflection of long-run elasticity, it can be inferred that the impact of price policy instrument would be little or insignificant in the long-run.
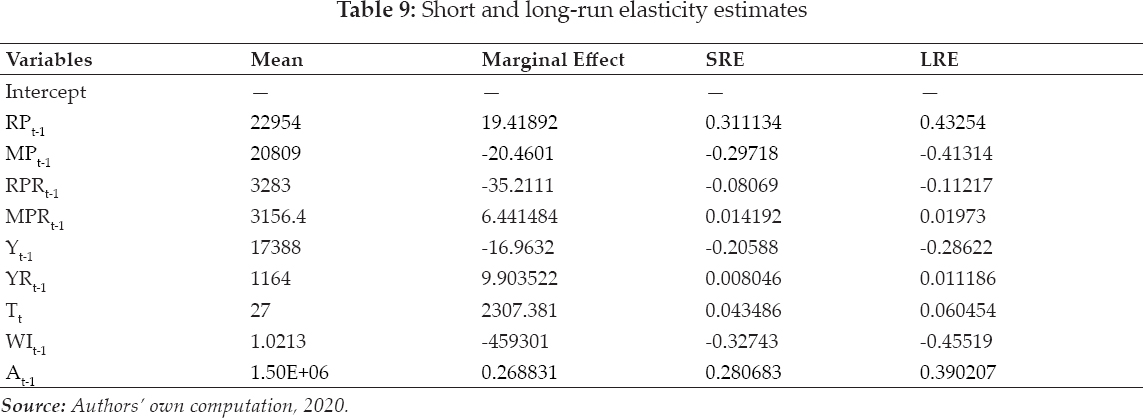
Furthermore, the empirical evidence showed that large substantial time viz. 9.1 years was taken for the price effect of rice to materialize or adjust. Thus, it can be concluded that the farmers faced higher institutional and technological constraints in the production of rice. The higher the constraint, the more is the time needed for adjustment.
It was observed that the lagged price of the competing crop affected the current acreage allocated to rice in the studied area. Thus, dampening of rice price owing to glut would force farmers to switch to the production of alternative crop in order to earn remunerative income. The negative significant of the lagged rice price risk indicated that the farmers were risk averters of price variability and any price fall would be a disincentive to the farmers, thus affecting the current allocation cultivated under rice.
The positive significant of the time trend coefficient implied that the different policy programmes witnessed by the country’s economy favoured the rice sub-sector. This did not come as a surprise given that both present and past governments had implemented specific policies targeted at boosting rice production for food security and export purposes. Also, it was observed that the current acreage was positively influenced by the lagged acreage cultivated under rice in the studied area. The estimated adjustment coefficient was 0.28, implying small adjustment of the area under rice. In addition, the positive effect of the lagged area of rice indicates lesser rigidity in the adjustment of area cultivated under the studied crop.
Production Forecast of Rice
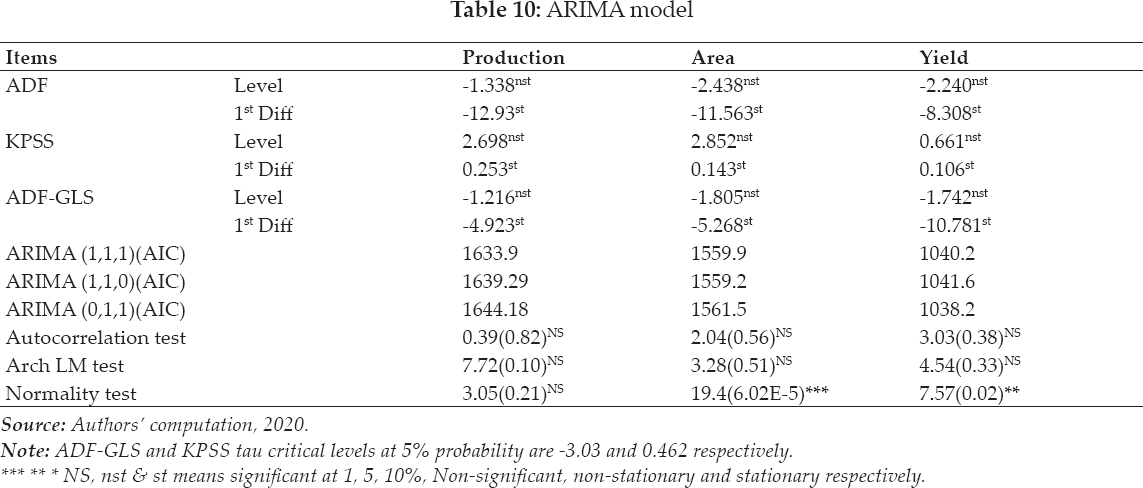
The results of the unit root tests viz. ADF and KPSS tests showed evidence of trend in the variables at level but after first difference, trends were absent, indicating that the variables were stationary. Because of the weakness inherent in ADF test, the validity of the results was tested using ADF-GLS test, and its results confirm the reliability of the ADF results (Table 10). Furthermore, for the forecast, results of ARIMAs at different level showed ARIMA (1,1,1), ARIMA (1,1,0) and ARIMA (0,1,1) to be the best fits and reliable to predict production, area and yield respectively (Table 10). These chosen ARIMAs passed the pre-requisite diagnostic tests viz. no autocorrelation and no Arch effect as indicated by their respective test statistics which were outside the acceptable margin of 10%. However, with the exception of production variable all the remaining variables had their residual not to be normally skewed as indicated by their respective chi2 test statistics which were within the plausible margin of 10%. Non-normality of a residual is not considered a serious problem as data in their natural form are mostly not normally distributed. Thus, with these satisfactory evidences, it can be inferred that these chosen models are valid for prediction of the variable concern with certainty, consistency and efficiency.
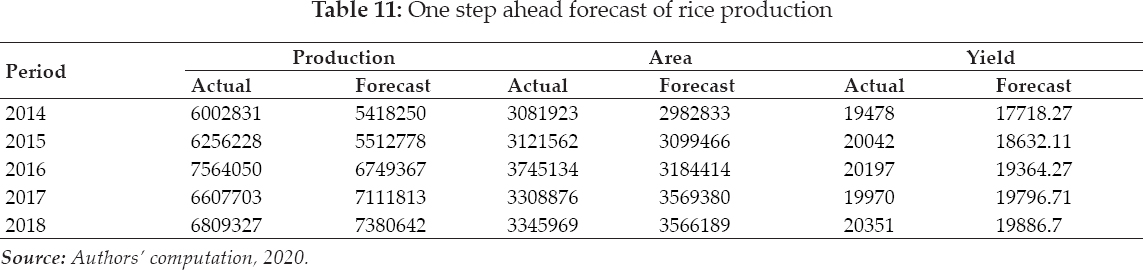
Furthermore, the validity of the predictive power of the chosen ARIMAs and how closely they could track the path of the actual observations were verified through the one-step ahead forecast (Table 11).
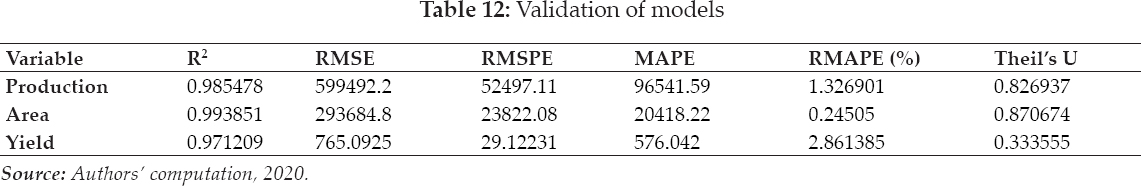
In addition, the empirical evidence showed that the chosen ARIMAs were reliable for prediction as indicated by their respective Theil’s inequality coefficient (U) and the relative mean absolute prediction error (RMAPE) which were less than 1 and 5% respectively (Table 12). Thus, the selected ARIMAs can be used for ex-ante projection with high projection validity and consistency as the predictive error associated with the estimated equations in tracking the actual data (ex-post prediction) are insignificant and low.
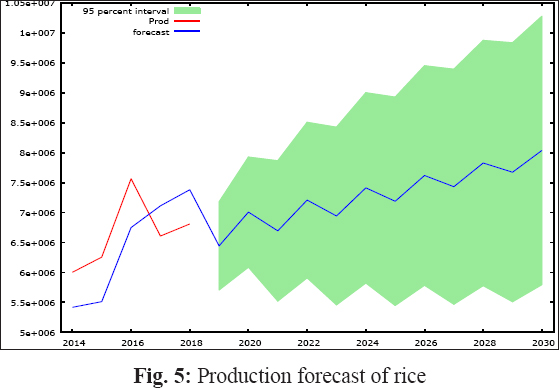
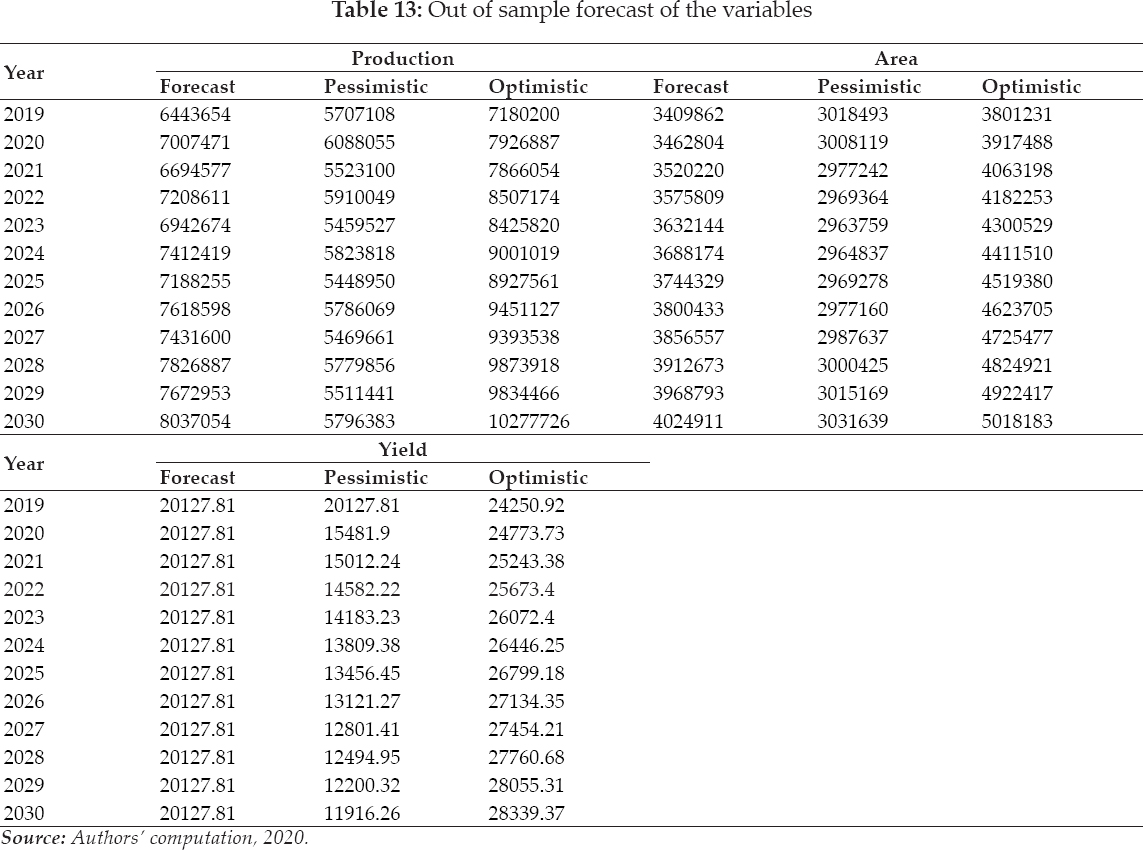
The results of the one-step-ahead out of the sample forecast for the period 2019 to 2030 revealed a fluctuating trend that would be marked by a gentle rise in the production of rice in the studied are (Table 13 and Fig. 5). This showed that the production will rise and subsequently decline, this will persist till the end of the forecasted period.
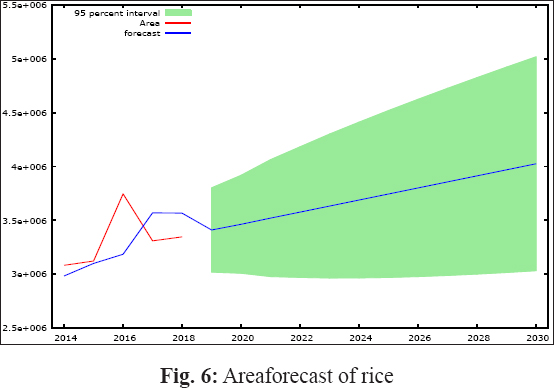
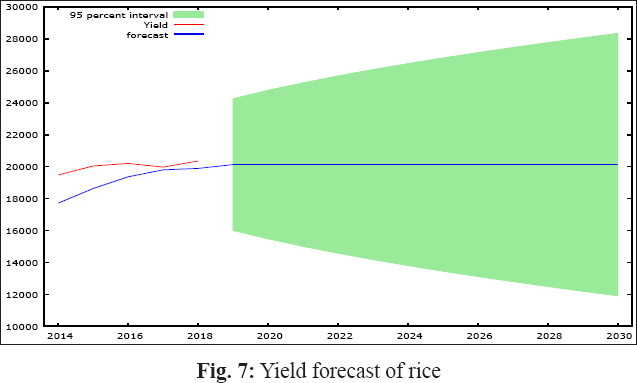
This systematic production trend would be caused by area trend which will exhibit gentle rise (Fig. 6) and yield whose trend would be stagnant (Fig. 7). Therefore, it can be inferred that the production of rice would be driven by area expansion with little or no effect of technology. This vividly showed that the rice food security of the nation will be threatened in the next decade if concerted efforts are not put in place. The chance of the country in becoming a net exporter in the next few years is very narrow. Therefore, policymakers should concentrate on how to achieve rice food security as the forecast ahead showed that the country is likely to remain a net importer of rice. Thus, the study recommends the need for adequate and proper investment on advanced technologies and infrastructures so as to achieve sustainable and steady production increase that will guarantee rice food security in the country.
CONCLUSION AND RECOMMENDATIONS
Based on the findings it can be inferred that yield had pronounced effect on the production of rice along side area expansion. A steep rise in the trend of production commenced from the period of SAP to post-SAP era. However, the empirical evidence of growth rate showed the production of rice to be majorly driven by area expansion with yield growth been marginal. The growth rate of rice production was on the decline through the transitional periods; area witnessed a surged in the growth rate during the SAP period and thereafter declined during the succeeding period. The yield recorded a positive growth rate during the pre-SAP phase and thereafter became negative during the SAP period but revived to a positive growth rate during the post-SAP period. Furthermore, the rice production throughout the economic phases was not in the comfort zone as area was marred by high instability, thus causing high fluctuation in the production of rice in the studied area. It was observed that the farmers’ acreage allocation decision was governed by price and institutional factors. The future food security of rice is not promising as rice production would be marked by a fluctuating trend. Thus, concerted efforts need to put in place in order to achieve rice food security; otherwise the country would remain a net importer.
REFERENCES
Ahmed, S.I. and Joshi, M.B. 2013. Analysis of instability and growth rate of cotton in three district of Marathwada.
Ayalew, B. 2015. Supply response of maize in Ethiopia: co-integration and vector error correction approach.
Boyal, V.K., Pant, D.C. and Mehra, J. 2015. Growth, instability and acreage response function in production of cumin in Rajasthan.
Coppock, J.D. 1962. International Economic Instability. McGraw-Hill, New York, pp. 523–525.
Cuddy, J.D.A. and Valle, P.A.D. 1978. Measuring the instability of time series data.
George, L. 2020. A growing problem: Nigerian rice farmers fall short after borders close. https://www.reuters.com/article/us-nigeria-economy-rice/a-growing-problem-nigerian-rice-farmers-fall-short-after-borders-close-idUSKBN1ZM109.
Gujarati, D., Porter, D. and Gunasekar, S. 2012. Basic Econometrics. McGraw Hill, New Delhi.
Hazell, P.B.R. 1982. Instability in Indian food grain production. Research Report 30, Washington, D.C., USA: International Food Policy Research Institute.
KPMG. 2019. Rice industry review. https://home.kpmg/ng/en/home/insights/2019/10/rice-industry-review.html
Kumar, N.S, Joseph, B. and Muhammed, J.P.K. 2017. Growth and Instability in Area, Production, and Productivity of Cassava (
Paul, R.K. 2014. Forecasting wholesale price of pigeon pea using long memory time-series models.
Russon, M. 2019. Boosting rice production in Nigeria. https://www.bbc.com/news/business-47858725.
Sadiq, M.S., Singh, I.P. and Karunakaran, N. 2017. Supply response of cereal crop farmers to price and non-price factors in Rajasthan state of Nigeria.
Sandeep, M.V., Thakare, S.S. and Ulemale, D.H. 2016. Decomposition analysis and acreage response of pigeon-pea in western Vidarbha.
Sihmla, R. 2014. Growth and instability in agricultural production in Haryana: A District level analysis.
Stalling, J.L. 1960. Weather indexes.
Umar, S.M., Suhasini, K., Jainuddin, S.M. and Makama, S.A. 2019. Sources of growth and instability in cassava production in Nigeria: An evidence from Hazell’s Decomposition Model.
Umar, S.M., Suhasini, K., Sadiq, M.S. and Aminu, A. 2017. Growth and Instability in Yam Production in Nigeria: An Inter Zone and State Level Analysis.