Economic Affairs, Vol. 65, No. 4, pp. 473-479, December 2020
DOI: 10.46852/0424-2513.4.2020.1
![]()
Research Paper
Forecasting of Potato Prices in India: An Application of ARIMA Model
ABSTRACT
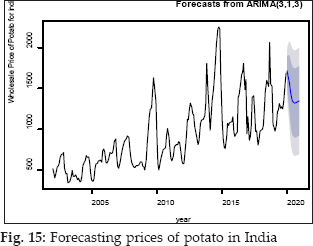
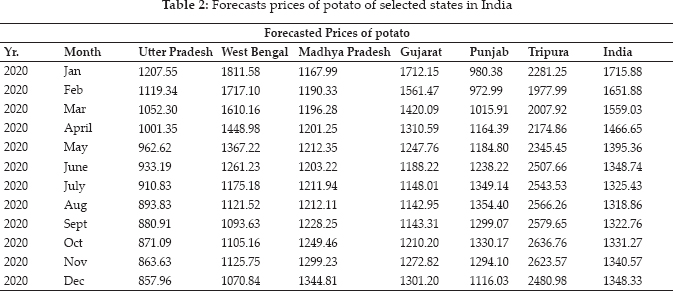
In the present paper, Autoregressive Integrated Moving Average (ARIMA) models developed to forecast the prices of potato using time series data of eighteen years from 2002–2019. The best models selected by comparing Akaike Information Criteria (AIC), Bayesian Information Criteria (BIC), Mean Absolute Percent Error (MAPE), and Root Mean Square Error (RMSE). The study revealed that ARIMA (1,1,2), ARIMA (2,1,1)(0,0,2)[12], ARIMA (2,1,2), ARIMA (1,1,4)(0,0,1)[12], ARIMA (1,1,1)(0,1,2)[12], ARIMA (0,1,0) (0,1,1)[12], and ARIMA (3,1,3) were the best fitted models for forecasting of price of potato for the states of Utter Pradesh, West Bengal, Madhya Pradesh, Gujarat, Punjab, Tripura and India respectively. The prices of potato in Utter Pradesh, West Bengal and India will be increasing with the first-quarter providing the highest price. The prices of potato in Madhya Pradesh and Tripura will be highest in the fourth quarter. In Punjab, the prices of potato will be increasing with the third-quarter. The forecast shows that market prices of potato in Utter Pradesh, West Bengal, Madhya Pradesh, Gujarat, Punjab, Tripura, and overall India would be ruling in the highest value of .1208 ₹/qt, 1812 ₹/qt, 1345 ₹/qt, 1712 ₹/qt, 1354 ₹/qt, 2636 ₹/ qt, and 1715 ₹/qt respectively for the year 2020.
Highlights
 The ARIMA models forecasted in 2020 showed the prices of potato in Utter Pradesh, West Bengal, and India will increase with the first-quarter providing the highest price.
Keywords: ARIMA, SARIMA, MAPE, Forecasting, Time Series, etc.
Potato (Solanum tuberosum) is one of the important crops of the world. In terms of food consumption, it is the third most focal food crop in the world next to wheat and rice. In India, the potato is not primarily a staple but a cash crop that provides substantial income for farmers. In India, out of total 5.34 million, ha of land under vegetables, potato occupies nearly 20.79 percent area. It is the world's number one non-grain food commodity, consumed by more than one billion people worldwide. Therefore, it is a highly recommended food security crop that can help low earning farmers and vulnerable consumers ride out extreme events in world food supply and demand. Consumer prices of essential commodities of daily use are a susceptible issue. The consumer suffers in case prices of consumable items are high. In contrast, the producer suffers when prices are too low to recover the cost of production. The price of consumable elements determined by the demand and supply of that particular commodity. If supply is short of demand, then the price will increase.
Under tropical and sub-tropical conditions, the losses due to poor handling and storage reported to be between 40–50 percent (Mithiya, 2019). The post-harvest losses of potatoes defined as qualitative and quantitative losses. The qualitative losses significantly reduce the price of potatoes. Potato prices fluctuate over seasons due to the variations in production and market arrival. Price fluctuations are a matter of concern among consumers, farmers, and policymakers, and its accurate forecast are crucial for efficient monitoring and planning, hence there is a need to identify the influencing factors of these fluctuations. Moreover, to quantify the impact of these factors on prices to understand changes in prices accurately.
How to cite this article: Kumar, R.R. and Baishya, M. (2020). Forecasting of Potato Prices in India: An Application of ARIMA Model. Economic Affairs, 65(4): 473–479.
Source of Support: None; Conflict of Interest: None ![]()
Dhakre and Bhattacharya (2014) worked on the price behavior of potato and their forecasting in the Agra market using the ARIMA models. Gupta et al. (2018) forecasting arrivals and prices of pulses in Chhattisgarh. Darekar et al. (2016) validated that the ARIMA model forecasted onion prices in Kolhapur and Yeola markets. Ozer and Ilkdogan (2013) examined cotton prices in the world by ARIMA model, by using 102 per month, which covered the period January 2004 and June 2012 of the world price of cotton. Keeping in view the above situation Autoregressive Integrated Moving Average (ARIMA) models were developed to forecast the prices of potato for the states of Utter Pradesh, West Bengal, Madhya Pradesh, Gujarat, Punjab, Tripura, and India respectively. The aim is also to forecast future prices of potatoes by taking into account past trends and fluctuations in the prices.
MATERIALS AND METHODS
This study focuses on estimating the future price of potato in major producing states in India. To achieve this, we applied time series on the potato price data recorded throughout January 2002 to December 2019, which obtained from the AGMARKNET website as per the availability. The monthly wholesale price data of January 2002 to December 2018 was used for model predictions and from January 2019 to December 2019 was used for validation. By using R software, the data analyzed to fit the best model using an autoregressive integrated moving average (ARIMA) model. The selected best models were used to forecast the prices of potato in Utter Pradesh, West Bengal, Madhya Pradesh, Punjab, Gujarat, Tripura, and India up to December 2020.
Analytical Method
ARIMA is one of the most traditional methods of nonstationary time series analysis. In contrast to the regression models, the ARIMA model allows time series to be explained by its past or lagged values and stochastic error terms. The models developed by this approach usually called ARIMA models because they use a combination of autoregressive (AR), integration (I)-referring to the reverse process of differencing to produce the forecast and moving average (MA). The ARIMA (p, d, q) model can be represented by the following general forecasting equation:
Where, Yt is pricing, μ. is the mean of series, the ϕ1 … ϕp are the parameters of the AR model, the θ1, … θq are the parameters of the MA model and the εt, εt-1, …, εt-q are the noise error terms. Where “p” stands for the order of the autoregressive process, ‘a’ is the order of the data stationary, and ‘q’ is the order of the moving average process. Seasonal ARIMA model is to be denoted by ARIMA (p, d, q) (P, D, Q), where P denotes the number of seasonal autoregressive components, Q denotes the number of seasonal moving average terms and D denotes the number of seasonal differences required to induce stationarity discussed Box et al. (1994). The steps, which were followed to define an ARIMA model as stated by Box and Jenkins:
(a) Identifying the presence of trends
The stationary check of time series data was performed, which revealed that the potato prices were non-stationary. We will have to test the differenced time series for stationarity (unit root problem) by the Augmented Dickey-Fuller test (ADF). The nonstationary time series data were made stationary by first-order differencing. After that, best fit ARIMA models were developed using the data from January 2002 to December 2018 and used to forecast the prices of potato for the year 2020. Candidate ARIMA models, were identified by finding the initial values for the orders of non-seasonal parameters p and q. They were obtained by looking for significant spikes in autocorrelation and partial autocorrelation functions.
(b) Identifying the best-fit model to explain the data
The best-fitted model was selected based on the low value of Akaike Information Criteria (AIC), Bayesian Information Criteria (BIC), Mean Absolute Percent Error (MAPE), and Root Mean Square Error (RMSE).
(c) Model validation
The fitted ARIMA model to be validate before using the forecasted results for broader use. The model was verified for accuracy by examining the residuals of the model using the autocorrelation function (ACF) and partial ACF (PACF). If the model shows random residuals, it indicates that the identified model is adequately predicts future prices and vice versa. The ACF and PACF residuals considered random, when all their ACFs were within limits. After satisfying the adequacy of the fitted model, it can be use for forecasting future prices.
RESULTS AND DISCUSSION
Model identification
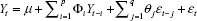
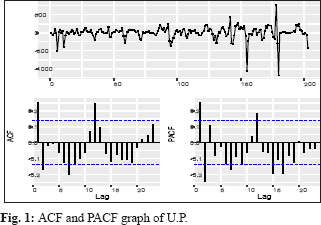
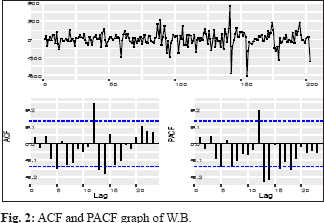
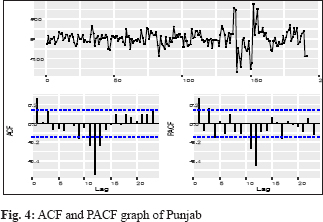
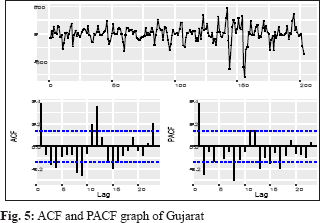
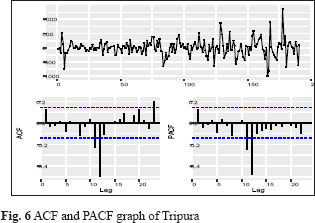
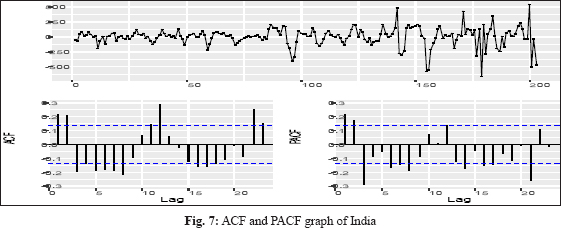
Identification of the model was concerned with deciding the appropriate values (p, d, q) (P, D, Q). To check the stationarity of price series of potato, the Augmented Dickey-Fuller unit root tests used. The test confirmed that the data was non-stationary for without difference. In this case, differencing of lag 1 gave a significant result, so with differencing of lag 1(d =1) is stationary in respect to mean and variance. Thus, there is no need for further differencing the time series, and then the adopted difference order is d = 1 for the ARIMA (p, d, q). This test allows going further in the steps for the ARIMA model development, which are to find out the appropriate values of (p, d, q) (P, D, Q). It was done by observing the Auto Correlation Function (ACF) and the Partial Auto Correlation Function (PACF) values. The Auto Correlation Function helps in choosing the appropriate values for the ordering of moving average terms (MA) and the Partial AutoCorrelation Function for those autoregressive terms (AR). The autocorrelation function and the partial autocorrelation function for Utter Pradesh, West Bengal, Madhya Pradesh, Punjab, Gujarat, Tripura, and India were obtained and presented in Fig. 1-7.
Identifying the best-fit model to explain the data
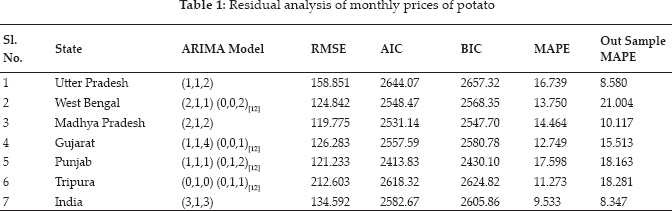
After the identification of the appropriate values of (p, d, q) (P, D, Q), the best-fitted models were selected based on the lowest values of RMSE, MAPE, AIC, and BIC. The model ARIMA (1,1,2), ARIMA (2,1,1) (0,0,2)[12], ARIMA (2,1,2), ARIMA (1,1,4)(0,0,1)[12], ARIMA (1,1,1)(0,1,2)[12], ARIMA (0,1,0)(0,1,1)[12], and ARIMA (3,1,3) were identified the best fitted models for Utter Pradesh, West Bengal, Madhya Pradesh, Gujarat, Punjab, Tripura, and India respectively. The results of these coefficients given in Table 1. A careful examination of ACF and PACF up to 24 lags of West Bengal, Gujarat, Punjab, and Tripura revealed the presence of seasonality.
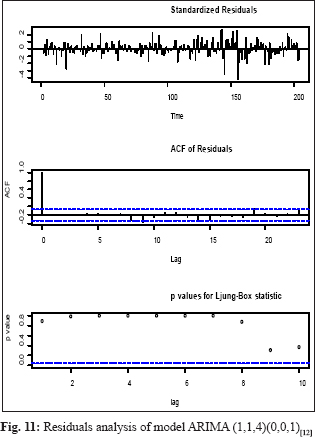
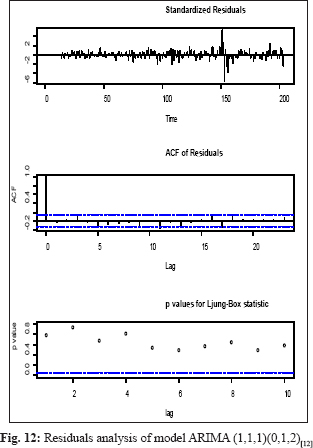
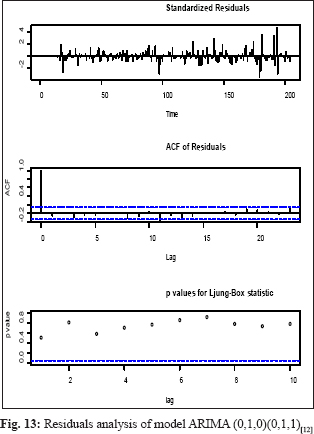
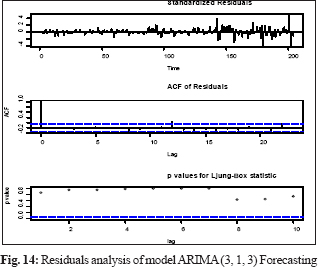
Model validation
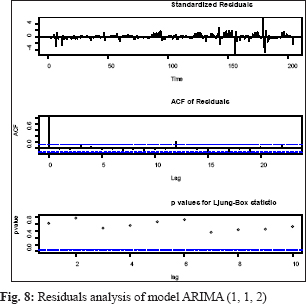
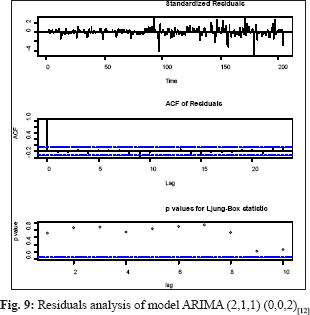
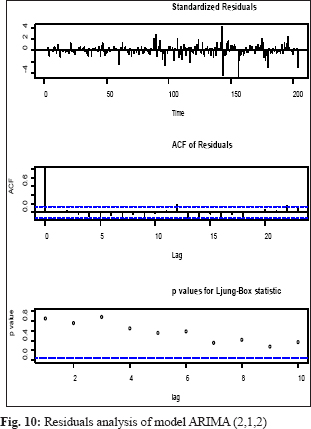
The model validation checked using ACF and PACF plots and distribution of residuals by the Ljung-Box test plot, a statistical test that assesses whether any of a group of autocorrelations of a time series are different from zero which will influence the accuracy of the model. The potato price residual plots evaluate autocorrelations of the selected model. It was determined that most spikes fall within significance limits, which indicates that the model residuals (errors) are not autocorrelated. The fitted model is valid and can be used for making a forecast, and the residuals are normally and independently distributed. The result of Box Ljung Q statistics represented in Fig. 8-14. Out of sample MAPE, values were also present in the permissible range sown in Table 1.
The forecasted results of the prices of potato shown in Table 2. The forecasted prices of potato in the selected states were showed a random trend in the coming months. The forecast shows that market prices of potato in Utter Pradesh, West Bengal, Madhya Pradesh, Gujarat, Punjab, Tripura, and overall India would be ruling in the highest value of ₹ 1208 /qt, ₹ 1812 /qt, ₹ 1345 /qt, ₹ 1712 /qt, ₹ 1354 /qt, ₹ 2636 /qt, and ₹ 1715 /qt respectively for the year 2020. The price of potato fluctuated widely over the months. The prices of potato in Utter Pradesh, West Bengal, Gujarat, and India would be high in the period from January to May and then after more or less constant. The prices of potato in Madhya Pradesh and Tripura showed an increasing trend and pick from September to November. In Punjab, the forecasted prices of potato fluctuated widely over the months. We can also see the prices of potato in India would be high as compare to selected states except for Tripura.
CONCLUSION
In the study, ARIMA (1,1,2), ARIMA (2,1,1) (0,0,2)[12], ARIMA (2,1,2), ARIMA (1,1,4)(0,0,1)[12], ARIMA (1,1,1)(0,1,2)[12], ARIMA (0,1,0)(0,1,1)[12], and ARIMA (3,1,3) models were developed for forecasting price of potato for the states of Utter Pradesh, West Bengal, Madhya Pradesh, Gujarat, Punjab, Tripura, and India respectively. The models showed a good performance in the case of explaining variability in the data series and also, it's predicting ability. Darekar et al. (2015) to forecast the prices and arrivals of agricultural commodities and drawn conclusions used a similar model. The models forecasted that in 2020, the prices of potato in Utter Pradesh, West Bengal, and India would increase with the first-quarter providing the highest price. The prices of potato in Madhya Pradesh and Tripura will be highest in the fourth quarter. In Punjab, the prices of potato will increase with the third-quarter. Therefore, farmers can use forecast price information to hedge their positions by storing potato in cold storage, selling them in other markets where prices are higher. We also recommended that the Government would use it and come up with price control policies that will guarantee farmers a stable price.
REFERENCES
Barathi, R., Havaldar, Y.N., Meregi, S.N., Patil, G.M. and Patil, B.L. 2011. A study on market integration of Ramanagaram and Siddlaghatta markets and forecasting of their prices, and arrivals. 3: 347–349.
Box, G.E.P., Jenkin, G.M. and Reinse, G.C. 1994. The time-series analysis, forecasting, and control. 3rd ed, Prentice-Hall, Englewood Cliffs, N.J.
Box, G.E.P. and Jenkin, G.M. 1976. Time-Series of Analysis, Forecasting, and Control. Sam Francisco, Holden-Day, California. the USA.
Burark, S.S. and Sharma, H. 2012. Price Forecasting of Coriander: Methodological Issues. Agricultural Economics Research Review, 25(Conference Number), 530.
Darekar, A.S., Pokharkar, V.G., Gavali, A.V. and Yadav, D.B. 2015. Forecasting the prices of onion in Lasalgaon and Pimpalgaon market of Western Maharashtra. International Journal of Tropical Agriculture, 33(4): 3563–3568.
Darekar, A.S., Pokharkar, V.G. and Datarkar, S.B. 2016. Onion Price Forecasting in Kolhapur Market of Western Maharashtra Using ARIMA Technique. International Journal of Information Research and Review, 3(12): 3364–3368.
Dhakre, D.S. and Bhattacharya, D. 2014. Price Behaviour of Potato in Agro Market - A Statistical Analysis. Indian Res. J. Ext. Edu., 14(2): 12–15.
Gupta, A.K., Singh, A.K. and Rao, V.S. 2018. Forecasting of Arrivals and Prices of Major Pulses in Chhattisgarh Using ARIMA Models. The Andhra Agric. Journal, 65(4): 990–993.
Mithiya, D., Mandal, K. and Datta, L. 2019. Forecasting of Potato Prices of Hooghly in West Bengal: Time Series Analysis Using SARIMA Model. IJAE, 4(3): 101–108.
Ozer, O.O. and Ilkdogan, U. 2013. The world cotton price forecasting by using the Box-Jenkins model. Journal of Tekirdag Agricultural Faculty, 10(2): 13–20.
Sharma, H. 2015. Applicability of ARIMA models in the wholesale wheat market of Rajasthan: An Investigation. Economic Affairs, 60(4): 687–691.
Shukla, M. and Jharkharia, S. 2011. Applicability of ARIMA models in the wholesale vegetable market, An investigation. Int. Conference on Industrial Engineering and Operations Management. Kuala Lumpur, Malaysia, 22–24.